. 2017 Aug 15;7(1):8228.
doi: 10.1038/s41598-017-08246-w.

Pupil Size Tracks Attentional Performance In Attention-Deficit/Hyperactivity Disorder

Affiliations

Pupil Size Tracks Attentional Performance In Attention-Deficit/Hyperactivity Disorder

G Wainstein et al. Sci Rep. .

Abstract

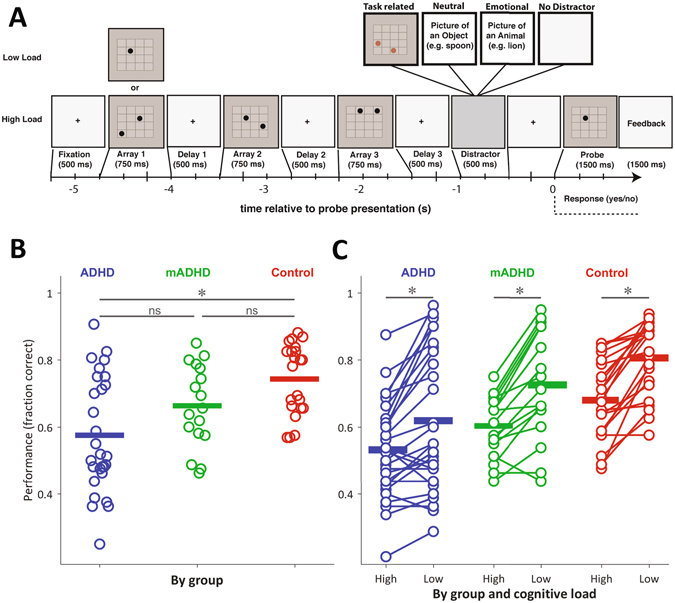
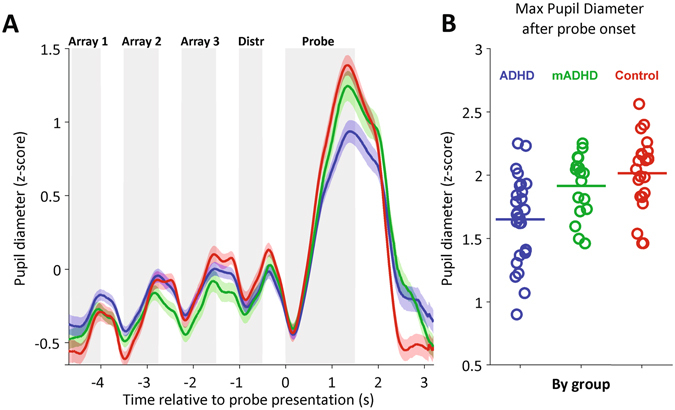
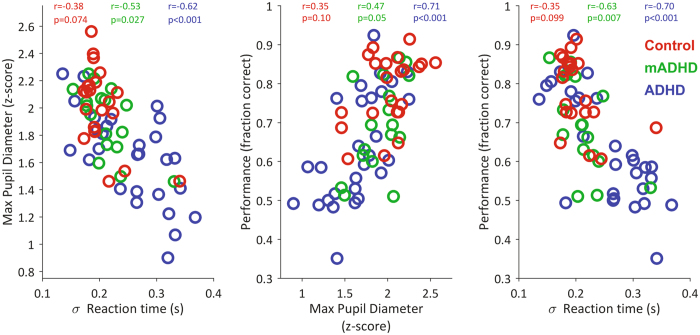
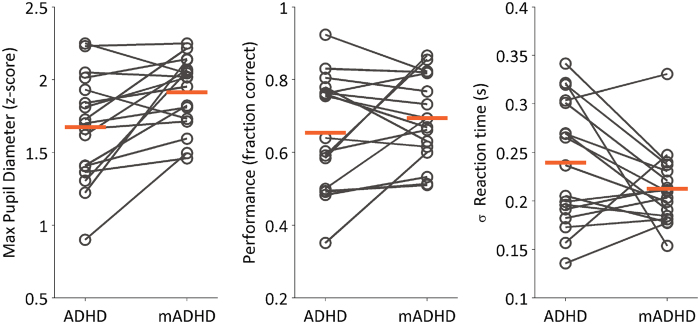
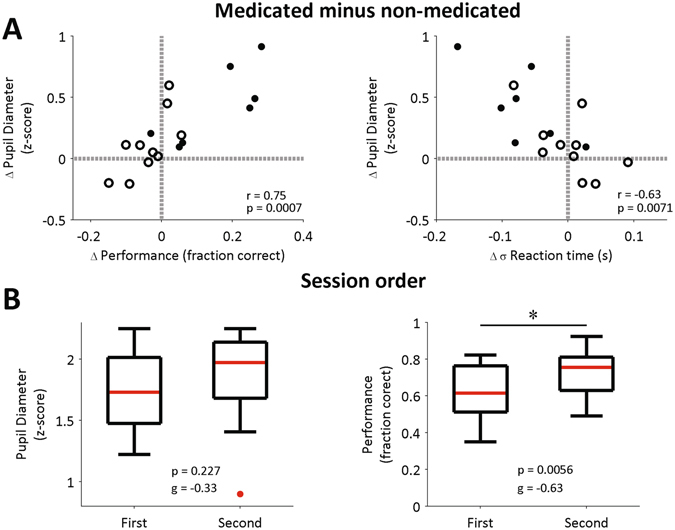
Attention-deficit/hyperactivity disorder (ADHD) diagnosis is based on reported symptoms, which carries the potential risk of over- or under-diagnosis. A biological marker that helps to objectively define the disorder, providing information about its pathophysiology, is needed. A promising marker of cognitive states in humans is pupil size, which reflects the activity of an 'arousal' network, related to the norepinephrine system. We monitored pupil size from ADHD and control subjects, during a visuo-spatial working memory task. A sub group of ADHD children performed the task twice, with and without methylphenidate, a norepinephrine-dopamine reuptake inhibitor. Off-medication patients showed a decreased pupil diameter during the task. This difference was no longer present when patients were on-medication. Pupil size correlated with the subjects' performance and reaction time variability, two vastly studied indicators of attention. Furthermore, this effect was modulated by medication. Through pupil size, we provide evidence of an involvement of the noradrenergic system during an attentional task. Our results suggest that pupil size could serve as a biomarker in ADHD.


Conflict of interest statement

The authors declare that they have no competing interests.

Figures

Figure 1
Figure 1
(A) Schematic representation of a single trial. Following the presentation of the probe, subjects indicated with a button press whether the position of the dot had been presented in one of the previous arrays. (B) Task performance by group. Each dot corresponds to the mean session performance of a subject. Horizontal bars correspond to the group mean. The on-medication ADHD group (mADHD) is a subset of the ADHD group, tested on a different day. (C) Performance by group and cognitive load. Each dot corresponds to the mean session performance of a subject, in high and low cognitive load conditions. In both (B) and (C), performance is expressed as the fraction of correct trials of the session. Differences at p < 0.05 are highlighted.
Figure 2
Figure 2
Mean pupil change during a trial and maximum pupil diameter after probe onset. (A) Mean pupil change during a trial, parsed by group. Each trace corresponds to the mean of each group (ADHD, n = 28; mADHD, n = 17; Control, n = 22). Color shaded areas correspond to the standard error of the mean. Grey shaded areas mark the periods of stimuli presentation during the trial. Dot Arrays 1–3: dot array presentations (See Fig. 1A); Distr: distractor image presentation; Probe: probe dot presentation. (B) Maximum pupil diameter measured after probe onset. Each dot represents the mean session value for a subject (i.e., average across trials). Horizontal bars correspond to session averages across subjects.
Figure 3
Figure 3
Relationships between task performance, reaction time variability and maximum pupil diameter after probe presentation. Each dot corresponds to the mean session value per subject. The values of the Spearman correlation coefficient (r: rho), separately by group, are shown at the top of each plot. Reaction time variability is presented as the standard deviation of the reaction time, which in turn corresponds to the time elapsed between probe presentation and subject’s response.
Figure 4
Figure 4
Paired changes between off-medicated (ADHD) and on-medicated (mADHD) conditions, for the subset of subjects which performed the task in both conditions (n = 17). Left: Change in maximum pupil diameter measured after probe dot presentation. Center: Change in performance, expressed as the fraction of correct trials of the session. Right: Standard deviation of the subject’s reaction time (time elapsed between probe presentation and subject’s response). In all plots, each dot represents the session mean for a subject. Orange horizontal bars correspond to the group mean.
Figure 5
Figure 5
Medication-associated changes and session-order comparisons for ADHD subjects. (A) Association between change (delta, Δ) in pupil diameter after probe presentation, and changes in performance (left) and standard deviation of reaction time (right). The change is calculated as the mean difference between on-medicated and off-medicated conditions. Each dot represents the difference in session means for a subject. Grey reference lines are drawn at zero changes. Empty circles: subjects whose first session was on-medication; Filled circles: subjects whose first session was off-medication. r: Spearman’s rank correlation coefficient. p: p-value for testing the hypothesis of no correlation. (B) Pupil diameter (left) and performance (right) separately by session. Data were parsed by session, regardless of the medication condition (on- or off-). Each boxplot was built using the mean values from each of the 17 subjects. p: p-values from Wilcoxon signed-rank test. g: Hedges’ g (measure of effect size).

References

    1. Aboitiz, F. & Castellanos, F. X. In Attention Deficit Hyperactivity Disorder (ed S. Evans and B. Hoza) (Kingston, NJ:Civic Research Institute, 2011).
    1. Kiely B, Adesman A. What we do not know about ADHD… yet. Current opinion in pediatrics. 2015;27:395–404. doi: 10.1097/mop.0000000000000229. - DOI - PubMed
    1. Bonvicini C, Faraone SV, Scassellati C. Attention-deficit hyperactivity disorder in adults: A systematic review and meta-analysis of genetic, pharmacogenetic and biochemical studies. Molecular psychiatry. 2016;21:872–884. doi: 10.1038/mp.2016.74. - DOI - PMC - PubMed
    1. Clark CR, Geffen GM, Geffen LB. Catecholamines and attention. I: Animal and clinical studies. Neurosci Biobehav Rev. 1987;11:341–352. doi: 10.1016/S0149-7634(87)80006-4. - DOI - PubMed
    1. Swanson JM, et al. Etiologic subtypes of attention-deficit/hyperactivity disorder: brain imaging, molecular genetic and environmental factors and the dopamine hypothesis. Neuropsychology review. 2007;17:39–59. doi: 10.1007/s11065-007-9019-9. - DOI - PubMed

Publication types