. 2017 Aug 15;7(1):8168.
doi: 10.1038/s41598-017-08632-4.

A Tissue Engineered Blood Vessel Model of Hutchinson-Gilford Progeria Syndrome Using Human iPSC-derived Smooth Muscle Cells

Affiliations

A Tissue Engineered Blood Vessel Model of Hutchinson-Gilford Progeria Syndrome Using Human iPSC-derived Smooth Muscle Cells

Leigh Atchison et al. Sci Rep. .

Abstract

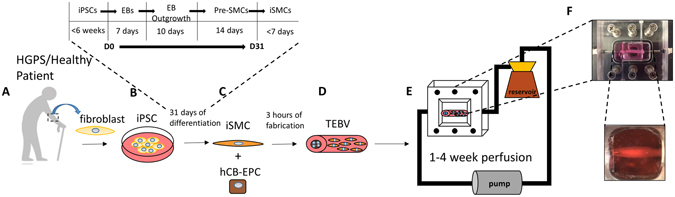
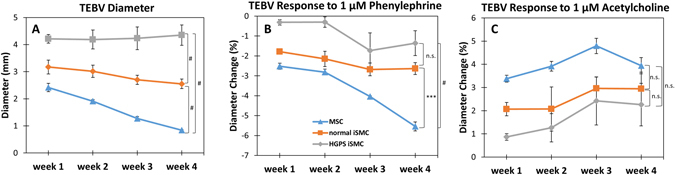
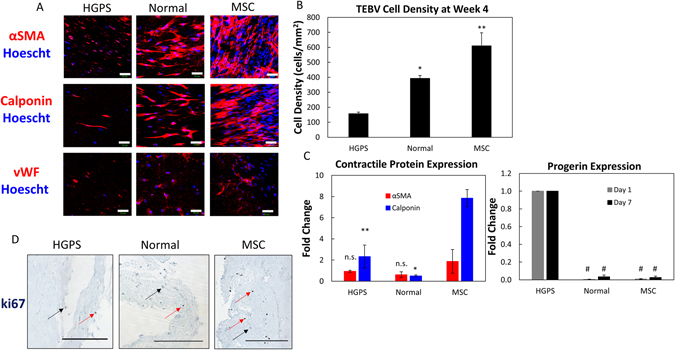
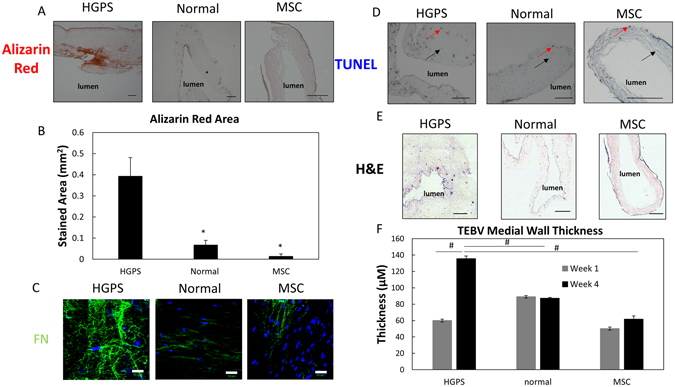
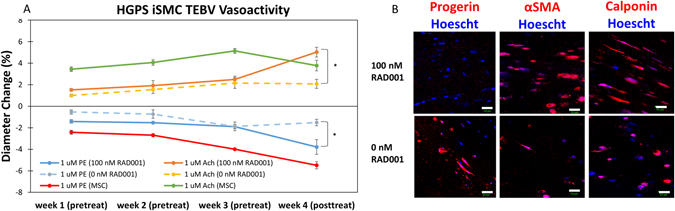
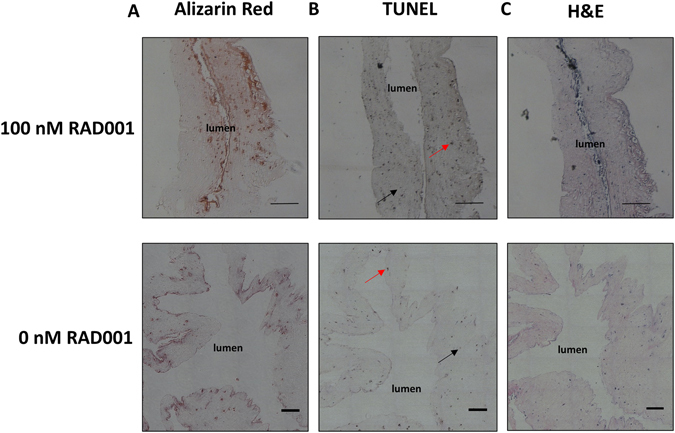
Hutchison-Gilford Progeria Syndrome (HGPS) is a rare, accelerated aging disorder caused by nuclear accumulation of progerin, an altered form of the Lamin A gene. The primary cause of death is cardiovascular disease at about 14 years. Loss and dysfunction of smooth muscle cells (SMCs) in the vasculature may cause defects associated with HGPS. Due to limitations of 2D cell culture and mouse models, there is a need to develop improved models to discover novel therapeutics. To address this need, we produced a functional three-dimensional model of HGPS that replicates an arteriole-scale tissue engineered blood vessel (TEBV) using induced pluripotent stem cell (iPSC)-derived SMCs from an HGPS patient. To isolate the effect of the HGPS iSMCs, the endothelial layer consisted of human cord blood-derived endothelial progenitor cells (hCB-EPCs) from a separate, healthy donor. TEBVs fabricated from HGPS iSMCs and hCB-EPCs show reduced vasoactivity, increased medial wall thickness, increased calcification and apoptosis relative to TEBVs fabricated from normal iSMCs or primary MSCs. Additionally, treatment of HGPS TEBVs with the proposed therapeutic Everolimus, increases HGPS TEBV vasoactivity and increases iSMC differentiation in the TEBVs. These results show the ability of this iPSC-derived TEBV to reproduce key features of HGPS and respond to drugs.


Conflict of interest statement

The authors declare that they have no competing interests.

Figures

Figure 1
Figure 1
Schematic diagram of the procedure to produce iPSC-derived SMC TEBVs from healthy and HGPS patients. (A) A fibroblast biopsy from either healthy (young or old) or HGPS individuals (B) is converted to induced pluripotent stem cell (iPSC) cultures. (C) iPSCs are then differentiated into induced smooth muscle cells (iSMCs) using a 31-day process as previously described by Xie et al.. (D) iSMCs are then incorporated into a dense collagen gel construct that is seeded with human cord blood-derived endothelial cells from a separate, healthy donor on the luminal surface to create iSMC TEBVs using the process previously described by Fernandez et al.. (E) iSMC TEBVs are then incorporated into a flow loop and perfused with steady laminar flow at a shear stress of 6.8 dynes/cm2 for 1 to 4 weeks for maturation and functional characterization studies. (F) Photographic images of HGPS iSMC TEBVs in the custom perfusion chambers under perfusion conditions.
Figure 2
Figure 2
Functional characterization of MSC or iPSC-derived SMC TEBVs from healthy and Progeria patients. (A) Weekly outer diameter measurements of TEBVs fabricated with either MSCs, normal iSMCs, or HGPS iSMCs and seeded with hCB-ECs. (B) Weekly response to 1 μM phenylephrine of TEBVs fabricated with either MSCs, normal iSMCs, or HGPS iSMCs and seeded with hCB-ECs. (C) Weekly response to 1 μM acetylcholine of TEBVs fabricated with either MSCs, normal iSMCs, or HGPS iSMCs and seeded with hCB-ECs. Data are represented as mean ± S.E.M. n = 3 TEBVs. n.s. = not significant, ***P < 0.001, #P < 0.0001 at week 4.
Figure 3
Figure 3
Structural characterization of TEBVs fabricated from MSC or iPSC-derived SMC TEBVs from healthy and Progeria patients. (A) Representative images of immunofluorescence staining with α-smooth muscle actin, calponin, and vWF antibodies at week 4 of perfusion on TEBVs fabricated from HGPS iSMCs, normal iSMCs, and MSCs and seeded with hCB-ECs in the lumen. (Scale bar, 50 μm). (B) Quantification of cell density from A based on the number of nuclei per field area. (C) qRT-PCR of Progerin, alpha-smooth muscle actin and calponin gene expression on MSC, HGPS iSMC and normal iSMC TEBVs. Progerin expression was set at 100% for HGPS iSMC TEBV samples at day 1 and day 7. Alpha-smooth muscle actin and calponin gene expression in TEBVs at day 7 of perfusion culture were normalized to TEBVs on day 1 of perfusion culture. Data normalized to GAPDH expression. (D) Histochemical analysis of HGPS iSMC, normal iSMC, and MSC TEBVs at week 1 with ki67. Red arrows indicate ki67 positive cells and black arrows indicate ki67 negative cells (Scale bar, 200 μm). n = 3 TEBVs for each TEBV cell type. *P < 0.05, **P < 0.01, #P < 0.001, n.s. =not significant.
Figure 4
Figure 4
Progeria disease characterization of TEBVs fabricated from MSC or iPSC-derived SMC TEBVs from healthy and Progeria patients. (A) Histochemical analysis of HGPS iSMC, normal iSMC, and MSC TEBVs at week 4 with Alizarin Red staining (Scale bar, 200 μm). (B) Quantification of A, total area positive for Alizarin Red. (C) Representative images of immunofluorescence staining with fibronectin antibodies at week 4 of perfusion on TEBVs fabricated from HGPS iSMCs, normal iSMCs, and MSCs and seeded with hCB-ECs in the lumen (Scale bar, 50 μm). (D) Histochemical analysis of MSC, normal iSMC and HGPS iSMC TEBVs at week 4 with TUNEL staining. Red arrows indicate TUNEL positive cells and black arrows indicate TUNEL negative cells (Scale bar, 200 μm). (E) Histochemical analysis of HGPS iSMC, normal iSMC, and MSC TEBVs at week 4 with H&E (Scale bar, 200 μm). (F) The average thickness of MSC, normal iSMC and HGPS iSMC TEBVs at week 1 and week 4 based on H&E images in E. n = 3 TEBVs for each TEBV cell type. *P < 0.05, **P < 0.01, #P < 0.0001.
Figure 5
Figure 5
Effect of Everolimus (RAD001) treatment on HGPS iSMC TEBVs structure and function. (A) Functional response to 1 μM phenylephrine and 1 μM acetylcholine of HGPS iSMC TEBVs seeded with hCB-ECs after 3 weeks of normal perfusion and 1 week of treatment with 100 nM everolimus (RAD001) compared to untreated MSC TEBVs (From Fig. 2). (B) Representative images of immunofluorescence staining with Progerin, α-smooth muscle actin, and calponin on HGPS iSMC TEBVs at week 4 untreated or treated with 100 nM everolimus (Scale bar, 50 μm). n = 3 TEBVs. *P < 0.05.
Figure 6
Figure 6
Histochemical analysis of HGPS TEBVs treated with Everolimus vs. untreated controls. (A) Alizarin Red stain, (B) TUNEL stain and (C) H&E stain of HGPS iSMC TEBVs after 3 weeks of normal perfusion and 1 week of treatment with 100 nM RAD001 or HGPS iSMC TEBVs without treatment. Red arrows indicate TUNEL positive cells and black arrows indicate TUNEL negative cells (Scale bar, 200 μm).

References

    1. Gonzalo S, Kreienkamp R, Askjaer P. Hutchinson-Gilford Progeria Syndrome: a premature aging disease caused by LMNA gene mutations. Ageing Res. Rev. 2017;33:18–29. doi: 10.1016/j.arr.2016.06.007. - DOI - PMC - PubMed
    1. Booth-Gauthier Ea, et al. Hutchinson-Gilford progeria syndrome alters nuclear shape and reduces cell motility in three dimensional model substrates. Integr. Biol. 2013;5:569–77. doi: 10.1039/c3ib20231c. - DOI - PubMed
    1. Gonzalo S, Kreienkamp R. DNA repair defects and genome instability in Hutchinson-Gilford Progeria Syndrome. Curr. Opin. Cell Biol. 2015;34:75–83. doi: 10.1016/j.ceb.2015.05.007. - DOI - PMC - PubMed
    1. McClintock D, Gordon LB, Djabali K. Hutchinson–Gilford progeria mutant lamin A primarily targets human vascular cells as detected by an anti-Lamin A G608G antibody. Proc. Natl. Acad. Sci. USA. 2006;103:2154–2159. doi: 10.1073/pnas.0511133103. - DOI - PMC - PubMed
    1. Choi K-M, et al. Effect of ascorbic acid on bone marrow-derived mesenchymal stem cell proliferation and differentiation. J. Biosci. Bioeng. 2008;105:586–594. doi: 10.1263/jbb.105.586. - DOI - PubMed

Publication types

MeSH terms

LinkOut - more resources