. 2017 Aug 11:9:82.
doi: 10.1186/s13148-017-0382-y. eCollection 2017.

LSD1 dual function in mediating epigenetic corruption of the vitamin D signaling in prostate cancer

Affiliations

LSD1 dual function in mediating epigenetic corruption of the vitamin D signaling in prostate cancer

Sebastiano Battaglia et al. Clin Epigenetics. .

Abstract

Background: Lysine-specific demethylase 1A (LSD1) is a key regulator of the androgen (AR) and estrogen receptors (ER), and LSD1 levels correlate with tumor aggressiveness. Here, we demonstrate that LSD1 regulates vitamin D receptor (VDR) activity and is a mediator of 1,25(OH)2-D3 (vitamin D) action in prostate cancer (PCa).

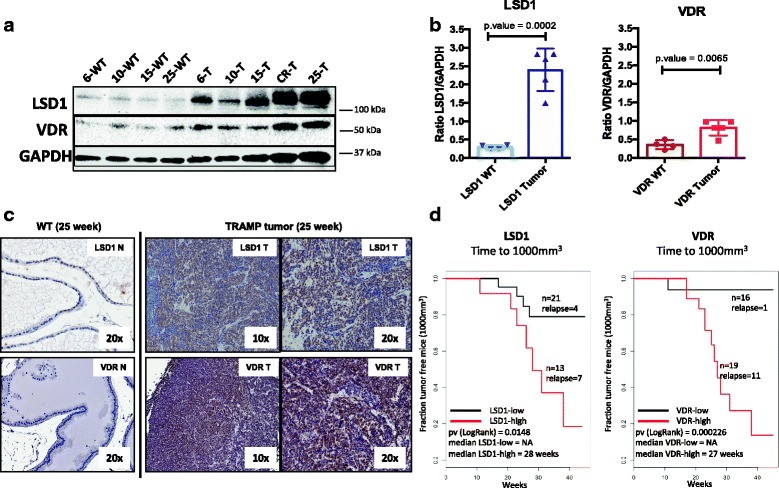
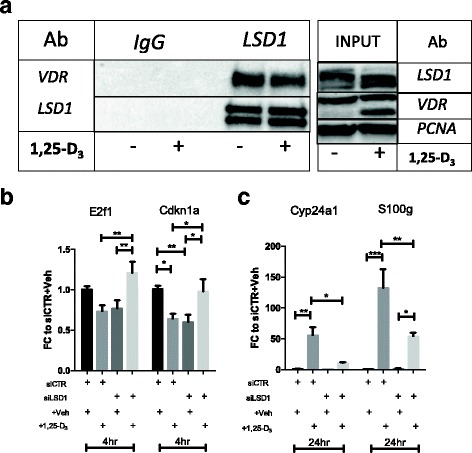
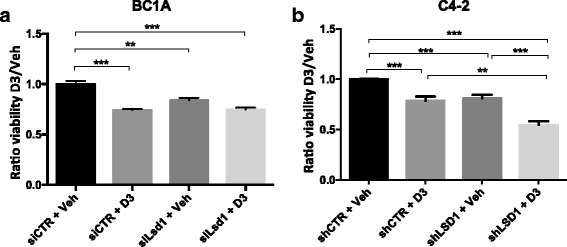
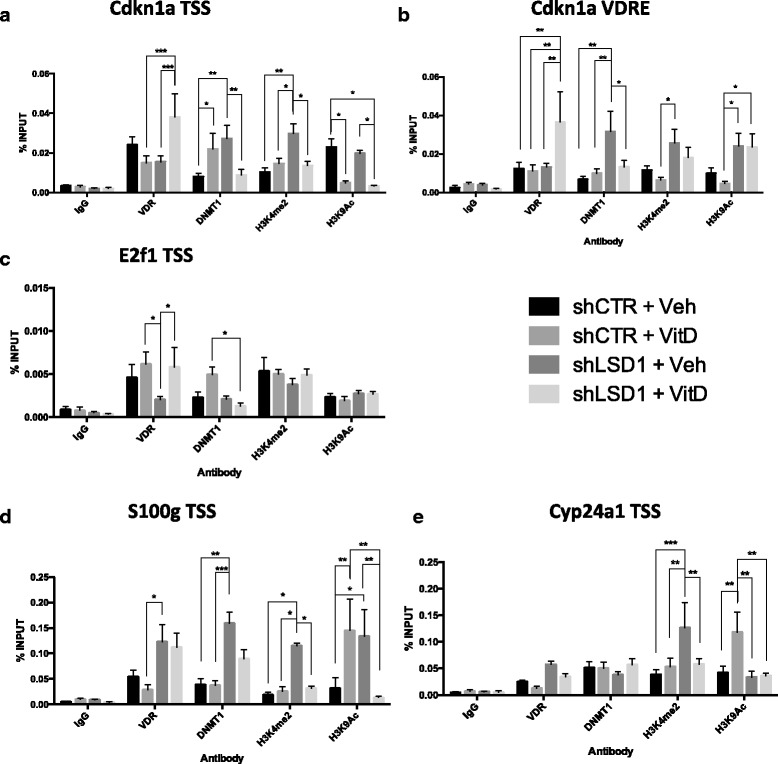
Methods: Athymic nude mice were xenografted with CWR22 cells and monitored weekly after testosterone pellet removal. Expression of LSD1 and VDR (IHC) were correlated with tumor growth using log-rank test. TRAMP tumors and prostates from wild-type (WT) mice were used to evaluate VDR and LSD1 expression via IHC and western blotting. The presence of VDR and LSD1 in the same transcriptional complex was evaluated via immunoprecipitation (IP) using nuclear cell lysate. The effect of LSD1 and 1,25(OH)2-D3 on cell viability was evaluated in C4-2 and BC1A cells via trypan blue exclusion. The role of LSD1 in VDR-mediated gene transcription was evaluated for Cdkn1a, E2f1, Cyp24a1, and S100g via qRT-PCR-TaqMan and via chromatin immunoprecipitation assay. Methylation of Cdkn1a TSS was measured via bisulfite sequencing, and methylation of a panel of cancer-related genes was quantified using methyl arrays. The Cancer Genome Atlas data were retrieved to identify genes whose status correlates with LSD1 and DNA methyltransferase 1 (DNMT1). Results were correlated with patients' survival data from two separate cohorts of primary and metastatic PCa.

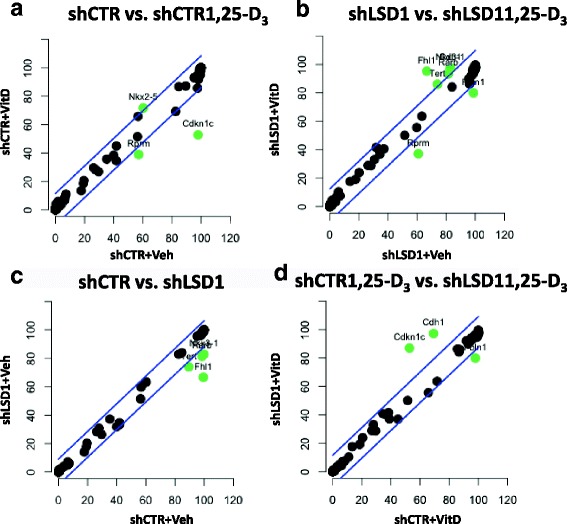
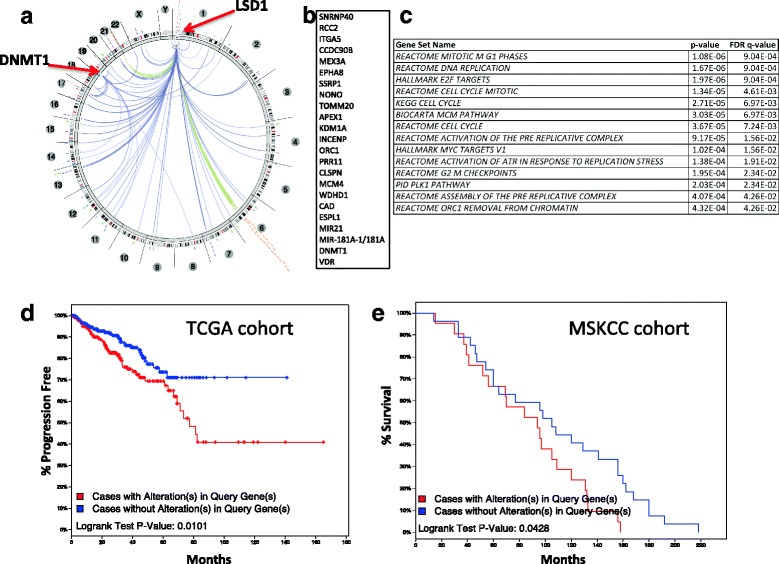
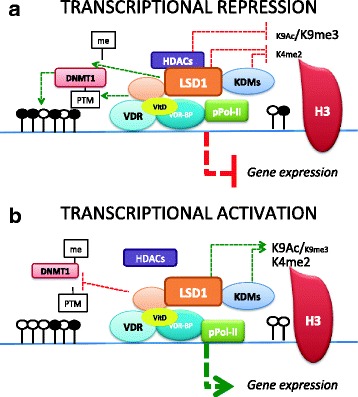
Results: LSD1 and VDR protein levels are elevated in PCa tumors and correlate with faster tumor growth in xenograft mouse models. Knockdown of LSD1 reduces PCa cell viability, and gene expression data suggest a dual coregulatory role of LSD1 for VDR, acting as a coactivator and corepressor in a locus-specific manner. LSD1 modulates VDR-dependent transcription by mediating the recruitment of VDR and DNMT1 at the TSS of VDR-targeted genes and modulates the epigenetic status of transcribed genes by altering H3K4me2 and H3K9Ac and DNA methylation. Lastly, LSD1 and DNMT1 belong to a genome-wide signature whose expression correlates with shorter progression-free survival and overall survival in primary and metastatic patients' samples, respectively.

Conclusions: Results demonstrate that LSD1 has a dual coregulatory role as corepressor and coactivator for VDR and defines a genomic signature whose targeting might have clinical relevance for PCa patients.


Conflict of interest statement

Ethics approval and consent to participate

Not applicable.

Consent for publication

Not applicable.

Competing interests

The authors declare that they have no competing interests.

Publisher’s Note

Springer Nature remains neutral with regard to jurisdictional claims in published maps and institutional affiliations.

Figures

Fig. 1
Fig. 1
LSD1 expression in prostate tissues is increased in advanced prostate tumors. Western blot and immunohistochemistry (IHC) staining were used to measure protein levels of LSD1 and VDR in wild-type (WT) and TRAMP mice. CWR22 xenograft mice were used to investigate the role of LSD1 and VDR in PCa growth kinetics. a Western blotting image showing the expression of LSD1 and VDR protein levels in wild-type and TRAMP prostate lysates. WT wild-type mouse, T tumor/TRAMP mouse, CR castration-recurrent tumor from TRAMP mouse. b LSD1 (left) and VDR (right) protein quantification of LSD1, or VDR, normalized to GAPDH. Data from wild-type samples were compared with the data from tumor samples using Student’s t test. p values are indicated in the plot. c LSD1 and VDR IHC staining in age-matched prostate samples of 25-week-old TRAMP and WT mice. Staining shows a strong nuclear localization, in brown, in both WT and TRAMP tumors, with a stronger signal in tumor. Labels in the image indicate protein (LSD1, VDR), magnification (× 10, × 20), and tissue type (WT, tumor (T)). d Kaplan-Meier plots showing time to recurrence for CWR22 xenografts, measured as time necessary for the tumor to reach 1000 mm3 in volume. The X-axis indicates weeks of the experiment where time 0 is the time of testosterone pellet removal. The Y-axis indicates the percentage of mice with tumor that did not reach 1000 mm3. The black lines indicate mice with low LSD1/VDR levels, and the red lines indicate mice with high LSD1/VDR levels measured via IHC. Log-rank p value and median time to recurrence are indicated in the figure
Fig. 2
Fig. 2
a Immunoprecipitation (IP) and western blotting (WB) data showing that LSD1 and VDR belong to the same transcriptional complex. IP was performed from nuclear lysate in samples treated with vehicle control or 1,25-D3 using the same LSD1 antibody described for IHC and WB. In post-IP, the samples were probed for LSD1 and VDR. The same double band visible in Fig. 1 was also detected in this sample. b, c Effect of LSD1 knockdown and 1,25-D3 treatment on gene expression of VDR target genes. Every graph compares the effect of vitamin D in control (CTR) cells and LSD1 knockdown (siLSD1) cells. Each bar is the mean of at least three biological replicates with SEM, showing the fold changes of treated (+ D3) vs. vehicle-treated (− Veh) samples. The columns indicate, from left to right, siCTR + Veh, siCTR + 1,25-D3, siLSD1 + Veh, and siLSD1 + 1,25-D3. Transcript levels were measured for b E2f1 and Cdkn1a and c Cyp24a1 and S100g. Statistical significance was evaluated with one-way ANOVA and Tukey post hoc correction (***p < 0.001, **p < 0.01, *p < 0.05)
Fig. 3
Fig. 3
Viability of a BC1A and b C4-2 cells as measured via cell count upon LSD1 knockdown and 1,25-D3 treatment. Each bar represents the mean of at least three biological replicates, and the Y-axis indicates the percentage of viable cells compared to the control. From left to right, in both graphs, the columns indicate shCTR + Veh, shCTR + 100 nM 1,25-D3, shLSD1 + Veh, and shLSD1 + 100 nM 1,25-D3. Statistical significance was evaluated with one-way ANOVA and Tukey post hoc correction (***p < 0.001, **p < 0.01, *p < 0.05)
Fig. 4
Fig. 4
ChIP analysis of BC1A cells stably transfected with shLSD1 lentiviral vector and treated for 24 h with 100 nM 1,25-D3. Each bar indicates the percentage of binding relative to INPUT and represents the mean of at least three biological replicates with SEM. The columns indicate, from left to right, shCTR + Veh, shCTR + 1,25-D3, shLSD1 + Veh, and shLSD1 + 1,25-D3. The basal levels of the following protein/histone marks were evaluated, from left to right, in each graph: IgG, VDR, DNMT1, H3K4me2, and H3K9Ac. The regions analyzed were a Cdkn1a TSS, b Cdkn1a VDRE, c E2f1 TSS, d Cyp24a1 TSS, and e S100g TSS. IgG was used as a control for non-specific binding/enrichment. Statistical significance was calculated using one-way ANOVA and Tukey post hoc correction (***p < 0.001, **p < 0.01, *p < 0.05)
Fig. 5
Fig. 5
Visual representation of the methylation changes observed using the Qiagen methylation arrays. A linear model was built to identify differentially methylated regions and the 95% confidence intervals calculated and plotted (blue lines); green dots show the genes whose methylation significantly differs between the selected conditions. Each quadrant reflects the results listed in Additional file 1: Table S1. a Contribution of vitamin D at basal conditions. b Contribution of LSD1 at basal conditions. c Contribution of vitamin D in knockdown conditions (shLSD1). d Contribution of LSD1 in the presence of vitamin D
Fig. 6
Fig. 6
Graphical overview of the alterations in the LSD1/DNMT1/VDR signature. The Regulome Explorer was used to identify genes correlating with LSD1/DNMT1 status, followed by functional enrichment analysis and survival analysis on two independent TCGA datasets. a Circos plot showing the genes correlating with LSD1 and DNMT1 status. b List of the genes in the LSD1/DNMT1/VDR signature. c Functional enrichment analysis of the genes in the LSD1/DNMT1/VDR signature indicating pathway name and origin, p value, and FDR-corrected q value. d, e Kaplan-Meier plot indicating progression-free survival in patients with primary tumor (d) or overall survival in patients with recurrent metastatic tumor (e). The red lines indicate patients with altered LSD1/DNMT1/VDR signature (z score > ± 2), and the blue lines indicate patients whose signature is not altered (z score between − 2 and + 2). Statistical significance was calculated via log-rank test with a threshold of p < 0.05
Fig. 7
Fig. 7
Graphical representation of the model for VDR/LSD1/DNMT1 activity in a loci where LSD1 acts as coactivators vs. b loci where LSD1 acts as a corepressor. me methyl residue, PTM post-translational modification, VDR-BP VDR binding partner (i.e., RXR), KDMs non-LSD1 lysine demethylases, H3 histone 3, K9Ac acetylated lysine position 9, K9me3 trimethylated lysine position 9, K4me2 dimethylated lysine position 4, pPol-II phosphorylated RNA polymerase II

References

    1. Siegel R, Ma J, Zou Z, Jemal A. Cancer statistics, 2014. CA Cancer J Clin. 2014;64(1):9–29. doi: 10.3322/caac.21208. - DOI - PubMed
    1. Jones G, Strugnell SA, DeLuca HF. Current understanding of the molecular actions of vitamin D. Physiol Rev. 1998;78(4):1193–1231. - PubMed
    1. Darwish HM, DeLuca HF. Identification of a 1,25-dihydroxyvitamin D3-response element in the 5′-flanking region of the rat calbindin D-9k gene. Proc Natl Acad Sci U S A. 1992;89(2):603–607. doi: 10.1073/pnas.89.2.603. - DOI - PMC - PubMed
    1. Lam NN, Triliana R, Sawyer RK, Atkins GJ, Morris HA, O'Loughlin PD, et al. Vitamin D receptor overexpression in osteoblasts and osteocytes prevents bone loss during vitamin D-deficiency. J Steroid Biochem Mol Biol. 2014;144(Part A):128–31. - PubMed
    1. van de Peppel J, van Leeuwen JP. Vitamin D and gene networks in human osteoblasts. Front Physiol. 2014;5:137. - PMC - PubMed

Publication types

MeSH terms