

Genome size in arthropods; different roles of phylogeny, habitat and life history in insects and crustaceans
- PMID: 28811889
- PMCID: PMC5552920
- DOI: 10.1002/ece3.3163
Genome size in arthropods; different roles of phylogeny, habitat and life history in insects and crustaceans
Abstract
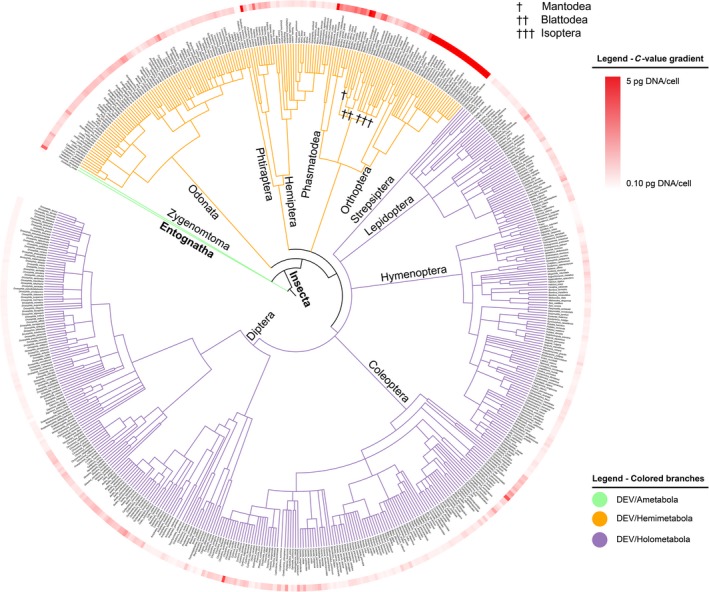
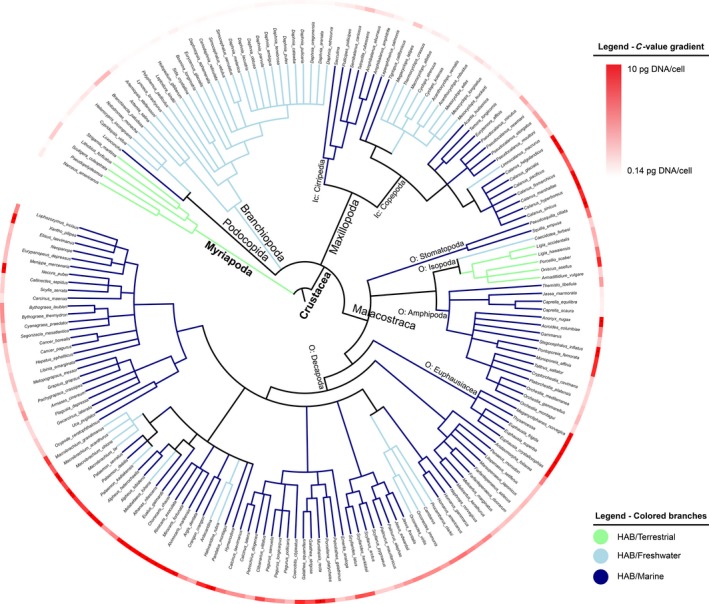
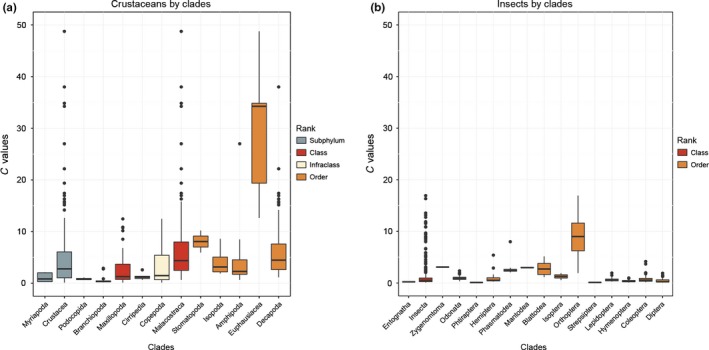
Despite the major role of genome size for physiology, ecology, and evolution, there is still mixed evidence with regard to proximate and ultimate drivers. The main causes of large genome size are proliferation of noncoding elements and/or duplication events. The relative role and interplay between these proximate causes and the evolutionary patterns shaped by phylogeny, life history traits or environment are largely unknown for the arthropods. Genome size shows a tremendous variability in this group, and it has a major impact on a range of fitness-related parameters such as growth, metabolism, life history traits, and for many species also body size. In this study, we compared genome size in two major arthropod groups, insects and crustaceans, and related this to phylogenetic patterns and parameters affecting ambient temperature (latitude, depth, or altitude), insect developmental mode, as well as crustacean body size and habitat, for species where data were available. For the insects, the genome size is clearly phylogeny-dependent, reflecting primarily their life history and mode of development, while for crustaceans there was a weaker association between genome size and phylogeny, suggesting life cycle strategies and habitat as more important determinants. Maximum observed latitude and depth, and their combined effect, showed positive, and possibly phylogenetic independent, correlations with genome size for crustaceans. This study illustrate the striking difference in genome sizes both between and within these two major groups of arthropods, and that while living in the cold with low developmental rates may promote large genomes in marine crustaceans, there is a multitude of proximate and ultimate drivers of genome size.
Keywords: C‐value; crustaceans; ecology; evolution; insects; life history; temperature‐size‐rules.
Figures
References
-
- Angilletta, M. J. , Steury, T. D. , & Sears, M. W. (2004). Temperature, growth rate, and body size in ectotherms: Fitting pieces of a life‐history puzzle. Integrative and Comparative Biology, 44, 498–509. - PubMed
-
- Atkinson, D. (1994). Temperature and organism size: A biological law for ectotherms? Advances in Ecological Research, 25, 1–58.
-
- Blomberg, S. P. , Garland, T. , & Ives, A. R. (2003). Testing for phylogenetic signal in comparative data: Behavioral traits are more labile. Evolution, 57, 717–745. - PubMed
-
- Brookfield, J. F. (2005). The ecology of the genome—mobile DNA elements and their hosts. Nature Reviews Genetics, 6, 128–136. - PubMed
LinkOut - more resources
Full Text Sources
Other Literature Sources
