. 2017 Sep;19(9):1017-1026.
doi: 10.1038/ncb3575. Epub 2017 Aug 14.

Lactate dehydrogenase activity drives hair follicle stem cell activation

Affiliations

Lactate dehydrogenase activity drives hair follicle stem cell activation

Aimee Flores et al. Nat Cell Biol. 2017 Sep.

Abstract

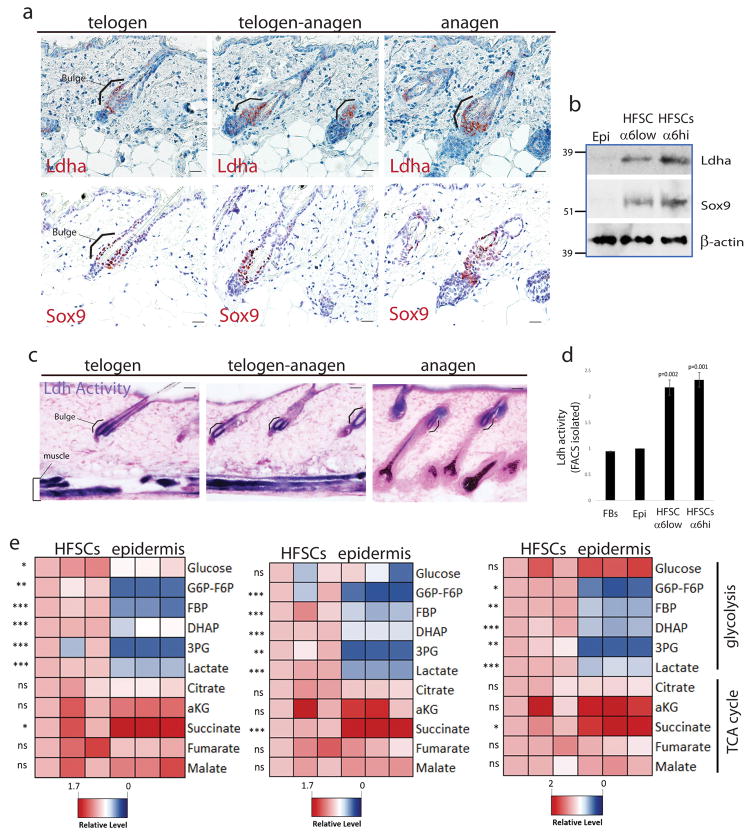
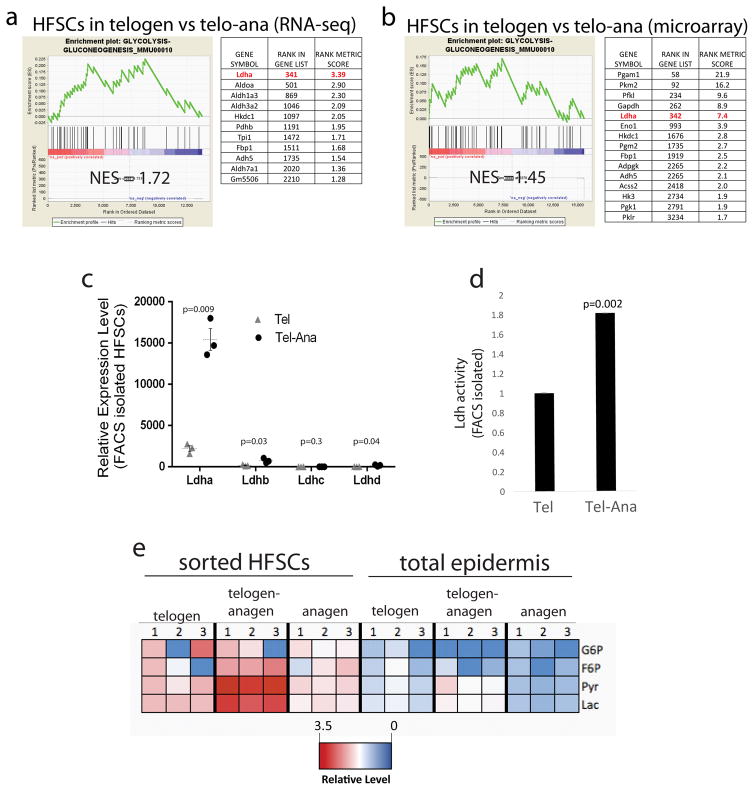
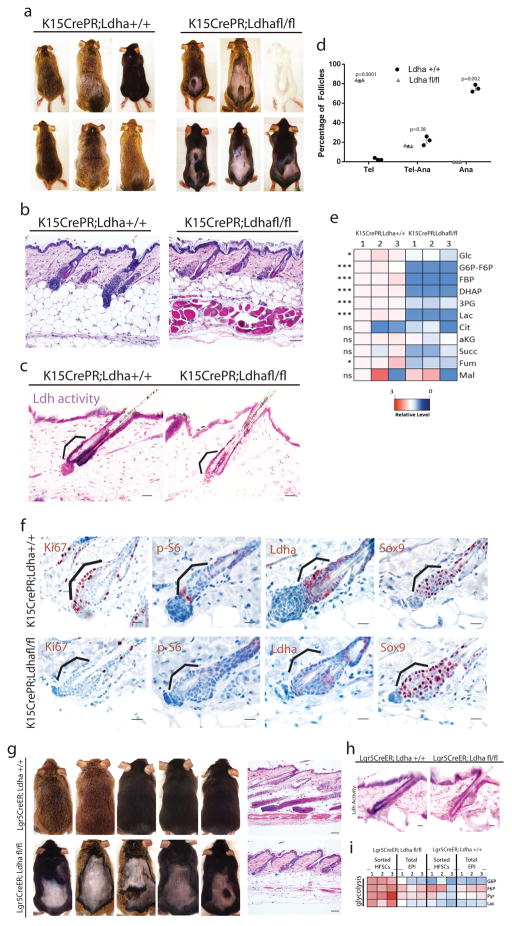
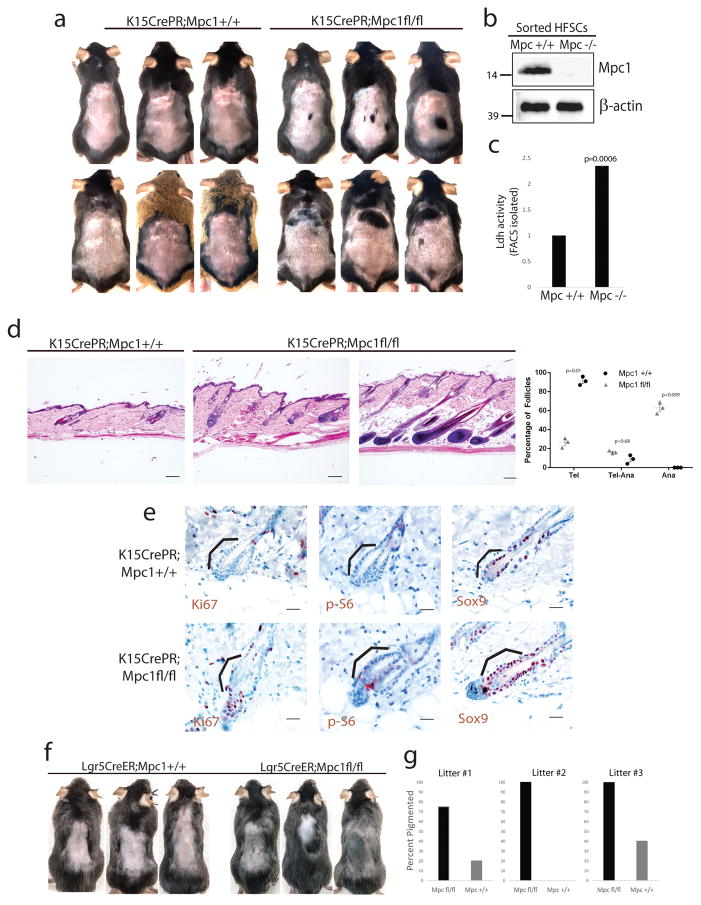
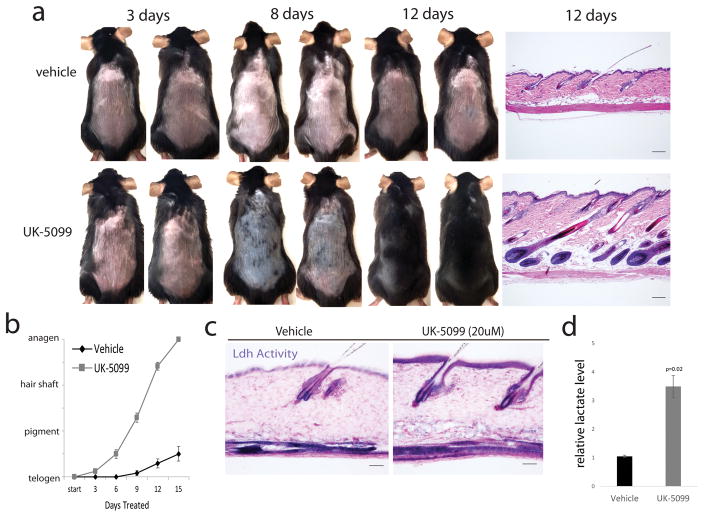
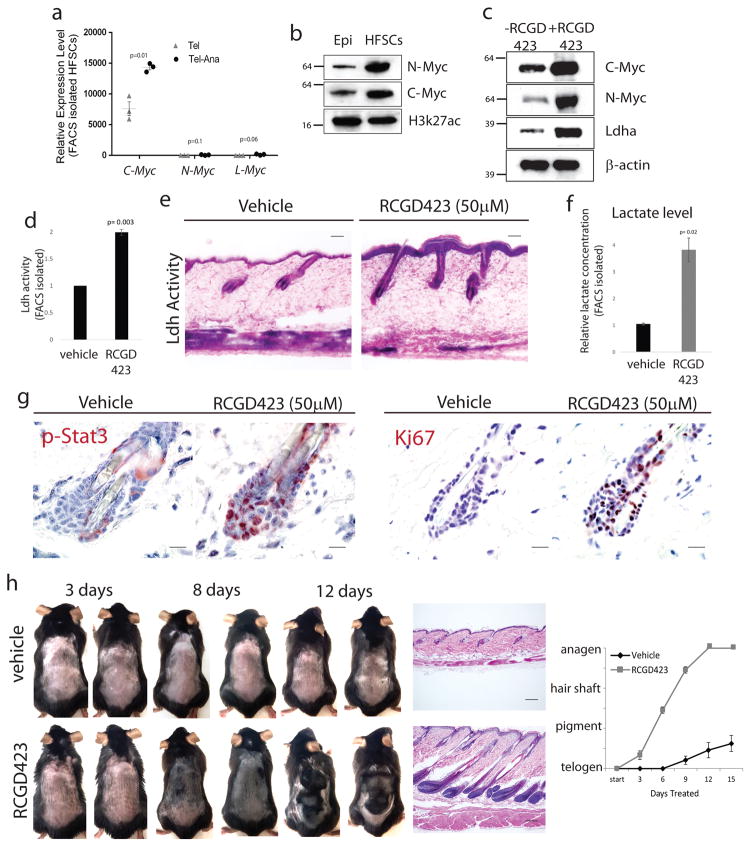
Although normally dormant, hair follicle stem cells (HFSCs) quickly become activated to divide during a new hair cycle. The quiescence of HFSCs is known to be regulated by a number of intrinsic and extrinsic mechanisms. Here we provide several lines of evidence to demonstrate that HFSCs utilize glycolytic metabolism and produce significantly more lactate than other cells in the epidermis. Furthermore, lactate generation appears to be critical for the activation of HFSCs as deletion of lactate dehydrogenase (Ldha) prevented their activation. Conversely, genetically promoting lactate production in HFSCs through mitochondrial pyruvate carrier 1 (Mpc1) deletion accelerated their activation and the hair cycle. Finally, we identify small molecules that increase lactate production by stimulating Myc levels or inhibiting Mpc1 carrier activity and can topically induce the hair cycle. These data suggest that HFSCs maintain a metabolic state that allows them to remain dormant and yet quickly respond to appropriate proliferative stimuli.


Conflict of interest statement

Potential Competing Interest Statement The use of RCGD423 to promote hair growth is covered by a provisional patent application filed by UC Regents and this technology has been licensed by Carthronix LLC. William Lowry is a member of the board of advisors and a shareholder of Carthronix LLC. None of the work in this study was supported by Carthronix. The use of UK5099 to promote hair growth is covered by a separate provisional patent filed by UC Regents with Drs. Lowry and Christofk as inventors.

Figures

Figure 1
Figure 1. Lactate dehydrogenase activity is enriched in HFSCs
a, IHC staining for Ldha expression across the hair cycle shows Ldha protein confined to the HFSC niche, the bulge, indicated by the bracket. IHC staining for Sox9 on serial sections demarcates the HFSC population. Scale bar indicates 20 micrometers. b, Immunoblotting on FACS-isolated HFSC populations (α6low/Cd34+ and α6hiCd34+) versus total epidermis (Epi) shows differential expression of Ldha in the stem cell niche. Sox9 is a marker of HFSCs, and β-actin is a loading control. c, Colorimetric assay for Ldh enzyme activity in the epidermis shows highest activity in the bulge (brackets) and subcuticular muscle layer (bracket). This activity is enriched in the bulge across different stages of the hair cycle. Activity is indicated by purple color; pink is a nuclear counterstain. Note also that developing hair shafts in pigmented mice show strong deposits of melanin as observed here; hair shafts never displayed any purple stain indicative of Ldh activity. Scale bars indicate 50 micrometers. d, Ldh activity in sorted cell populations, measured using a plate reader-based assay, also shows the highest Ldh activity in two separate HFSC populations (α6hi/Cd34 and α6low/Cd34) compared to epidermal cells (Epi) and fibroblasts (FBs). Each bar represents the average signal for each cell type where n=9 mice pooled from 3 independent experiments. Shown as mean ± SEM. Paired t-test was performed, p < 0.05 shown for each cell type versus epidermal cells e, HFSCs and epidermal cells were isolated during telogen (day 50) by FACS, and metabolites were extracted and analyzed by LC-MS. Heatmaps show relative levels of glycolytic and TCA cycle metabolites from cells isolated from different mice in independent experiments with cells from three animals in each. Asterisks indicate significant difference in metabolite levels between epidermal cells and HFSCs. For e, paired t-test was performed; * denotes p < 0.05, ** denotes p <0.01, *** denotes p < 0.001, ns denotes p > 0.05, and n=9 mice pooled from 3 independent experiments. Unprocessed scans of blots are shown in Supplementary Figure 6.
Figure 2
Figure 2. Ldh activity increases during HFSC activation
a, GSEA on RNA-seq transcriptome data from HFSCs versus total epidermis shows enrichment for Glycolysis related genes in HFSCs (NES = 1.72). b, GSEA on microarray transcriptome data from HFSCs versus total epidermis shows enrichment for Glycolysis related genes in HFSCs (NES = 1.45). Results were generated from three mice of each condition. c, RNA-seq data from HFSCs sorted during telogen or telogen-anagen transition show induction of Ldha. Data represent the average of three separate animals at each timepoint (n = 3), and subjected to students t-test for significance (p < 0.05). d, Ldh activity in sorted stem cell populations, measured using a plate reader-based assay, shows elevated Ldh activity as stem cells become activated in telogen to anagen transition (Tel-Ana). Each bar represents the average signal for each condition where n=9 mice pooled from 3 independent experiments. Shown as mean ± SEM. Paired t-test was performed, p < 0.05. e, Heatmap showing relative levels of glycolytic and TCA cycle metabolites extracted from quiescent (Telogen, day 50), activated (Telogen-Anagen, day 70) and HFSCs that have returned to the quiescent state (Anagen, day 90). Data shown were generated from n=3 animals per timepoint in 3 independent experiments.
Figure 3
Figure 3. Deletion of Ldha blocks HFSC activation
a, Ldha+/+ animals enter the hair cycle synchronously around day 70 as measured by shaving and observation beginning at day 50. K15CrePR;Ldhafl/fl animals treated with Mifepristone show defects in anagen entry. Results are representative of at least 33 animals of each genotype. b, Skin pathology showing that K15CrePR;Ldhafl/fl animals showed neither and remained in telogen. Scale bars indicate 50 micrometers. c, Ldh enzyme activity assay showed that K15CrePR;Ldha fl/fl animals lacked this activity in the HFSCs (indicated by bracket). Scale bars indicate 20 micrometers. d, Graph showing percentage of follicles in telogen, telogen to anagen transition and anagen in K15CrePR;Ldha+/+ mice versus K15CrePR;Ldhafl/fl mice (n = 225 follicles from 3 mice per genotype). Shown as mean ± SEM. Paired t-test was performed, p < 0.05, e, Heatmap showing relative levels of glycolytic and TCA cycle metabolites extracted from Ldha+/+ HFSCs and Ldhafl/fl HFSCs and measured by LC-MS. Asterisks indicate significant difference in metabolite levels between genotypes. For e, paired t-test was performed,* denotes p < 0.05, ** denotes p <0.01, *** denotes p < 0.001, ns denotes p > 0.05, and n=9 mice pooled from 3 independent experiments. f, Immunohistochemistry staining for Ki-67, a marker of proliferation is absent in Ldhafl/fl HFSCs. Phospo-S6, a marker in HFSCs at the beginning of a new hair cycle, is absent in Ldhafl/fl HFSCs. Staining for Ldha protein shows specific deletion in HFSCs. Brackets indicate bulge. Staining for Sox9 shows that HFSCs are still present in Ldha deleted niche. Scale bars: 20 micrometers. g, Animals with Ldha deletion in their HFSCs as controlled by Lgr5CreER, show profound defects in the entry into anagen. right, Skin pathology showing that Lgr5CreER;Ldhafl/fl animals mostly remained in telogen. Scale bars: 100 micrometers. Results are representative of at least 12 animals of each genotype. h, Ldh enzyme activity assay in the epidermis shows that Lgr5CreER;Ldhafl/fl animals lacked this activity in the HFSCs. Scale bars: 20 micrometers. i, LC-MS analysis of metabolites from indicated mice. Data were generated from n=3 animals per condition pooled from 3 independent experiments.
Figure 4
Figure 4. Deletion of Mpc1 increases lactate production and activation of HFSCs
a, Mpc1fl/fl animals show pigmentation and hair growth, consistent with entry into the anagen cycle at 8.5 weeks, whereas Mpc1+/+ animals do not show dorsal pigmentation and hair growth this early. Animals shown are representative of at least 12 animals of each genotype. b, FACS isolation of HFSC bulge populations in Mpc1+/+ versus Mpc1fl/fl mice followed by western blotting shows successful deletion of Mpc1 protein in the stem cell niche. β-actin is a loading control. c, Plate reader assay for Ldh activity on sorted HFSC populations shows elevated activity in Mpc1fl/fl HFSCs compared to Mpc1+/+ HFSCs. Each bar represents the average signal for each genotype where n=9 mice pooled from 3 independent experiments. Shown as mean ± SEM. Paired t-test was performed, p < 0.05. d, Histology on WT versus Mpc1 deletion skin shows induction of anagen in absence of Mpc1. Scale bars indicate 100 micrometers. Quantification of phenotype at right shows percentage of dorsal follicles in telogen, telogen to anagen transition and anagen in Mpc1 +/+ mice versus Mpc1fl/fl mice (n = 250 follicles from 3 mice per genotype). Shown as mean ± SEM. Paired t-test was performed, p < 0.05. e, Immunohistochemistry staining for Ki-67, a marker of proliferation that is only active in HFSCs at the beginning of a new hair cycle, is only present in Mpc1fl/fl HFSCs at 8.5 weeks, consistent with their accelerated entry into a new hair cycle. Phospo-S6, another marker that is only active in HFSCs at the beginning of a new hair cycle, is only present in Mpc1fl/fl HFSCs. Staining for Sox9 shows that HFSCs are present in Mpc1 deleted niche. Images taken at 60X magnification. f, Deletion of Mpc1 in mice bearing the Lgr5CreER allele shows strong induction of the hair cycle. Note that red boxes indicate areas of new hair growth. Results are representative of at least 9 animals per genotype. g, Quantification of pigmentation in the indicated genotypes across three independent litters (n = 5 mice per genotype). Unprocessed scans of blots are shown in Supplementary Figure 6.
Figure 5
Figure 5. Pharmacological inhibition of Mpc1 promotes HFSC activation
a, Animals treated topically with UK-5099 (20uM) show pigmentation and hair growth, indicative of entry into anagen, after 8 days of treatment. Full anagen, indicated by full coat of hair, is achieved after 14 days of treatment. Mice treated topically with vehicle control do not show pigmentation nor hair growth even after 12 days of treatment. right, Skin pathology showing that UK-5099 animals enter an accelerated anagen at 8 weeks typified by down growth of the follicle and hypodermal thickening, while vehicle control treated animals showed neither and remained in telogen. Images shown are representative of at least 14 mice from 7 independent experiments. Scale bars indicate 100 micrometers. b, Graph showing time to observed phenotype in vehicle versus UK-5099 treated mice. n = 6 mice per condition. Shown as mean ± SEM. c, Ldh enzyme activity assay in the epidermis shows strong activity in HFSCs in vehicle control and UK-5099 treated animals. Ldh enzyme activity also seen in interfollicular epidermis of UK-5099 treated animals. Ldh activity is indicated by purple stain; pink is nuclear fast red counterstain. Scale bars indicate 50 micrometers. d, Metabolomic analysis of Lactate on HFSCs isolated from UK-5099 treated skin for 48 hours; Each bar represents the average signal for each condition where n=9 mice pooled from 3 independent experiments. Shown as mean ± SEM. Paired t-test was performed, p < 0.05.
Figure 6
Figure 6. Stimulation of Myc levels promotes HFSC activation
a, RNA-seq data from sorted HFSCs in telogen and telogen-anagen transition. n=3 mice per timepoint. Shown as mean ± SEM. Paired t-test was performed, p < 0.05. b, Nuclear protein fractions show expression of n-Myc and c-Myc in HFSCs compared to epidermal cells. H3k27ac is a loading control for nuclear proteins. c, Total protein preps from skin treated with 2 topical doses of RCGD423 (50uM) show increased c-Myc, n-Myc and Ldha protein levels compared to animals that received 2 topical doses of vehicle control. β-actin is a loading control. d, Plate reader assay for Ldh enzyme activity in the epidermis. Each bar represents the average signal for each condition where n=9 mice pooled from 3 independent experiments. Shown as mean ± SEM. Paired t-test was performed, p < 0.05. e, Ldh enzyme activity assay in the epidermis in vehicle control and RCGD423 treated animals. Scale bar indicates 50 micrometers. f, Metabolomic analysis of Lactate on HFSCs isolated from RCGD423 treated skin for 48 hours. Each bar represents the average signal for each condition where n=9 mice pooled from 3 independent experiments. Shown as mean ± SEM. Paired t-test was performed, p < 0.05. g, Immunohistochemistry staining for Ki-67 and phospo-Stat3, a downstream marker of RCGD423 activity. Scale bar indicates 20 micrometers. h, Animals treated with RCGD423 (50uM) show pigmentation and hair growth, indicative of entry into anagen, after 5 doses. Images shown are representative of at least 14 mice from 7 independent experiments. Scale bar indicates 100 micrometers. Quantification of phenotype showing time to observed phenotype in vehicle versus RCGD423 treated mice. n = 6 mice per condition. Shown as mean ± SEM. Unprocessed scans of blots are shown in Supplementary Figure 6.

References

    1. Hsu YC, Pasolli HA, Fuchs E, et al. Dynamics between stem cells, niche, and progeny in the hair follicle. Cell. 2011;144:92–105. doi: 10.1016/j.cell.2010.11.049. - DOI - PMC - PubMed
    1. Morris RJ, Potten CS. Highly persistent label-retaining cells in the hair follicles of mice and their fate following induction of anagen. J Invest Dermatol. 1999;112:470–475. - PubMed
    1. Fuchs E, et al. The tortoise and the hair: slow-cycling cells in the stem cell race. Cell. 2009;137:811–819. doi: 10.1016/j.cell.2009.05.002. - DOI - PMC - PubMed
    1. Fuchs E, Merrill BJ, Jamora C, DasGupta R. At the roots of a never-ending cycle. Dev Cell. 2001;1:13–25. - PubMed
    1. Kloepper JE, et al. Mitochondrial function in murine skin epithelium is crucial for hair follicle morphogenesis and epithelial-mesenchymal interactions. J Invest Dermatol. 2015;135:679–689. doi: 10.1038/jid.2014.475. - DOI - PubMed

MeSH terms