. 2017 Apr 28;1(6):149.
doi: 10.1038/s41559-017-0149.

Optimization of lag phase shapes the evolution of a bacterial enzyme

Affiliations

Optimization of lag phase shapes the evolution of a bacterial enzyme

Bharat V Adkar et al. Nat Ecol Evol. .

Abstract

Mutations provide the variation that drives evolution, yet their effects on fitness remain poorly understood. Here we explore how mutations in the essential enzyme adenylate kinase (Adk) of Escherichia coli affect multiple phases of population growth. We introduce a biophysical fitness landscape for these phases, showing how they depend on molecular and cellular properties of Adk. We find that Adk catalytic capacity in the cell (the product of activity and abundance) is the major determinant of mutational fitness effects. We show that bacterial lag times are at a well-defined optimum with respect to Adk's catalytic capacity, while exponential growth rates are only weakly affected by variation in Adk. Direct pairwise competitions between strains show how environmental conditions modulate the outcome of a competition where growth rates and lag times have a tradeoff, shedding light on the multidimensional nature of fitness and its importance in the evolutionary optimization of enzymes.


Figures
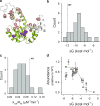
Fig. 1
Fig. 1. Biophysical and intracellular properties
(a) Crystal structure of Adenylate Kinase from E. coli (PDB ID 4ake). The core domain is colored in green, while the LID and NMP domains are shown in white. The Cα atoms of active-site residues are shown in pink, and the blue spheres represent the Cα atoms of the 6 buried positions which were mutated in this study. (b) Histogram showing the distribution of folding free energies for all mutant proteins, as determined by isothermal urea denaturation at 25 °C. The stability of WT is marked by a dashed line. (c) Histogram of the catalytic activity parameter kcat/KM for all mutants. The dashed line indicates the WT value. (d) Total intracellular abundance of mutant Adk proteins as a function of ΔG at 37 °C. The abundances are normalized by the WT value. Each data point represents the mean and error bars are standard deviation over two experiments. The dashed line represents the fit to the Boltzmann distribution function described in equation (1), where kB was 1.987 cal/mol/K. See related Supplementary Figs. 1–5 and Supplementary Table 1.
Fig. 2
Fig. 2. Traits of population growth
(a) Schematic of estimation of lag time and growth rate. The representative data points (solid gray circles) were plotted as ln(OD) vs time and was fitted to a four parameter Gompertz function (equation (2)) (cyan line). The red line is a tangent at the inflection point of the function. The slope of the tangent is considered as the growth rate (μ) and the time required to reach the maximum growth rate or the inflection point is taken as the lag time (λ) (vertical dashed line). (b) Relative growth rate (μ/μWT) and (c) relative lag time (λλWT) as functions of catalytic capacity which is defined as abundance×kcat/KM (using experimentally-measured abundance and activity values). The mutant data is shown in gray circles, whereas red circles represent the BW27783 strain with varying degrees of overexpression of WT Adk from a pBAD plasmid. Data for WT is shown in green. The data points represent mean and error bars represent s.e.m. of parameters derived from growth curves of 2–3 bacterial colonies (biological replicates). See related Supplementary Figs. 6–11 and Supplementary Tables 2–3. The solid gray arrow indicates the direction of increasing fitness.
Fig. 3
Fig. 3. Binary growth competition
The growth of individual strains was modeled as per Gompertz equation (equation (2)). The growth parameters for strain 1 were fixed to those obtained for WT Adk (dashed gray lines) while those for strain 2 were generated randomly over a wide range of growth rates (0.005 to 0.030 min−1) and lag times (50 to 250 min). (a) Contour plot showing fraction of strain 1 (WT) at saturation when the competition is carried out under two different conditions of fold-increase in growth over initial population (red line indicates K=5 while the black line indicates K=500). The dashed lines indicate neutrality region where both strains have equal proportions at saturation. The areas below the neutrality line (filled with solid lines) represent the parameter space where strain 2 wins the competition (fraction of strain 2 > 0.5). (b) Scatter plot of growth rate (μ) versus lag time (λ). The data points represent the mean and error bars the s.e.m. of parameters derived from 2–3 bacterial colonies (see Supplementary Table 2). The growth rate and lag time appear to be statistically independent of each other across the Adk mutant strains (Spearman’s ρ = 0.31, p = 0.15).
Fig. 4
Fig. 4. Growth curves at various nutrient concentration
(a) Growth curves of strains with WT Adk obtained under varying glucose concentrations in supplemented M9 medium. The fitted growth curve parameters are shown as functions of glucose concentration: (b) fold-increase over initial population at saturation (K) as derived from Gompertz fitting, (c) relative growth rate (μ/μ0.2), and (d) relative lag time (λλ0.2). The growth rates and lag times are estimated from analysis of growth curve derivatives and are normalized relative to the respective values at 0.2% glucose concentration.
Fig. 5
Fig. 5. Tradeoffs between lag and exponential growth in binary competitions
(a) Fraction of the first strain as a function of time in simulated binary competitions. We modeled growth of each strain using the Gompertz 4-parameter equation (equation (2)) with experimentally measured growth rate and lag time values. The initial OD for individual strains was assumed to be 0.006 at the start of competition, and growth was assumed to saturate at OD of 0.6. Despite having similar growth rates, the fraction of WT in WT + L209I and WT + Y182V competitions was always above 0.5 owing to the advantage it gained due to shorter lag time (scenario 2 in the text). L083F and V106H dominate at earlier time points where fold-increase in growth over initial population is low (equivalent to low carrying capacities) due to their short lag times compared to their respective competitors. However, at longer times (high carrying capacities) the advantage due to lag is lost due to their lower growth rates. (b, c) Experimental validations of the predictions in (a) using qPCR based mismatch amplification mutation assay (MAMA). The fraction of competing strains was estimated using equation (4). The data points are mean and error bars represent standard deviation of two measurements. See related Supplementary Fig. 12. The growth rates and lag times for the competing pairs are shown in insets.

References

    1. Sanjuan R, Moya A, Elena SF. The distribution of fitness effects caused by single-nucleotide substitutions in an RNA virus. Proceedings of the National Academy of Sciences of the United States of America. 2004;101:8396–8401. doi: 10.1073/pnas.0400146101. - DOI - PMC - PubMed
    1. Bershtein S, Segal M, Bekerman R, Tokuriki N, Tawfik DS. Robustness-epistasis link shapes the fitness landscape of a randomly drifting protein. Nature. 2006;444:929–932. doi: 10.1038/nature05385. - DOI - PubMed
    1. Bershtein S, Mu W, Shakhnovich EI. Soluble oligomerization provides a beneficial fitness effect on destabilizing mutations. Proceedings of the National Academy of Sciences of the United States of America. 2012;109:4857–4862. doi: 10.1073/pnas.1118157109. - DOI - PMC - PubMed
    1. Bershtein S, Mu W, Serohijos AW, Zhou J, Shakhnovich EI. Protein quality control acts on folding intermediates to shape the effects of mutations on organismal fitness. Mol Cell. 2013;49:133–144. doi: 10.1016/j.molcel.2012.11.004. - DOI - PMC - PubMed
    1. Bershtein S, et al. Protein Homeostasis Imposes a Barrier on Functional Integration of Horizontally Transferred Genes in Bacteria. PLoS genetics. 2015;11:e1005612. doi: 10.1371/journal.pgen.1005612. - DOI - PMC - PubMed

LinkOut - more resources