. 2018 Jan;58(1):40-54.
doi: 10.1165/rcmb.2017-0207OC.

A Circulating MicroRNA Signature Serves as a Diagnostic and Prognostic Indicator in Sarcoidosis

Collaborators, Affiliations

A Circulating MicroRNA Signature Serves as a Diagnostic and Prognostic Indicator in Sarcoidosis

Christian Ascoli et al. Am J Respir Cell Mol Biol. 2018 Jan.

Abstract

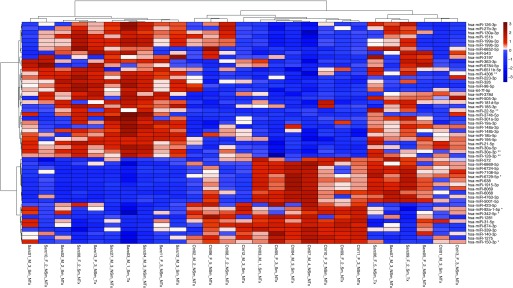
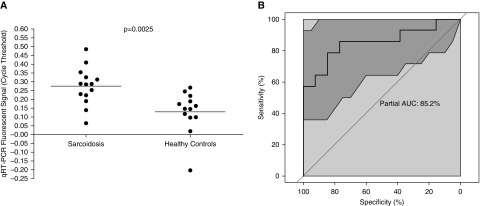
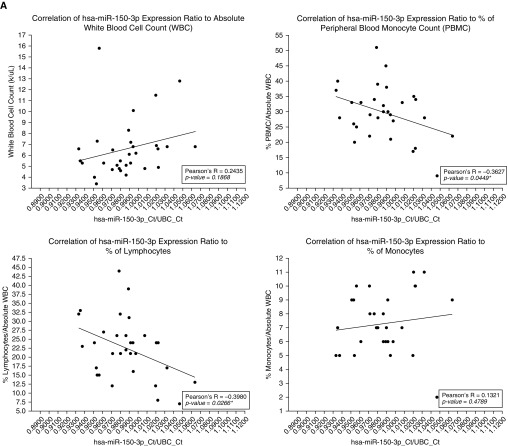
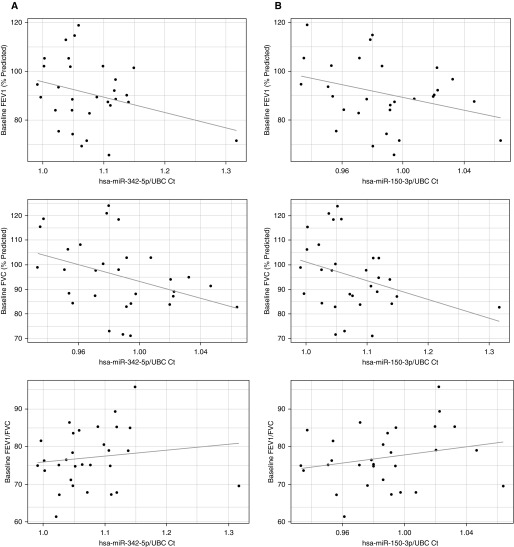
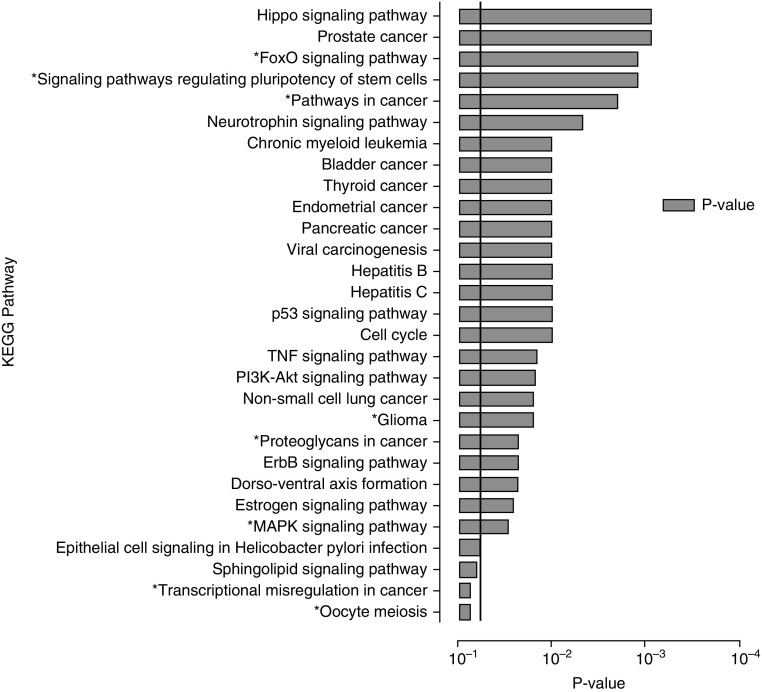
MicroRNAs (miRNAs) act as post-transcriptional regulators of gene expression. In sarcoidosis, aberrant miRNA expression may enhance immune responses mounted against an unknown antigenic agent. We tested whether a distinct miRNA signature functions as a diagnostic biomarker and explored its role as an immune modulator in sarcoidosis. The expression of miRNAs in peripheral blood mononuclear cells from subjects who met clinical and histopathologic criteria for sarcoidosis was compared with that observed in matched controls in the ACCESS (A Case Controlled Etiologic Study of Sarcoidosis) study. Signature miRNAs were determined by miRNA microarray analysis and validated by quantitative RT-PCR. Microarray analysis identified 54 mature, human feature miRNAs that were differentially expressed between the groups. Significant feature miRNAs that distinguished subjects with sarcoidosis from controls were selected by means of probabilistic models adjusted for clinical variables. Eight signature miRNAs were chosen to verify the diagnosis of sarcoidosis in a validation cohort, and distinguished subjects with sarcoidosis from controls with a positive predictive value of 88%. We identified both novel and previously described genes and molecular pathways associated with sarcoidosis as targets of these signature miRNAs. Additionally, we demonstrate that signature miRNAs (hsa-miR-150-3p and hsa-miR-342-5p) are significantly associated with reduced lymphocytes and airflow limitations, both of which are known markers of a poor prognosis. Together, these findings suggest that a circulating miRNA signature serves as a noninvasive biomarker that supports the diagnosis of sarcoidosis. Future studies will test the miRNA signature as a prognostication tool to identify unfavorable changes associated with poor clinical outcomes in sarcoidosis.

Keywords: biomarker; gene regulatory network; miRNA; peripheral blood mononuclear cells; sarcoidosis.


Figures

Figure 1.
Figure 1.
(A) Biplot demonstrating the correspondence analysis performed on microarray expression data, showing distinct clustering of sarcoidosis cases and matched controls. (B) Biplot demonstrating identified miRNAs. Subjects/miRNAs with strong associations are projected in the same direction and with greater distance from the origin. miRNA, microRNA.
Figure 2.
Figure 2.
A supervised heatmap demonstrating clinical characteristics per subject (columns) and the z-score–scaled expression of the 54 feature miRNAs (rows) identified using the nearest shrunken centroids method with 10-fold cross-validation at a median false discovery rate of 1%. Hierarchical clustering was performed using Ward’s agglomerative clustering method. Overexpression in sarcoidosis is depicted in red, and underexpression in sarcoidosis is depicted in blue. Clinical characteristics: male (M), female (F), age group (1: <30 years, 2: 30–39 years, 3: 40–49 years, 4: 50–59 years, 5: >60 years) smoking history (Sm), no smoking history (NSm), immunomodulator therapy (Tx), and no therapy (NTx). **Signature miRNA predictive of sarcoidosis; *signature miRNA predictive of health.
Figure 3.
Figure 3.
(A) Comparison of the miRNA signature expression values (Ct) between the sarcoidosis and matched control groups in the experimental cohort. Ct values were significantly greater in the sarcoidosis group compared with the matched controls, indicating reduced expression and supporting the use of these signature miRNAs as a discriminatory test for diagnosing sarcoidosis (unpaired t test with Welch’s correction, P = 0.0025). (B) Receiver operating characteristic curve demonstrating the accuracy of our eight signature miRNAs as a discriminatory test for diagnosing sarcoidosis (AUC = 85.2%) in the experimental cohort. The shaded area represents the 95% CI. AUC = area under the curve; CI = confidence interval; Ct = cycle threshold.
Figure 4.
Figure 4.
Correlations between miRNA expression profiles (adjusted for UBC) and white blood cell parameters. Pearson’s correlation coefficient depicts the strength of the relationships (*P < 0.05 was considered significant). (A) Correlation between hsa-miR-150-3p expression and white blood cell parameters (absolute white blood cell count, PBMC [%], lymphocyte [%], monocyte [%]). A significant negative correlation was found between hsa-miR-150-3p expression and PBMC (%) and lymphocyte (%). (B) Correlation between hsa-miR-342-5p expression and white blood cell parameters (absolute white blood cell count, PBMC [%], lymphocyte [%], and monocyte [%]). A significant negative correlation was found between hsa-miR-342-5p expression and PBMC (%) and lymphocyte (%). PBMC = peripheral blood monocyte; UBC = ubiquitin C.
Figure 4.
Figure 4.
Correlations between miRNA expression profiles (adjusted for UBC) and white blood cell parameters. Pearson’s correlation coefficient depicts the strength of the relationships (*P < 0.05 was considered significant). (A) Correlation between hsa-miR-150-3p expression and white blood cell parameters (absolute white blood cell count, PBMC [%], lymphocyte [%], monocyte [%]). A significant negative correlation was found between hsa-miR-150-3p expression and PBMC (%) and lymphocyte (%). (B) Correlation between hsa-miR-342-5p expression and white blood cell parameters (absolute white blood cell count, PBMC [%], lymphocyte [%], and monocyte [%]). A significant negative correlation was found between hsa-miR-342-5p expression and PBMC (%) and lymphocyte (%). PBMC = peripheral blood monocyte; UBC = ubiquitin C.
Figure 5.
Figure 5.
General linear models depicting associations between miRNA expression profiles (adjusted for UBC) and spirometric values (spirometric parameter ∼ age + sex + smoking history + Scadding + treatment + miRNA expression). (A) Association between hsa-miR-342-5p expression and baseline spirometric parameters (FEV1 [% predicted], FVC [% predicted], FEV1/FVC). A significant and independent relationship between hsa-miR-342-5p and FEV1 (P = 0.026; β = −99.57) was demonstrated. Although it was significant, the association between hsa-miR-342-5p and FVC was not independent and was impacted by treatment status (P = 0.026, 0.027; β = −84.76 and 13.56, respectively). No significant relationship was found between FEV1/FVC and hsa-miR-342-5p expression. (B) Association between hsa-miR-150-3p expression and baseline spirometric parameters (FEV1 [% predicted], FVC [% predicted], and FEV1/FVC). Significant and independent relationships between hsa-miR-150-3p expression and both FEV1 and FVC (P = 0.04232 and 0.04982; β = −183.83 and −161.03, respectively) were identified. No statistically significant association was found between hsa-miR-150-3p expression and FEV1/FVC.
Figure 6.
Figure 6.
KEGG pathways enriched by the eight miRNAs that comprise our circulating miRNA signature identified by the miRNet miRNA-target algorithm. Significance was established with a P-value threshold of <0.05. *Pathways targeted by both hsa-miR-150-3p and hsa-miR-342-5p. KEGG = Kyoto Encyclopedia of Genes and Genomes.
Figure 7.
Figure 7.
Reduced miRNA-KEGG pathway interaction network, showing all genes within pathways that were targeted by at least two of the eight circulating signature miRNAs. Square nodes represent miRNAs, and circles represent target genes. The major hubs of interaction within the network of targeted KEGG pathways appear to be hsa-miR-128-3p, hsa-miR-4306, hsa-miR-30e-3p, and hsa-miR-342-5p through ALDH9A1, NUFIP2, and ZNF385A (each with three degrees of interaction).

References

    1. Grunewald J, Spagnolo P, Wahlström J, Eklund A. Immunogenetics of disease-causing inflammation in sarcoidosis. Clin Rev Allergy Immunol. 2015;49:19–35. - PubMed
    1. Iannuzzi MC, Rybicki BA, Teirstein AS. Sarcoidosis. N Engl J Med. 2007;357:2153–2165. - PubMed
    1. Huang H, Lu Z, Jiang C, Liu J, Wang Y, Xu Z. Imbalance between Th17 and regulatory T-cells in sarcoidosis. Int J Mol Sci. 2013;14:21463–21473. - PMC - PubMed
    1. Ramstein J, Broos CE, Simpson LJ, Ansel KM, Sun SA, Ho ME, et al. IFN-γ-producing T-helper 17.1 cells are increased in sarcoidosis and are more prevalent than T-helper type 1 cells. Am J Respir Crit Care Med. 2016;193:1281–1291. - PMC - PubMed
    1. Hunninghake GW, Costabel U, Ando M, Baughman R, Cordier JF, du Bois R, et al. ATS/ERS/WASOG statement on sarcoidosis. American Thoracic Society/European Respiratory Society/World Association of Sarcoidosis and other Granulomatous Disorders. Sarcoidosis Vasc Diffuse Lung Dis. 1999;16:149–173. - PubMed