

Metabolomics reveals that vine tea (Ampelopsis grossedentata) prevents high-fat-diet-induced metabolism disorder by improving glucose homeostasis in rats
- PMID: 28813453
- PMCID: PMC5558946
- DOI: 10.1371/journal.pone.0182830
Metabolomics reveals that vine tea (Ampelopsis grossedentata) prevents high-fat-diet-induced metabolism disorder by improving glucose homeostasis in rats
Abstract
Background: Vine tea (VT), derived from Ampelopsis grossedentata (Hand.-Mazz.) W.T. Wang, is an alternative tea that has been consumed widely in south China for hundreds of years. It has been shown that drinking VT on a daily basis improves hyperlipidemia and hyperglycemia. However, little is known about the preventive functions of VT for metabolic dysregulation and the potential pathological mechanisms involved. This paper elucidates the preventive effects of VT on the dysregulation of lipid and glucose metabolism using rats maintained on a high-fat-diet (HFD) in an attempt to explain the potential mechanisms involved.
Methods: Sprague Dawley (SD) rats were divided into five groups: a group given normal rat chow and water (control group); a group given an HFD and water (HFD group); a group given an HFD and Pioglitazone (PIO group), 5 mg /kg; and groups given an HFD and one of two doses of VT: 500 mg/L or 2000 mg/L. After 8 weeks, changes in food intake, tea consumption, body weight, serum and hepatic biochemical parameters were determined. Moreover, liver samples were isolated for pathology histology and liquid chromatography-mass spectrometry (LC-MS)-based metabolomic research.
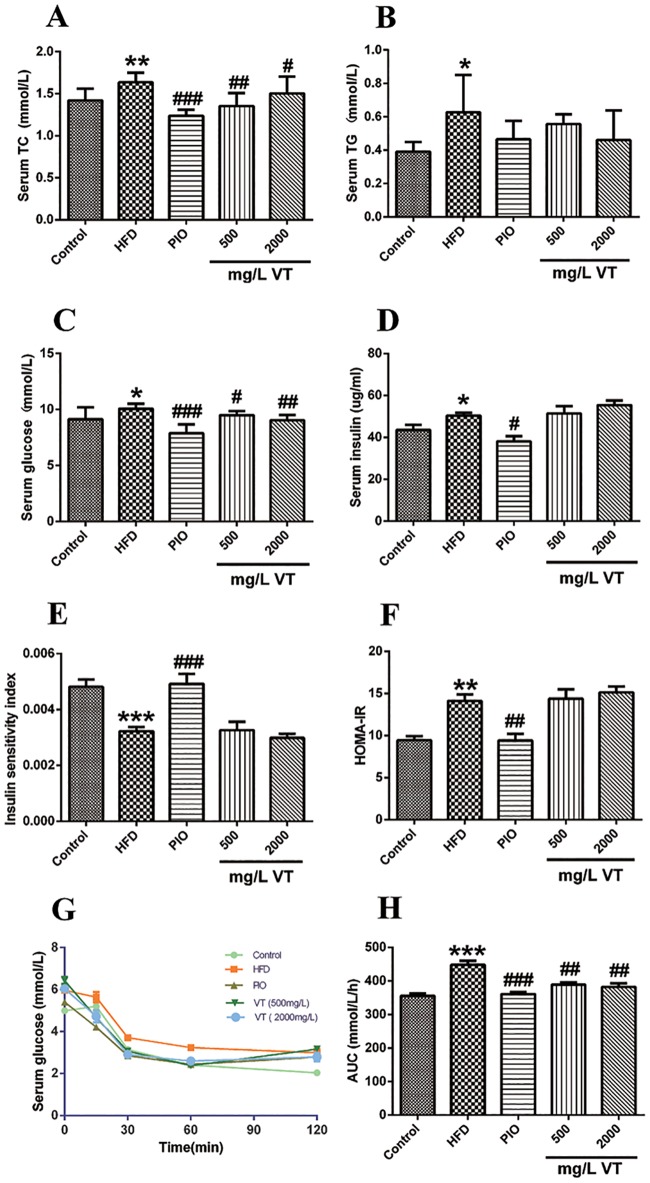
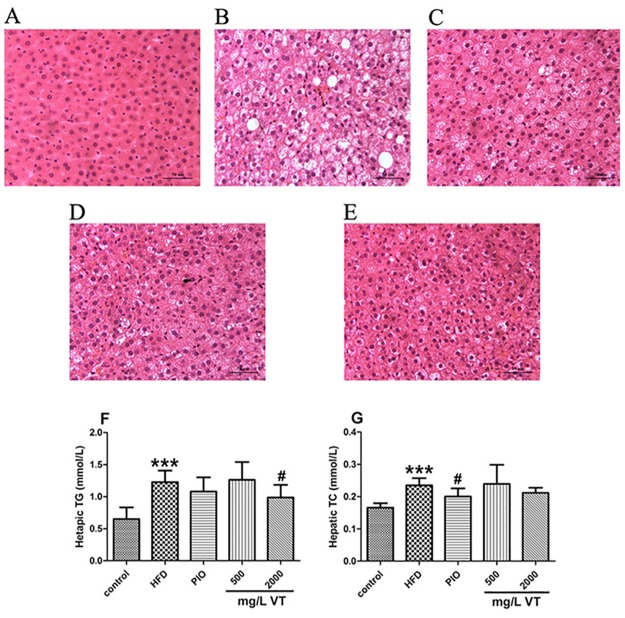
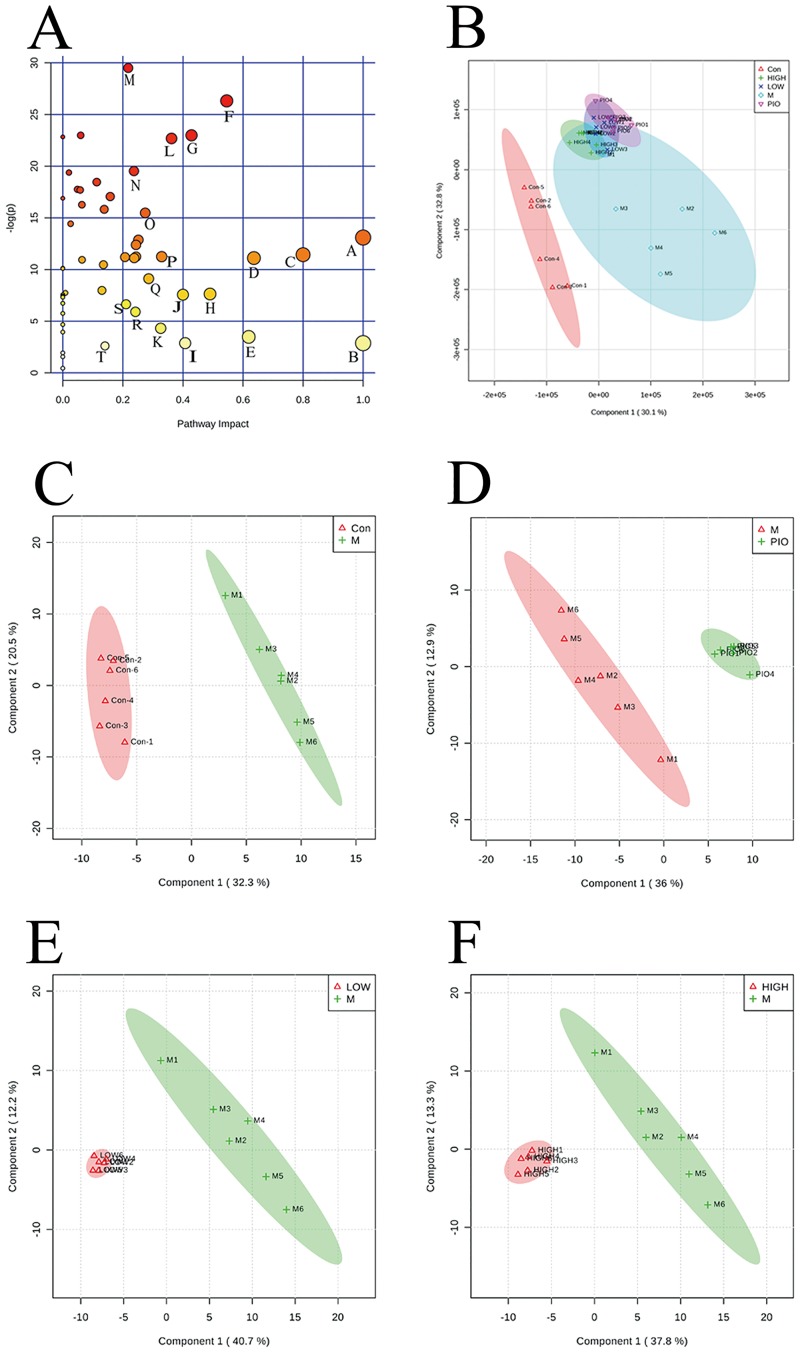
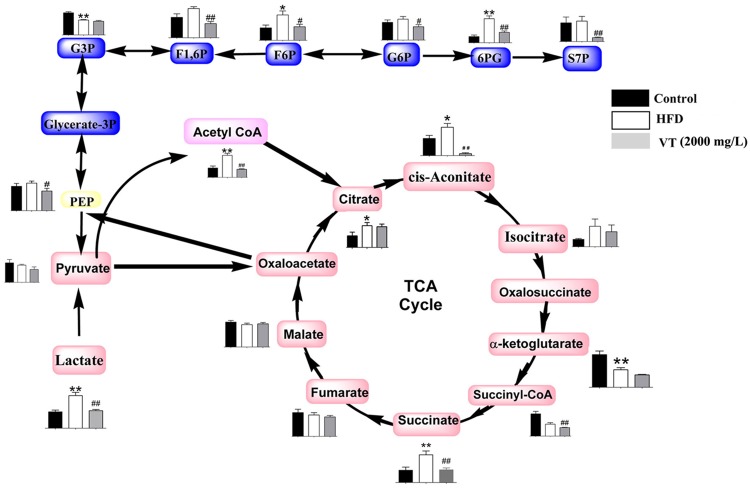
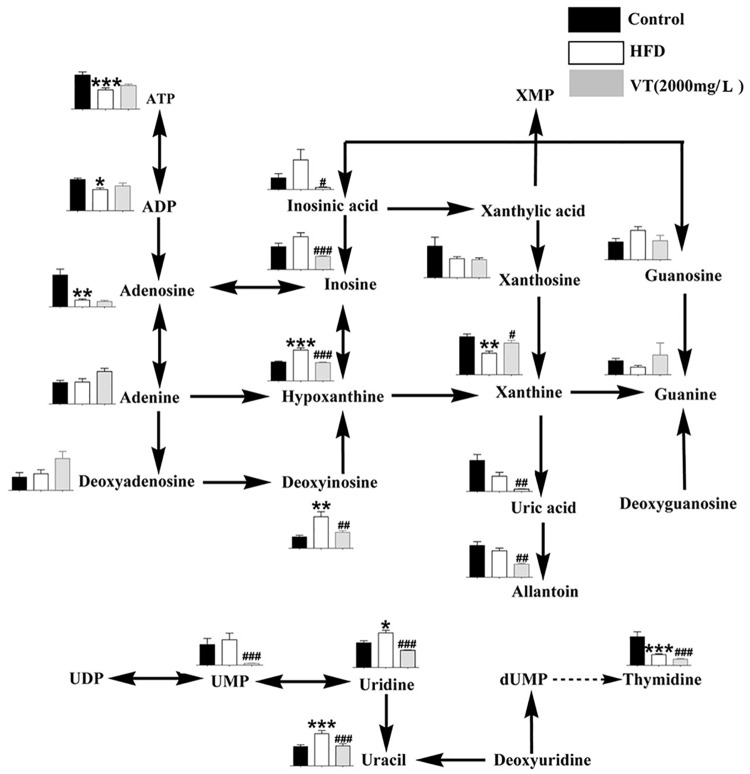
Results: VT reduced the serum levels of glucose and total cholesterol, decreased glucose area under the curve in the insulin tolerance test and visibly impaired hepatic lipid accumulation. Metabolomics showed that VT treatment modulated the contents of metabolic intermediates linked to glucose metabolism (including gluconeogenesis and glycolysis), the TCA cycle, purine metabolism and amino acid metabolism.
Conclusion: The current results demonstrate that VT may prevent metabolic impairments induced by the consumption of an HFD. These effects may be caused by improved energy-related metabolism (including gluconeogenesis, glycolysis and TCA cycle), purine metabolism and amino acid metabolism, and reduced lipid levels in the HFD-fed rats.
Conflict of interest statement
Figures
References
-
- Li YS. Effects of Enshi-Ampelopsis Grossede on serum lipid and blood rheology and oxygen free radical of hyperlipidemia model rats. Journal of hubei institute for nationalities (Medical Edition). 2006;23(2):7–9.
-
- Wang J, He L, Zheng N, Kong Q, Yu Q, Yu Z. Dihydromyricetin in Ampelosis grossedentata collected from different habitats. Chinese traditional patent medicine. 2014;36(1):145–147.
-
- Chen SH, Zhao XL, Wan J, Ran L, Qin Y, Wang XF, et al. Dihydromyricetin improves glucose and lipid metabolism and exerts anti-inflammatory effects in nonalcoholic fatty liver disease: A randomized controlled trial. Pharmacological research. 2015;99:74–81. doi: 10.1016/j.phrs.2015.05.009 - DOI - PubMed
-
- Chen YQ, Dejian Ni, Chen Q, Huang HB, Meng Y, MC W. Study on the hypolipidemic effect of flavones and dihydromyricetin from Tengcha. Journal of tea science. 2007;27(03):221–225.
-
- Lamharzi N, Renard B.C., Kramer F., Pennathur S., Heinecke W. J., Chait A., et al. Hyperlipidemia in Concert With Hyperglycemia Stimulates the Proliferation of Macrophages in Atherosclerotic Lesions potential role of glucose-oxidized LDL. Diabetes. 2004;53(12):3217–3225. - PubMed
MeSH terms
Substances
LinkOut - more resources
Full Text Sources
Other Literature Sources
Medical
