. 2017 Aug 15;47(2):284-297.e5.
doi: 10.1016/j.immuni.2017.07.020.

The DNA Methylcytosine Dioxygenase Tet2 Sustains Immunosuppressive Function of Tumor-Infiltrating Myeloid Cells to Promote Melanoma Progression

Affiliations

The DNA Methylcytosine Dioxygenase Tet2 Sustains Immunosuppressive Function of Tumor-Infiltrating Myeloid Cells to Promote Melanoma Progression

Wen Pan et al. Immunity. .

Abstract

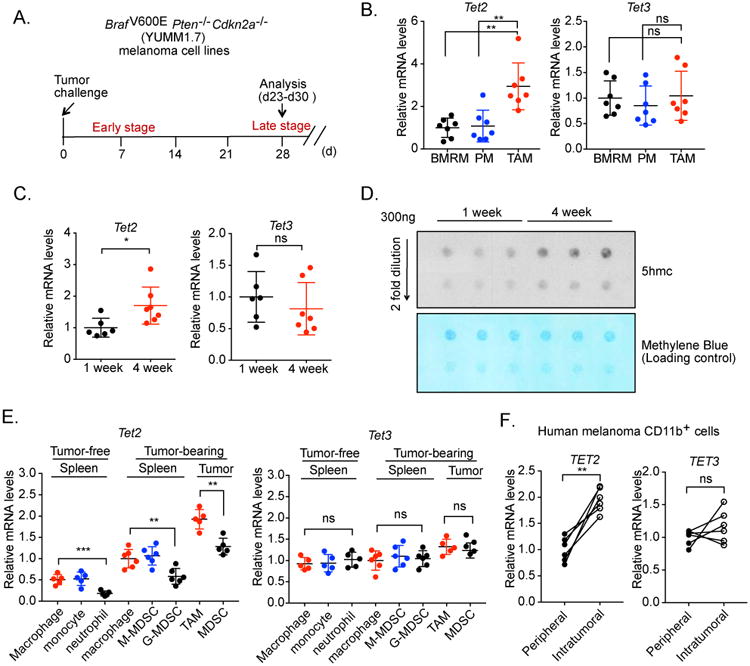
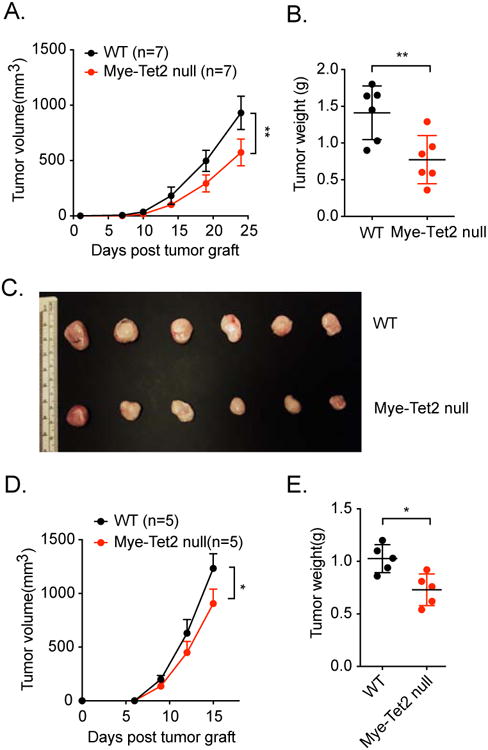
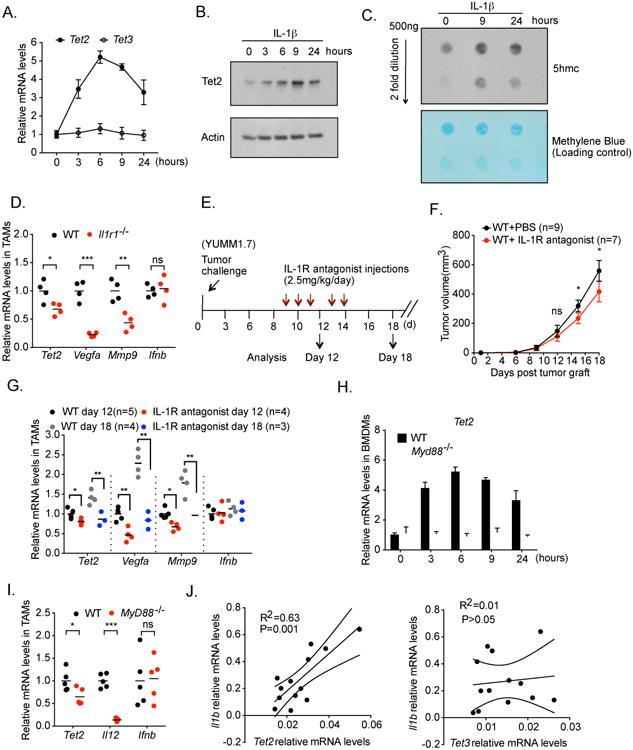
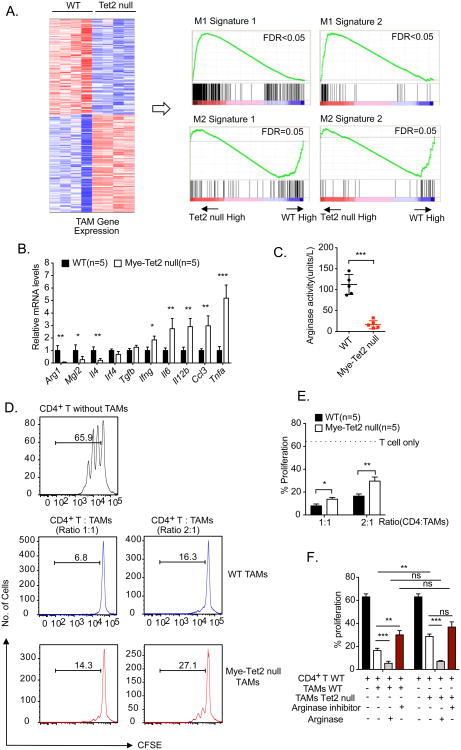
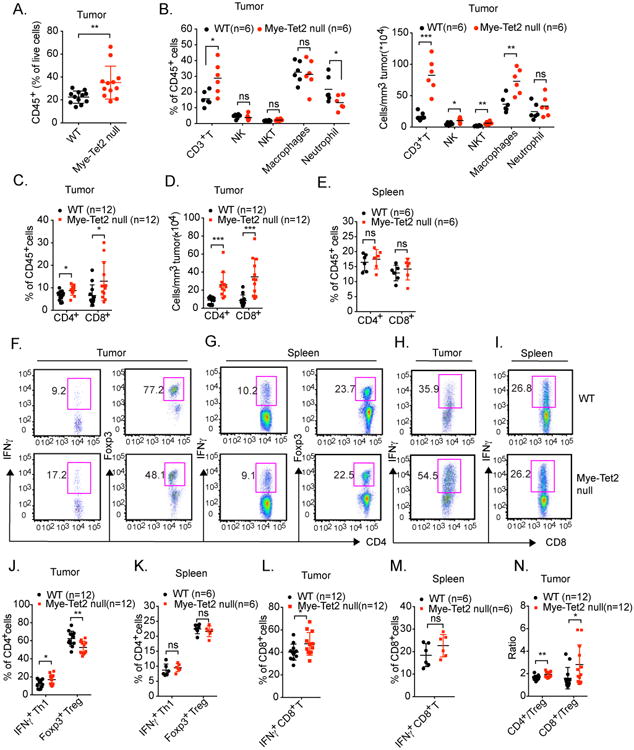
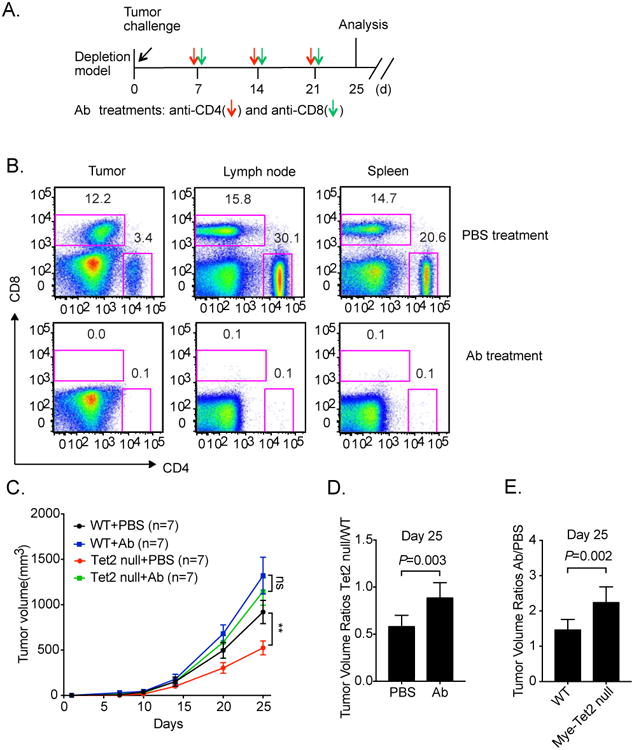
Ten-Eleven-Translocation-2 (Tet2) is a DNA methylcytosine dioxygenase that functions as a tumor suppressor in hematopoietic malignancies. We examined the role of Tet2 in tumor-tissue myeloid cells and found that Tet2 sustains the immunosuppressive function of these cells. We found that Tet2 expression is increased in intratumoral myeloid cells both in mouse models of melanoma and in melanoma patients and that this increased expression is dependent on an IL-1R-MyD88 pathway. Ablation of Tet2 in myeloid cells suppressed melanoma growth in vivo and shifted the immunosuppressive gene expression program in tumor-associated macrophages to a proinflammatory one, with a concomitant reduction of the immunosuppressive function. This resulted in increased numbers of effector T cells in the tumor, and T cell depletion abolished the reduced tumor growth observed upon myeloid-specific deletion of Tet2. Our findings reveal a non-cell-intrinsic, tumor-promoting function for Tet2 and suggest that Tet2 may present a therapeutic target for the treatment of non-hematologic malignancies.

Keywords: 5hmC; 5mC; Arg1; BMDM; HSC; Il1b; MDSC; TAM; Tet3; YUMM1.7.


Figures

Figure 1
Figure 1. Increased amounts of Tet2 transcripts in TAMs and MDSCs during melanoma progression
(A) Schematic illustration of the syngeneic tumor model in which BrafV600EPten-/- Cdkn2a-/-(YUMM1.7) melanoma cells were injected subcutaneously. Tumor-associated macrophages (TAMs) were harvested at one and four weeks. (B) Tet2 and Tet3 transcript amounts were determined in peritoneal macrophages (PM) and bone marrow resident macrophages (BMRM) from tumor-free mice and TAMs (four weeks after tumor cell injection) from tumor-bearing wildtype (WT) mice, using qRT-PCR. n=7. Normalized RNA expression is shown with each dot reflecting one mouse. (C) TAMs were harvested from WT mice at one week (n=6) and four weeks (n=7) post tumor cell injection. Tet2 and Tet3 transcript amounts were determined by qRT-PCR. Normalized RNA expression is shown with each dot reflecting one mouse. (D) TAMs were harvested from WT mice at the indicated time points after tumor cell injection. 5hmc levels in genomic DNA were determined by dot blot analysis, with methylene blue staining used as a loading control. (E) Tet2 and Tet3 transcript levels were determined in TAMs and MDSCs purified from tumor mass, splenic macrophages, monocytic MDSCs (M-MDSCs) and granulocytic MDSCs (G-MDSCs) purified from tumor-bearing WT mice, as well as splenic macrophages, monocytes and granulocytes purified from WT mice without tumor. (F) Tet2 and Tet3 transcript levels were determined in peripheral and intratumoral CD11b+ myeloid cells isolated from six human melanoma patients. Each line connects samples from the same patient. For all panels, *: P< 0.05; **: P < 0.01; ns: not significant. Data are representative of three (B-E) or two (D) independent experiments. Please also see Figure S1.
Figure 2
Figure 2. Myeloid-specific deletion of Tet2 inhibits melanoma growth
(A-C) YUMM1.7 melanoma cells were injected into WT and Mye-Tet2-null mice. (A) Mean tumor volume in WT and Mye-Tet2 null mice. n=7. (B) Tumor weights four weeks after tumor cell injection. n=6. (C) Pictures of tumors for (B). (D, E) B16-OVA melanoma cells were injected into WT and Mye-Tet2 null mice. (D) Mean tumor volume in WT and Mye-Tet2-null mice. n=5. (E) Tumor weights at the endpoint for (D). For all panels, *: P< 0.05; **: P < 0.01; ns: not significant. Data are representative of three (A-C) or two (D-E) independent experiments.
Figure 3
Figure 3. Tet2 transcripts are increased by IL-1 receptor signaling and dependent on the MyD88 pathway
(A, B, C) Bone marrow derived macrophages (BMDM) were treated with 100 ng/ml IL-1β for the indicated hours. (A) Tet2 and Tet3 transcript levels were determined by qRT-PCR. (B) Representative western blot of Tet2 protein levels, with beta actin as a loading control. (C) Representative dot blot of 5hmc levels in genomic DNA for the indicated time points. Methylene blue staining was used as a loading control. (D) YUMM1.7 melanoma cells were injected into wildtype (WT) or Il1r1-/- mice. Tumor associated macrophages (TAMs) were harvested four weeks post injection. Transcript levels of Tet2, Vegfa, Mmp9 and Ifnb were determined by qRT-PCR, with each dot representing a mouse. n=4. (E-G) The effect of acute inhibition of IL-1R signaling by an IL-1R antagonist on Tet2 transcripts and tumor progression. (E) Experimental schematics. (F) Tumor volume. (G) TAMs were harvested at Day 12 and Day 18. Transcript levels of Tet2, Vegfa, Mmp9 and Ifnb were determined by qRT-PCR, with each dot representing a mouse. (H) WT or Myd88-/- BMDM cells were treated with 100 ng/ml IL-1β for the indicated hours. Tet2 transcript levels were determined by qRT-PCR. (I) YUMM1.7 melanoma cells were injected into wildtype (WT) or Myd88-/- mice. TAMs were harvested four weeks post injection. Transcript levels of Tet2, IL-12b and Ifnb were determined by qRT-PCR, with each dot representing a mouse. n=5. (J) Correlation analysis of the transcript levels of Il1b with those of Tet2 and Tet3 were determined in TAMs isolated from week 1 and week 4 YUMM1.7 tumors in WT mice. For all panels, *: P< 0.05; **: P < 0.01; ns: not significant. Error bars represent S.E.M. Data are representative of three independent experiments. Please also see Figure S2.
Figure 4
Figure 4. Tet2 sustains immunosuppressive function and gene expression in TAMs
(A) Tumors were initiated by YUMM1.7 cell injection. RNA-seq experiments were performed on TAMs isolated from WT and Mye-Tet2 null mice ∼4 weeks post injection. n=4. A heat map of 214 differentially expressed genes are shown on the left. Right: two independent sets of M1 and M2 macrophage signatures were queried on the TAM gene expression using gene set enrichment analysis (GSEA) to reveal the decrease of M2 signature and the increase of M1 signature in Mye-Tet2 null TAMs. GSEA plots are shown. (B) qRT-PCR analysis of the mRNA levels of indicated genes in TAMs from WT or Mye-Tet2 null mice. n=5. (C) TAMs from WT or Mye-Tet2 null mice were analyzed for arginase activity in cell lysates. (D, E, F) TAMs purified from WT or Mye-Tet2 null mice were co-cultured with CD4+ T cells at the indicated cellular ratios for T cell activation assay. T cell proliferation was quantified by CFSE-labeling and dye dilution for three days in vitro. (D) Representative histograms of CFSE signals in the in vitro T cell activation assay. (E) Quantification of CD4+ T cell proliferation in (D). (F) Quantification of CD4+ T cell proliferation with recombinant human arginase 1 (1 μg/ml) or arginase inhibitor (100 μM) added into the co-culture medium. For all panels, *: P< 0.05; **: P < 0.01; ***: P< 0.001; ns: not significant. Error bars represent S.E.M. Data for all panels are representative of two or more independent experiments. Please also see Figure S3, S4.
Figure 5
Figure 5. Myeloid-specific deletion of Tet2 leads to an increase of tumor-infiltrating T cells
(A-N) YUMM1.7 melanoma cells were injected into WT or Mye-Tet2 null mice. Tumor infiltrating immune cells were examined by flow cytometry four weeks after injection. (A) The percentages of tumor-infiltrating CD45+ hematopoietic cells within all live cells from the tumor were quantified. Each dot represents one mouse. n=12. (B) For intratumoral cells, the percentages within total CD45+ cells (left) or numbers per tumor volume (right) of the indicated immune cell populations were quantified. Each dot represents one mouse. n=6. (C, D) Tumor-infiltrating CD4+ and CD8+ T cells were quantified either as (C) the percentages within total CD45+ cells, or (D) as absolute numbers per tumor volume. Each dot represents one mouse. n=12. (E) The percentages of splenic CD4+ and CD8+ T cells from tumor-bearing mice were quantified within total CD45+ splenocytes. n=6. (F-N) Intratumoral T cells or splenic T cells from tumor-bearing mice were further characterized by flow cytometry. (F, J) Statistical and representative flow cytometry plots showing the percentages of CD4+ IFNγ+ Th1 cells and CD4+ Foxp3+ Treg cells within total intratumoral CD4+ T cells. Each dot represents one mouse. n=12. (G, K) Similar analysis as (F, J) was performed on splenic T cells within tumor-bearing mice. n=6. (H, L) Statistical and representative flow cytometry plots showing the percentages of CD8+ IFNγ+ T cells within total intratumoral CD8+ T cells. Each dot represents one mouse. n=12. (I, M) Similar analysis as (H, L) was performed on splenic T cells within tumor-bearing mice. n=6. (N) Ratios of intratumoral CD4+ to Treg and CD8+ to Treg cells were quantified. Each dot represents one mouse. For all panels, *: P< 0.05; **: P < 0.01; ns: not significant. Data are representative of three independent experiments. Please also see Figure S5.
Figure 6
Figure 6. T cell depletion abolishes the reduced tumor size phenotype seen in Mye-Tet2 null mice
(A) Schematic illustration of the T cell depletion experiment. YUMM1.7 melanoma cells were injected into WT or Mye-Tet2 null mice. Anti-CD4 and anti-CD8 antibodies (Ab) were intraperitoneally injected every 7 days at the indicated time points. PBS was injected as a mock control. (B) T cell depletion efficiencies in spleen, lymph node, and tumor were determined after three antibody injections. Representative flow cytometry plots are shown. (C) Tumor growth curves in WT and Mye-Tet2 null mice either treated with PBS or with antibodies are shown. n=7. **, P < 0.01; ns: not significant. Error bars represent S.E.M. (D) Statistical analysis of tumor volume ratio between Mye-Tet2 null and WT mice at day 25, for PBS or Ab treatment groups. (E) Statistical analyses of tumor volume ratio between Ab and PBS treatment groups at day 25, for WT and Mye-Tet2 null groups. Error bars for (D, E) represent S.D. See methods for P value determination. Data represent three (B) and two (C-E) independent experiments. Please also see Figure S6.

References

    1. Abram CL, Roberge GL, Hu YM, Lowell CA. Comparative analysis of the efficiency and specificity of myeloid-Cre deleting strains using ROSA-EYFP reporter mice. Journal of immunological methods. 2014;408:89–100. - PMC - PubMed
    1. Amit I, Winter DR, Jung S. The role of the local environment and epigenetics in shaping macrophage identity and their effect on tissue homeostasis. Nature immunology. 2016;17:18–25. - PubMed
    1. An J, Gonzalez-Avalos E, Chawla A, Jeong M, Lopez-Moyado IF, Li W, Goodell MA, Chavez L, Ko M, Rao A. Acute loss of TET function results in aggressive myeloid cancer in mice. Nature communications. 2015;6:10071. - PMC - PubMed
    1. Bhatia S, Thompson JA. Melanoma: immune checkpoint blockade story gets better. Lancet. 2014;384:1078–1079. - PubMed
    1. Biswas SK, Sica A, Lewis CE. Plasticity of macrophage function during tumor progression: regulation by distinct molecular mechanisms. J Immunol. 2008;180:2011–2017. - PubMed