. 2017 Aug 15;47(2):323-338.e6.
doi: 10.1016/j.immuni.2017.07.014.

Tissue-Resident Macrophages in Pancreatic Ductal Adenocarcinoma Originate from Embryonic Hematopoiesis and Promote Tumor Progression

Affiliations

Tissue-Resident Macrophages in Pancreatic Ductal Adenocarcinoma Originate from Embryonic Hematopoiesis and Promote Tumor Progression

Yu Zhu et al. Immunity. .

Erratum in

Abstract

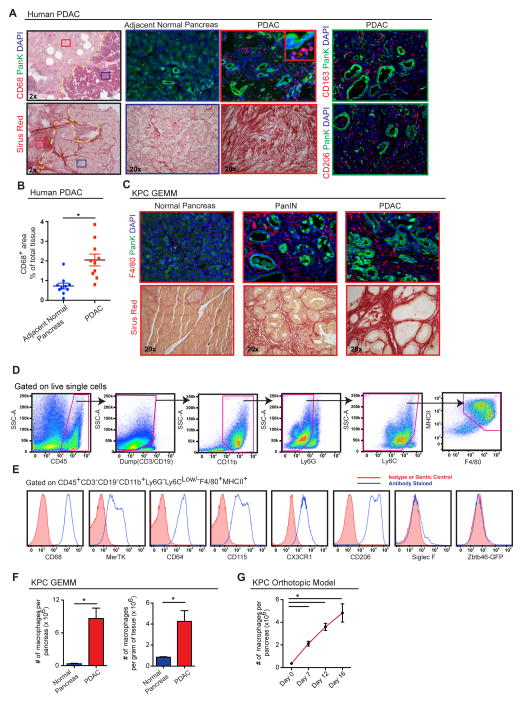
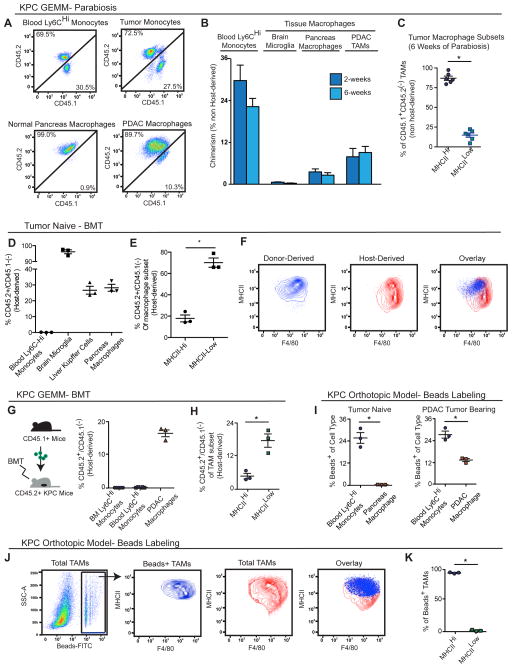
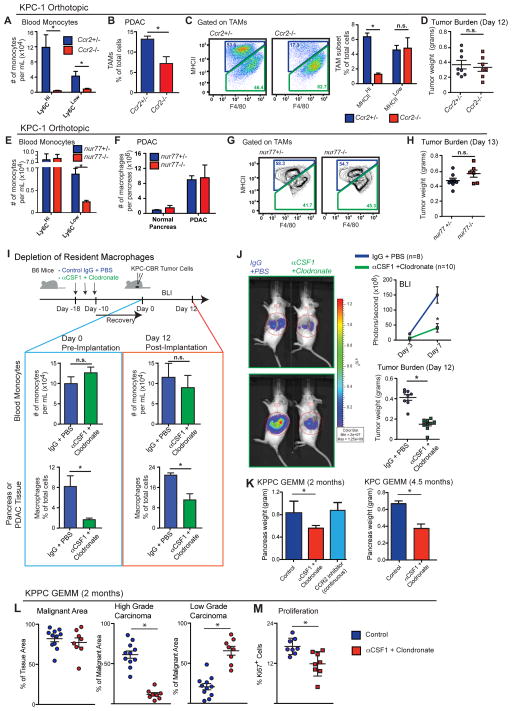
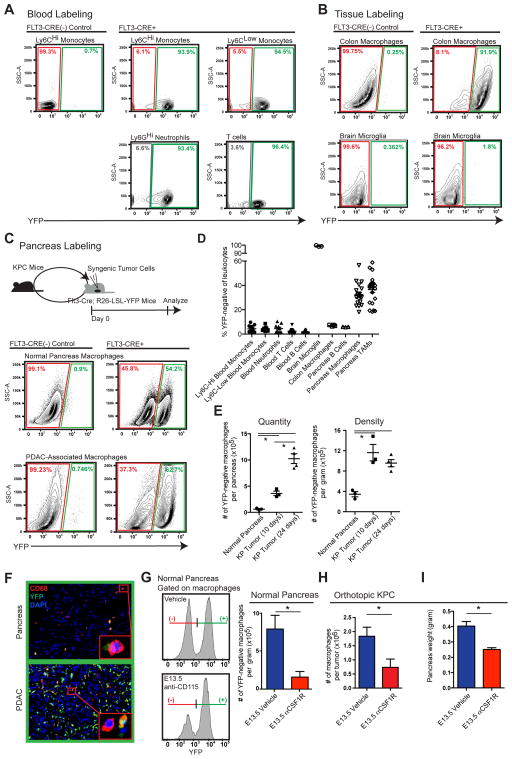
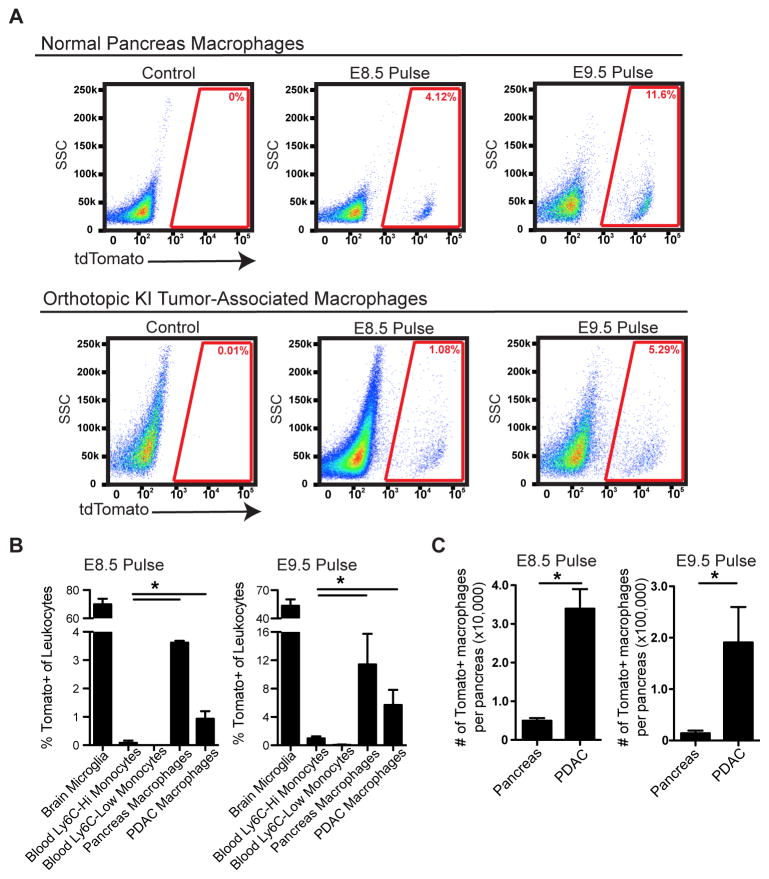
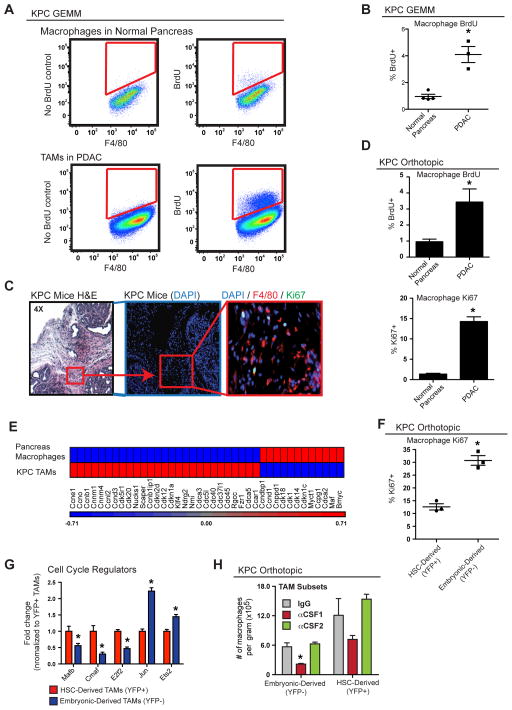
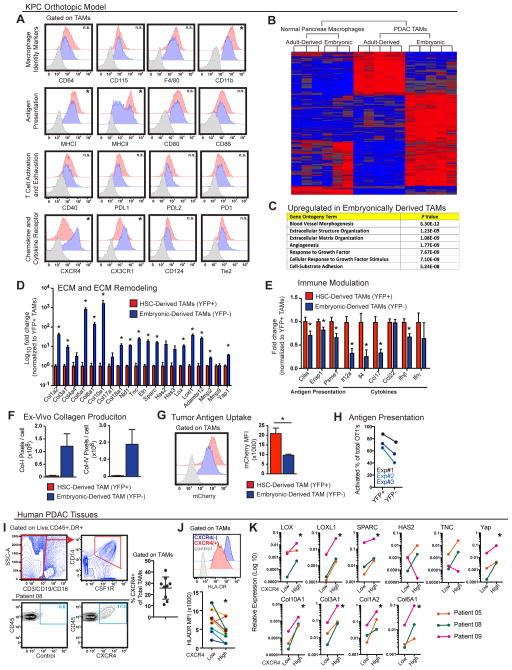
Tumor-associated macrophages (TAMs) are essential components of the cancer microenvironment and play critical roles in the regulation of tumor progression. Optimal therapeutic intervention requires in-depth understanding of the sources that sustain macrophages in malignant tissues. In this study, we investigated the ontogeny of TAMs in murine pancreatic ductal adenocarcinoma (PDAC) models. We identified both inflammatory monocytes and tissue-resident macrophages as sources of TAMs. Unexpectedly, significant portions of pancreas-resident macrophages originated from embryonic development and expanded through in situ proliferation during tumor progression. Whereas monocyte-derived TAMs played more potent roles in antigen presentation, embryonically derived TAMs exhibited a pro-fibrotic transcriptional profile, indicative of their role in producing and remodeling molecules in the extracellular matrix. Collectively, these findings uncover the heterogeneity of TAM origin and functions and could provide therapeutic insight for PDAC treatment.

Keywords: fibrosis; macrophage ontogeny; pancreas; pancreatic cancer; tissue-resident macrophage; tumor immunity.


Figures

Figure 1
Figure 1. Pancreatic Ductal Adenocarcinomas Are Highly Infiltrated with Macrophages
(A) Representative images of human PDAC and adjacent normal pancreatic tissues assessed for macrophage density (CD68, CD206, or CD163) and fibrosis (Sirius Red). Epithelial cells were stained by pan-Keratin (PanK). (B) Quantitation of CD68+ cells in human PDAC tissue vs. normal adjacent tissue from the same surgical sample.(n=10 paired samples) (C) Representative images of pancreas tissue from the p48-CRE/KrasG12D/p53flox/+ (KPC) mouse model assessing macrophage infiltration (F4/80) and collagen density (Sirius Red). (D) Representative flow cytometry plots showing gating strategy to identify macrophages in autochthonous KPC tumors. (E) Measurement of listed cell surface markers analyzed by flow cytometry and pre-gated on macrophages as shown in (D). (F) Quantitation of macrophages by flow cytometry in normal pancreas tissues and advanced KPC PDAC tissues (n=4–8/group). (G) Kinetics of macrophage numbers assessed by flow cytometry in syngeneic orthotopic KPC-1 tumors. (n=4/group) Data are shown as mean ± SEM and * denotes p<0.05 by t-test or Mann-Whitney test. Panels D–G are representatives of 2–3 independent experiments.
Figure 2
Figure 2. Substantial Portions of Macrophages in Steady-State Pancreas and PDAC Maintained Independently of Blood Monocytes
(A) 3.5-month-old homozygous CD45.1 and CD45.2 (KPC or wild-type C57BL/6) mice were surgically joined to create parabiotic pairs. Tissues were analyzed after 2 or 6 weeks of parabiosis. Representative plots (6 weeks) of chimerism in indicated cell types are shown. (B) Quantitation of chimerism in (A); (n=6–16/group). (C) MHCIIhi and MHCIIlo composition of CD45.1+CD45.2(−)-derived TAMs in (B); (n=6/group) (D) C57BL/6J mice were lethally irradiated and adoptively transferred with bone marrow cells from homozygous CD45.1 mice. Analysis of chimerism in several tissues after 6 weeks is depicted. (E) Quantitation of chimerism in MHCIIHi and MHCIILow macrophage subsets in normal pancreas in (D). (F) Representative plots of (E). (G) Autochthonous KPC mice bearing premalignant disease (3.5-month-old) were lethally irradiated and adoptively transferred with bone marrow cells from CD45.1 mice. Tissues were analyzed for chimerism after 6 weeks, when disease had progressed to full PDAC. Relative CD45.1 and CD45.2 percentages analyzed by flow cytometry are depicted. (H) Quantitation of chimerism in MHCIIHi and MHCIILow TAMs in (G). (I) Tumor-naïve mice and orthotopic KPC tumor-bearing mice were treated with clodronate-loaded liposomes followed by i.v. injection of FITC-labeled beads. Tissue macrophages were analyzed for FITC signal by flow cytometry after 24 hours. (J) Representative flow cytometry plots of beads+ TAMs in orthotopic PDAC from (I). (K) MHCIIHi and MHCIILow composition of beads+ TAMs from (I). Data are shown as mean ± SEM and * denotes p<0.05 by t-test. Panels D–F and I–K are representatives of 2–3 independent experiments.
Figure 3
Figure 3. Tissue-Resident Macrophages Promote PDAC Progression
(A–D) KPC cells were orthotopically implanted into CCR2+/− and CCR2−/− mice. Tumors were processed on Day 12 for flow cytometry analysis. (A) Blood was drawn from orthotopic KPC-2-bearing mice via intracardiac puncture. Monocytes were assessed by flow cytometry (n=3–4/group). (B) Frequency of macrophages orthotopic KPC-2 tissues of CCR2+/− and CCR2−/− mice. (C) Frequency of MHCIIHi and Low TAM subsets assessed by flow cytometry in orthotopic KPC-2 tumors. Representative plots of TAM subsets are shown (n=3–4/group). (D) Wet weights of KPC-2 tumors in (B). (E–H) KPC-2 cells were orthotopically implanted into Nur77+/− and Nur77−/− mice. Tumors were processed on Day 13 for flow cytometry analysis (n=4/group normal, n=6–8/group of tumor bearing). (E) Blood was drawn from orthotopic PDAC-bearing mice via intracardiac puncture. Monocytes were quantified. (F) Quantity of macrophages in normal pancreas and orthotopic PDAC in Nur77+/− and Nur77−/− mice. (G) Representative plots of MHCIIHi and Low TAM subsets. (H) Wet weights of KPC-2 tumors in (F). (I–J) KPC-2-CBRLuc+ cells were orthotopically implanted into IgG/PBS- or αCSF1/clodronate-treated mice. Bioluminescence imaging (BLI) was used to measure tumor progression. Tumors were processed on Day 12 for flow cytometry and tumor burden analyses. (I) Scheme of pancreas-resident macrophage depletion followed by orthotopic PDAC of KPC-2-CBRLuc+ cells. Blood monocytes and pancreatic macrophage numbers before and after PDAC implantation are shown. (J) Tumor burden based on BLI and wet weight measurement. (K) 2.5-month-old KPC or 1.0-month-old KPPC mice were treated with αCSF1/clodronate. Tumor burden was analyzed at 4.5 or 2.0 month of age. Data are shown as mean ± SEM and * denotes p<0.05 by t-test or Mann-Whitney test. Panels A–D and E–H are representatives of 4 independent experiments each, while I–J is representative of 3.
Figure 4
Figure 4. Embryonically Derived Macrophages are Significant Components of Tissue-Resident TAMs and Expand During PDAC Progression
(A–C) KPC-1 cells were orthotopically implanted into Flt3-CreYFP mice. Indicated tissues were analyzed by flow cytometry for YFP expression. Representative flow cytometry plots of YFP signal in leukocytes from blood (A), macrophages from colon and brain (B), and macrophages in normal pancreas and end stage PDAC tissues (C) are depicted. (D) Quantitation of percentage of YFP-negativity in leukocytes from (A–C; n=7–22/group). (E) Kinetics of YFP-negative macrophages quantity and density in orthotopic KPC-1 tumors. (F) Representative immunofluorescence images of CD68 and YFP from (C). Inlets identify YFP-positive and YFP-negative macrophages. (G) Flt3-CreYFP reporter mice were treated with αCSF1R on E13.5. Pancreas was isolated at 6 weeks of age. Density of YFP-negative macrophages was quantified (n=3–5/group). (H) C57BL/6 mice were treated with αCSF1R or vehicle on E13.5. Orthotopic PDAC was established at 6 weeks of age. TAMs were quantified after 12 days (n=5–6/group). (I) Tumor burden from (H) was analyzed (n=6–9/group). Data are shown as mean ± SEM and * denotes p<0.05 by t-test. Panels A–C are pooled data from 3 experiments and G–I representative of two independent experiments.
Figure 5
Figure 5. Yolk Sac-Derived Macrophages Expand during PDAC Progression
(A) Representative flow cytometry plot of tdTomato signals in the normal pancreas and orthotopic KI tumors of adult mice upon E8.5 or E9.5 tamoxifen pulse. (B) Percentage of indicated leukocytes that were labeled upon E8.5 or E9.5 tamoxifen pulse (n=3–7/group). (C) Absolute numbers of tdTomato+ macrophages in the normal pancreas and orthotopic KI tumors (n=3–4/group). Data are shown as mean ± SEM and * denotes p<0.05 by t-test. Data represent 3 independent experiments.
Figure 6
Figure 6. Embryonically Derived Macrophages in PDAC Expand through in situ Proliferation
(A) Analysis of autochthonous KPC PDAC and normal pancreas tissues for BrdU+ macrophages. Animals were injected with BrdU 3 hours prior to sacrifice. Representative plots are shown. (B) Quantitation of BrdU incorporation in (A). (C) Representative immunofluorescence images of Ki67 and F4/80 staining in autochthonous KPC tumors. (D) Quantitation of flow cytometry data for Ki67 and BrdU positivity in macrophages in normal pancreas and orthotopic KPC-1 tumors (n=4–5/group and representative of two independent repeats). (E) Heat map of cell cycle genes assessed by array on RNA in macrophages isolated from normal pancreas and autochthonous KPC-1 tissues (n=6/group). (F) Orthotopic KPC-1 tumors were established in Flt3-CreYFP mice. Proliferation of TAM subsets was analyzed by flow cytometry for Ki67. (G) TAM subsets were sorted from orthotopic KPC-1 tumors in Flt3-CreYFP mice. Q-PCR analyses were performed to quantify transcripts of proliferation regulation genes. (H) Orthotopic KPC-1-bearing Flt3-CreYFP mice were treated with three doses of αCSF1 or αCSF2 on Days 7, 11, and 14. TAM subsets were quantified on Day 15. Data are shown as mean ± SEM and * denotes p<0.05 by t-test.
Figure 7
Figure 7. Embryonically Derived TAMs Have Distinct Phenotypes and Functions that are Recapitulated by Subsets of TAMs in Human PDAC
(A) Flow cytometry analysis of orthotopic KPC-1 PDAC tissues in Flt3-CreYFP mice stained with indicated antibodies and gated on TAMs (gray, isotype control; blue, YFP-negative TAMs; red YFP-positive TAMs). (B) YFP+ and YFP- macrophages were sorted from normal pancreas or late-stage orthotopic KPC-1 tumors of Flt3-CreYFP mice. RNA was extracted for microarray analyses. Hierarchical clustering of genes that were differentially expressed between macrophage subsets either in normal pancreas or PDAC is shown. (C) Gene ontogeny analyses of molecules expressed at higher levels in YFP- TAMs. (D–E) Q-PCR analyses of gene expression for molecules involved in ECM modification (D) or immune modulation (E). Analysis was performed on RNA from sorted YFP+ and (−) TAMs from Flt3-CreYFP mice bearing KCP-1 tumors (n=5/group). Genes were selected from the top candidates in (B). (F) Analysis of collagen production ex vivo by YFP+ and (−) TAMs sorted from orthotopic KPC-1 PDAC tissues in Flt3-CreYFP mice. Collagen laydown was assessed after 36 hours by immunofluorescence intensity. Experiments are representative of three independent repeats. (G) Orthotopic tumors were established in Flt3-CreYFP reporter mice using KPC-1-mCherry+ tumor cells. TAMs were analyzed for mCherry positivity. Representative flow plots and mean fluorescence intensity (MFI) are depicted (n=4/group). (H) Analysis of antigen presentation to CD8+ T cells by YFP+ and (−) TAMs sorted from Flt3-CreYFP mice bearing KPC-1 tumors. Antigen presentation was assessed by the ability of TAMs to activate OT1 cells after SIINFEKL loading and measured by CFSE-dilution and/or CD44+/CD69+/CD62L expression on T cells. Three independent sorting experiments are depicted as paired analyses. (I) Flow cytometry analysis of human PDAC tissues from surgical resections is depicted. The percentage of CXCR4+ TAMs of total is shown for nine patients. (J) Analysis of HLA-DR expression in CXCR4-positive and negative TAMs using data from (I). A representative flow plot and MFI analysis in paired samples are depicted. (K) Q-PCR analysis of mRNA from CXCR4-positive and negative TAMs sorted from human PDAC tissues. Pro-fibrotic genes assessed were identified in (B), and analysis of paired isolates from three patients is depicted. All graphs depict mean values +/− SEM and * denotes p<0.05 by t-test, Mann-Whitney test, or Wilcoxon matched pairs rank test as appropriate for the data set.

Comment in

References

    1. Afik R, Zigmond E, Vugman M, Klepfish M, Shimshoni E, Pasmanik-Chor M, Shenoy A, Bassat E, Halpern Z, Geiger T, et al. Tumor macrophages are pivotal constructors of tumor collagenous matrix. J Exp Med. 2016;213:2315–2331. - PMC - PubMed
    1. Bain CC, Bravo-Blas A, Scott CL, Gomez Perdiguero E, Geissmann F, Henri S, Malissen B, Osborne LC, Artis D, Mowat AM. Constant replenishment from circulating monocytes maintains the macrophage pool in the intestine of adult mice. Nat Immunol. 2014;15:929–937. - PMC - PubMed
    1. Bain CC, Hawley CA, Garner H, Scott CL, Schridde A, Steers NJ, Mack M, Joshi A, Guilliams M, Mowat AM, et al. Long-lived self-renewing bone marrow-derived macrophages displace embryo-derived cells to inhabit adult serous cavities. Nat Commun. 2016;7:ncomms11852. - PMC - PubMed
    1. Beatty GL, Winograd R, Evans RA, Long KB, Luque SL, Lee JW, Clendenin C, Gladney WL, Knoblock DM, Guirnalda PD, et al. Exclusion of T Cells From Pancreatic Carcinomas in Mice Is Regulated by Ly6C(low) F4/80(+) Extratumoral Macrophages. Gastroenterology. 2015;149:201–210. - PMC - PubMed
    1. Bleriot C, Dupuis T, Jouvion G, Eberl G, Disson O, Lecuit M. Liver-resident macrophage necroptosis orchestrates type 1 microbicidal inflammation and type-2-mediated tissue repair during bacterial infection. Immunity. 2015;42:145–158. - PubMed

Publication types

MeSH terms