. 2017 Aug 15;20(7):1654-1666.
doi: 10.1016/j.celrep.2017.07.054.

Pharmacologic or Genetic Targeting of Glutamine Synthetase Skews Macrophages toward an M1-like Phenotype and Inhibits Tumor Metastasis

Affiliations

Pharmacologic or Genetic Targeting of Glutamine Synthetase Skews Macrophages toward an M1-like Phenotype and Inhibits Tumor Metastasis

Erika M Palmieri et al. Cell Rep. .

Abstract

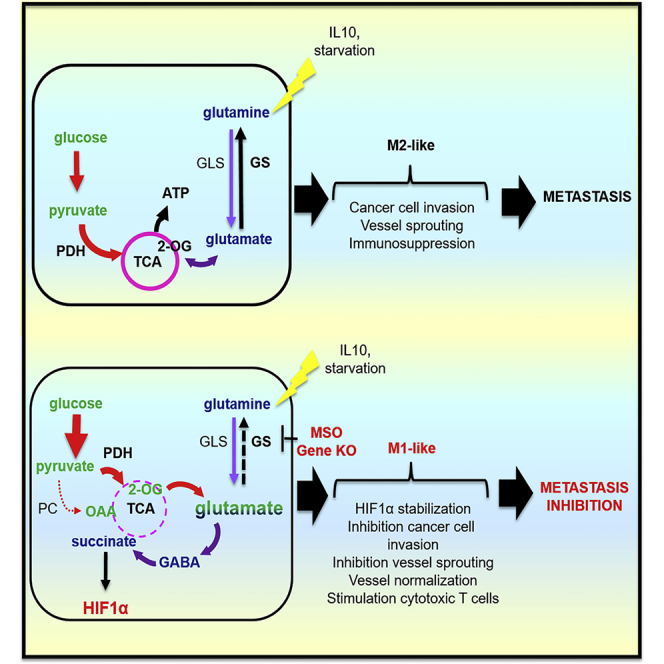
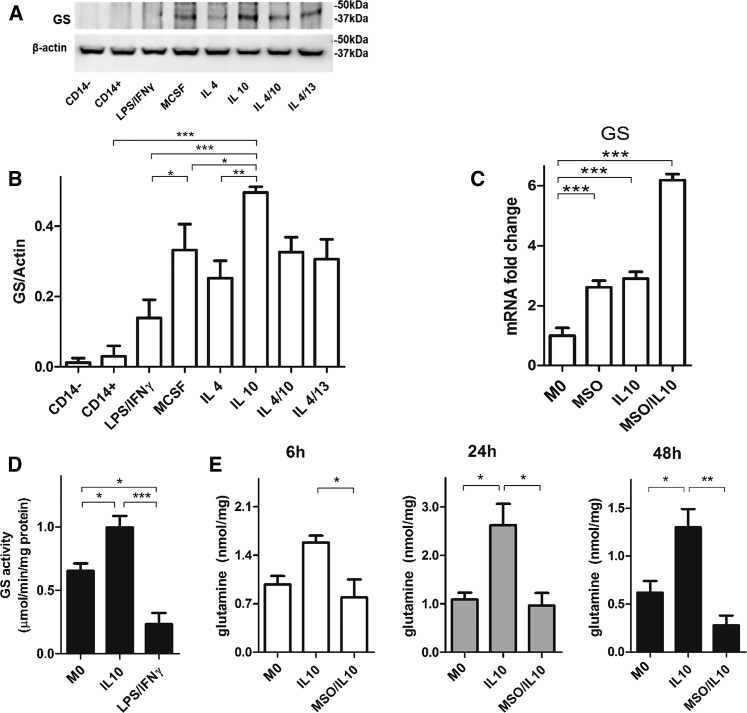
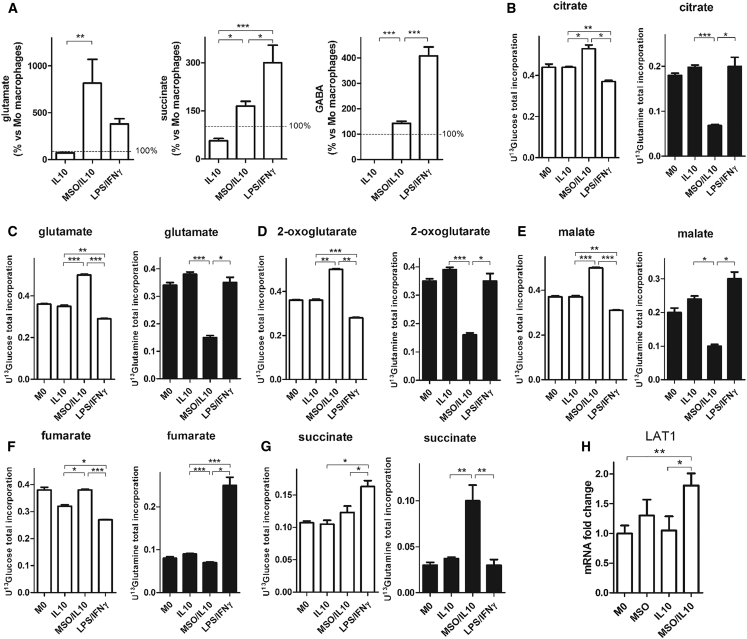
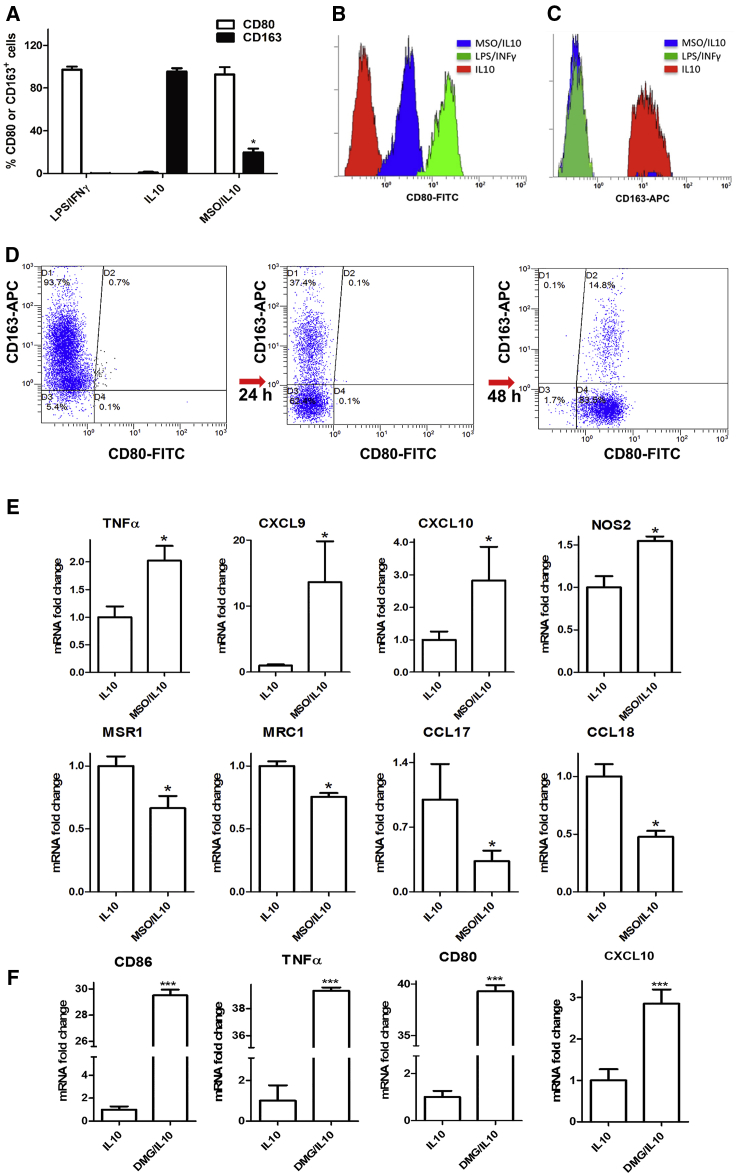
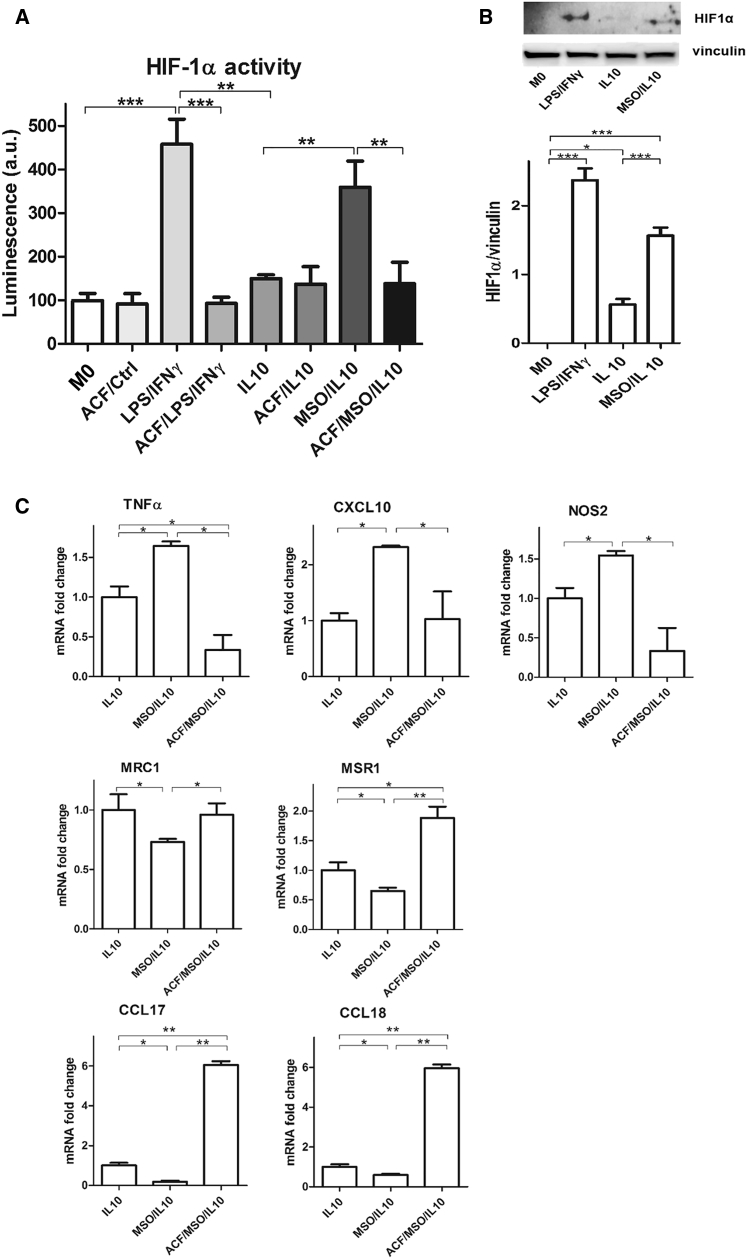
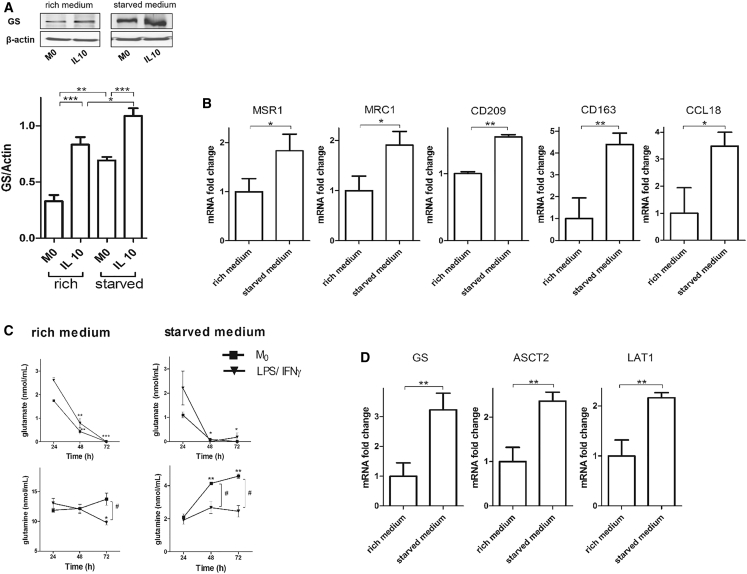
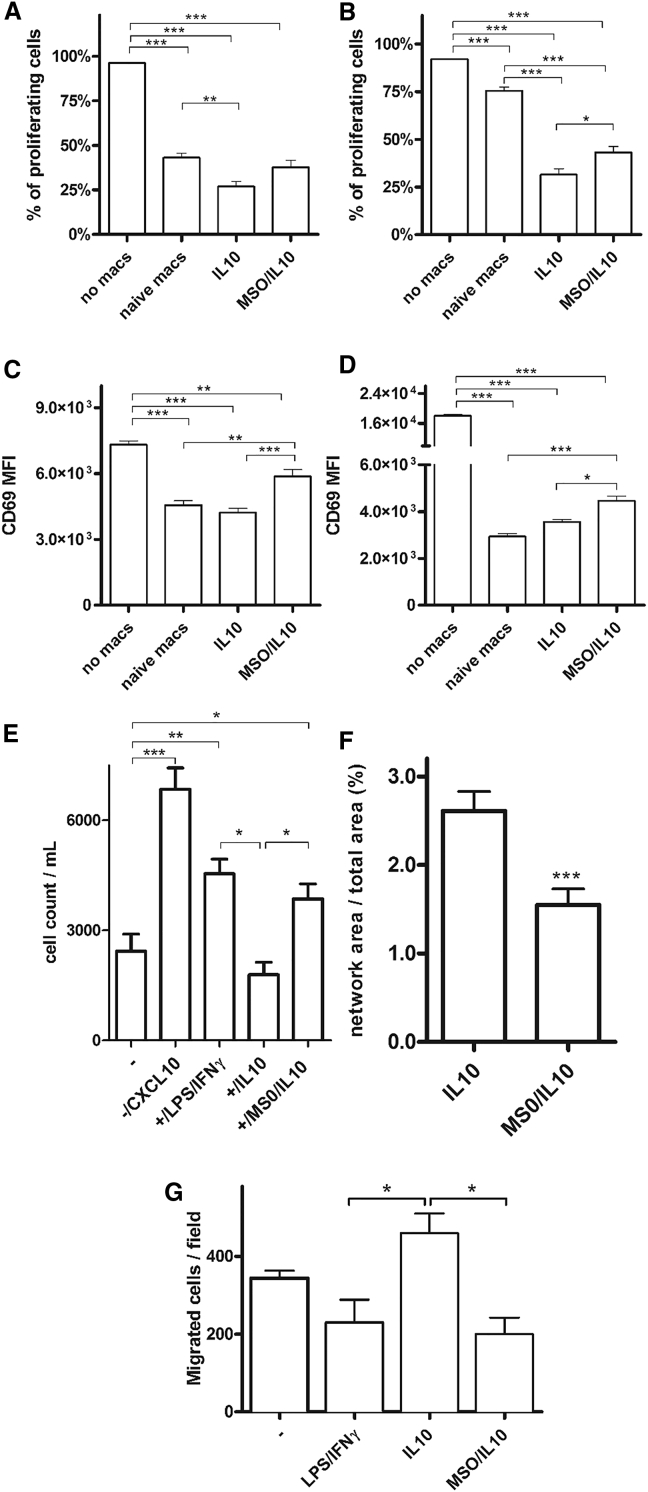
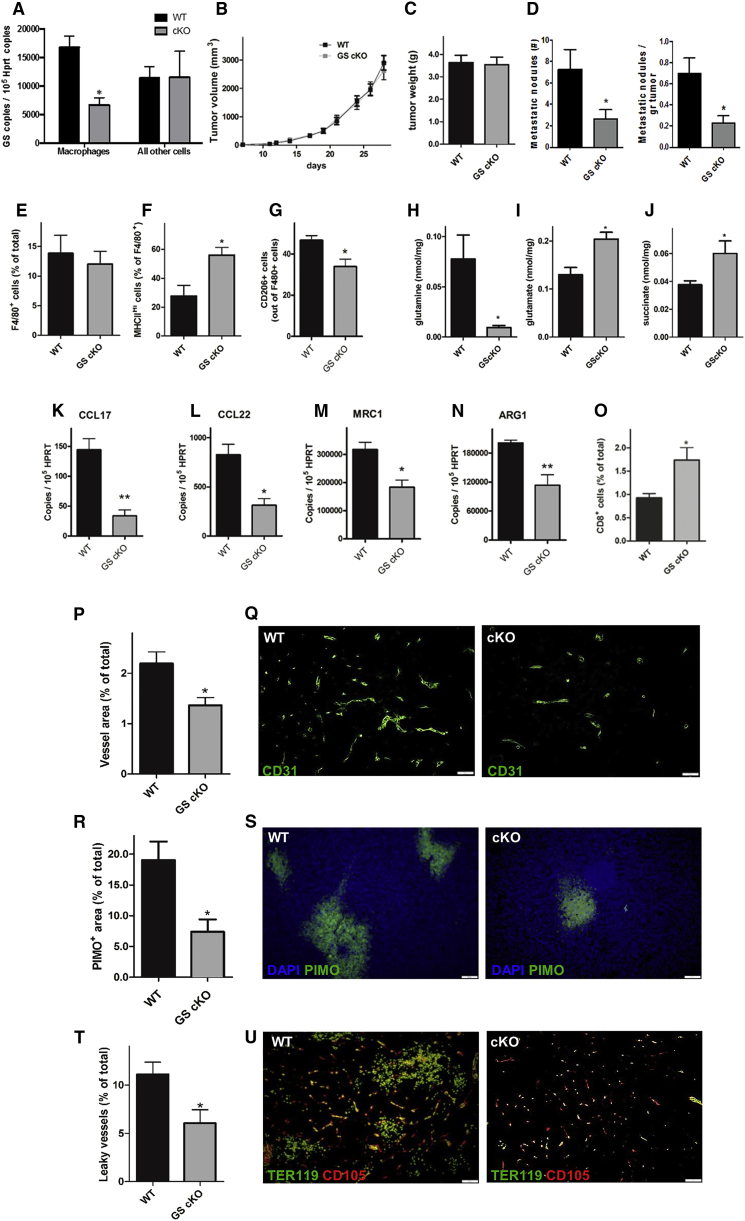
Glutamine-synthetase (GS), the glutamine-synthesizing enzyme from glutamate, controls important events, including the release of inflammatory mediators, mammalian target of rapamycin (mTOR) activation, and autophagy. However, its role in macrophages remains elusive. We report that pharmacologic inhibition of GS skews M2-polarized macrophages toward the M1-like phenotype, characterized by reduced intracellular glutamine and increased succinate with enhanced glucose flux through glycolysis, which could be partly related to HIF1α activation. As a result of these metabolic changes and HIF1α accumulation, GS-inhibited macrophages display an increased capacity to induce T cell recruitment, reduced T cell suppressive potential, and an impaired ability to foster endothelial cell branching or cancer cell motility. Genetic deletion of macrophagic GS in tumor-bearing mice promotes tumor vessel pruning, vascular normalization, accumulation of cytotoxic T cells, and metastasis inhibition. These data identify GS activity as mediator of the proangiogenic, immunosuppressive, and pro-metastatic function of M2-like macrophages and highlight the possibility of targeting this enzyme in the treatment of cancer metastasis.

Keywords: HIF1α; IL-10; glutamine; glutamine synthetase; macrophages; metabolic rewiring; metastasis; starvation; succinate.


Figures

None
Graphical abstract
Figure 1
Figure 1
IL-10 Macrophages Display GS Expression and Activity (A and B) GS and β-actin immunoblot (A) and densitometric levels (B) in human CD14, CD14+ cells (monocytes), resting (M0, macrophage colony stimulating factor [MCSF]), and differently polarized monocytes-derived macrophages (LPS/IFNγ, IL-4, IL-10, IL-13, and a combination of those, with M-CSF) following 24 hr of activation (n = 3). (C) GS expression levels in resting M0, IL-10, and MSO/IL-10 macrophages following 16 hr of activation with and without 2 hr of pre-incubation with MSO (n = 3). (D) GS protein activity levels in resting (M0), LPS/IFNγ, and IL-10 macrophages following 24 hr of activation (n = 4). (E) LC-MS/MS quantification of intracellular glutamine in resting (M0), IL-10, and MSO-treated IL-10 6, 24, and 48 hr after treatment (n = 4). Data are means ± SEM. Western blots are representative of 3 independent experiments. p < 0.05, ∗∗p < 0.001, ∗∗∗p < 0.0001.
Figure 2
Figure 2
GS Inhibition Modifies Metabolite Levels in IL-10 versus LPS/IFNγ Macrophages (A) Evaluation of glutamate, GABA, and succinate in IL-10, MSO/IL-10, and LPS/IFNγ versus resting (ctrl, 100%) macrophages (n = 6) following 24 hr of activation. (B–G) Evaluation of the [U-13C]-glutamine-derived (right) and [U-13C]-glucose-derived (left) carbon incorporation levels into the TCA intermediates citrate (B), glutamate (C), 2 oxoglutarate (D), malate (E), fumarate (F), and succinate (G) in resting (M0), IL-10, and MSO-treated IL-10 versus LPS/IFNγ macrophages following 24 hr of activation (n = 4). (H) LAT1 expression levels in resting M0, IL-10, and MSO/IL-10 macrophages following 16 hr of activation with and without previous MSO addition (n = 3). Data are means ± SEM. p < 0.05, ∗∗p < 0.001, ∗∗∗p < 0.0001.
Figure 3
Figure 3
GS Inhibition Modifies Polarization of IL-10 Macrophages (A) Flow cytometric quantification of the percentage of CD80+ and CD163+ cells after IL-10 treatment in the absence or presence of MSO versus LPS/IFNγ treatment following 24 hr of activation (n = 4). (B and C) FACS quantification of CD80 (B) and CD163 (C) levels in IL-10 and MSO-treated IL-10 versus LPS/IFNγ macrophages as above. (D) FACS dot plots depicting CD80 and CD163 modulation following MSO treatment in IL-10 macrophages. (E) qRT-PCR quantification of M1 or M2 markers in macrophages. Top: fold increase of TNF-α, CXCL9, CXCL10, and NOS2 mRNA in IL-10 and MSO-treated IL-10 (n = 3). Bottom: fold reduction of MSR1, MRC1, CCL17, and CCL18 mRNA in IL-10 and MSO-treated IL-10 macrophages following 24 hr of activation with and without previous MSO addition (n = 3). (F) qRT-PCR quantification of M1 markers in macrophages with DMG. Shown is the fold increase of CD86, TNF-α, CD80, and CXCL10 mRNA in IL-10 macrophages with and without 2 hr of pre-incubation with 5 mM DMG. Data are means ± SEM. p < 0.05. ∗∗∗p < 0.0001.
Figure 4
Figure 4
GS Inhibition Stabilizes HIF1α Activity (A) Evaluation of HIF1α transcriptional activity in resting (M0) and IL-10 versus LPS/IFNγ macrophages after 16 hr of stimulation with and/or without previous MSO and acriflavine (ACF) addition (n = 3). (B) Western blotting and densitometric analysis of HIF1α protein in M0, IL-10, and MSO-treated IL-10 versus LPS/IFNγ macrophages after 16 hr of stimulation (n = 3). (C) qRT-PCR quantification of M1 or M2 markers in macrophages following HIF1α inhibition. Top: fold change of TNF-α, NOS2, and CXCL10 mRNA in IL-10 stimulated macrophages with and/or without previous MSO and ACF addition (n = 3). Bottom: fold change of MSR1, MRC1, CCL17, and CCL18 mRNA levels in macrophages as above (n = 3). Data are means ± SEM. p < 0.05, ∗∗∗p < 0.0001.
Figure 5
Figure 5
Starvation Enhances GS Expression in IL-10-Polarized Macrophages (A) Western blotting and densitometric analysis of GS in resting (M0) and IL-10-treated macrophages in rich and starved medium after 60 hr of culture. Shown are representative lanes of the same western blot run and exposure. Data are means ± SEM. p < 0.05, ∗∗p < 0.001 versus M0. (B) qRT-PCR quantification of M2 markers under starved conditions. Shown are fold changes of MSR1, MRC1, CD209, CD163, and CCL18 mRNA in M0 macrophages in rich versus starved medium after 36 hr of culture (n = 3). (C) Extracellular levels of glutamate and glutamine in rich and starved medium. Shown is quantification of glutamate and glutamine at 24, 48, and 72 hr of starvation (n = 3). Data are means ± SEM. p < 0.05, ∗∗p < 0.001, ∗∗∗p < 0.0001 in 72-hr- compared with 24-hr-starved cells. #p < 0.05 in M0 versus LPS/IFNγ-treated cells. (D) qRT-PCR quantification of GS and the glutamine transporters under rich and starved conditions. Shown are fold changes of GS, ASCT2, and LAT1 mRNA in M0 macrophages in rich versus starved medium after 36 hr of culture (n = 3). Where not indicated otherwise, data are means ± SEM. p < 0.05, ∗∗p < 0.001.
Figure 6
Figure 6
GS Targeting in Macrophages Prevents T Cell Suppression and Inhibits Endothelial Capillary Network Formation (A and B) T cells labeled with cell trace violet (CTV) were stimulated with or without autologous macrophages in different ways. Five days later, the percentage of CTV-low cells, measured by flow cytometry, was used as a measure of CD4+ (A) and CD8+ (B) proliferation (n = 4). (C and D) Evaluation of CD69 protein, expressed as mean fluorescence intensity (MFI), was determined by flow cytometry on the surface of responder CD4+ (C) and CD8+ T cells (D) after coculture with or without macrophages (n = 3). (E) CD8+ T cell recruitment by IL-10 and MSO-treated IL-10 macrophages versus LPS/IFNγ macrophages; the migration of T cells cultured without macrophages (−) in the presence of CXCL10 was used as a positive ctrl (n = 2). (F) Quantification of the endothelial capillary network in the presence of macrophages pretreated for 24 hr with IL-10 or MSO/IL-10 after 4 hr of incubation with HUVEC cells (n = 8). (G) Evaluation of cancer cell migration through a Matrigel-coated micropore filter in the absence (−) or presence of LPS/IFNγ, IL-10, and MSO/IL-10 prestimulated macrophages after 24 hr of incubation (n = 6). Data are means ± SEM. p < 0.05, ∗∗p < 0.001, ∗∗∗p < 0.0001 versus IL-10.
Figure 7
Figure 7
Genetic Deletion of GS in TAMs Induces an M1-like Phenotype and CTL Accumulation, Inhibits Metastasis, and Induces Vessel Normalization (A) Efficiency and specificity of genetic deletion in cKO mice measured by qRT-PCR on GS mRNA in F4/80+ macrophages and F4/80 splenocytes, freshly sorted after 5-day in vivo treatment with tamoxifen (n = 3). (B and C) Subcutaneous LLC tumor growth over time (B) and end-stage tumor weight (C) in wild-type (WT) and macrophage-specific knockout (cKO) mice (pool of 3 independent experiments, total n = 25). (D) Number of lung metastases and lung metastatic index (the number of lung metastatic nodules divided by the corresponding tumor weight) in WT and macrophage-specific knockout (cKO) mice (pool of 3 independent experiments, total n = 25). (E–G) FACS quantification of total F4/80+ TAMs (E), M1-like MHC class IIhigh TAMs (F), and CD206-positive TAMs (G) in WT and macrophage-specific knockout (cKO) mice (n = 4). (H–J) Evaluation of glutamine (H), glutamate (I), and succinate (J) in WT and macrophage-specific knockout (cKO) mice (n = 4). (K–N) qRT-PCR quantification of CCL17 (K), CCL22 (L), MRC1 (M), AND ARG1 (N) in WT and macrophage-specific knockout (cKO) mice (n = 4). (O) FACS quantification of CD8+ cytotoxic T cells in WT and macrophage-specific knockout (cKO) mice (n = 4). (P and Q) Quantification (P) and representative images (Q) of the CD31+ tumor vessel area in WT and macrophage-specific knockout (cKO) mice (n = 8). The vessel area was calculated by the percentage of CD31 area per field. (R and S) Quantification (R) and representative images (S) of pimonidazole (PIMO)+ tumor hypoxic areas in WT and macrophage-specific knockout (cKO) mice (n = 8). (T and U) Quantification (T) and representative images (U) of leaky vessels in WT and macrophage-specific knockout (cKO) mice, measured as the percentage of endoglin/CD105+ vessels surrounded by lakes of TER119+ red blood cells over the total number of vessels (n = 8). In each immunofluorescence quantification, n represents the number of animals. Six images per tumor were analyzed. Scale bars, 100 μm. All graphs show mean ± SEM. p < 0.05 versus the WT. See also Figures S1 and S2.

References

    1. Barik S., Banerjee S., Mallick A., Goswami K.K., Roy S., Bose A., Baral R. Normalization of tumor microenvironment by neem leaf glycoprotein potentiates effector T cell functions and therapeutically intervenes in the growth of mouse sarcoma. PLoS ONE. 2013;8:e66501. - PMC - PubMed
    1. Biswas S.K., Mantovani A. Macrophage plasticity and interaction with lymphocyte subsets: cancer as a paradigm. Nat. Immunol. 2010;11:889–896. - PubMed
    1. Butterworth R.F. Hepatic encephalopathy. Alcohol Res. Health. 2003;27:240–246. - PMC - PubMed
    1. Casanovas O., Hicklin D.J., Bergers G., Hanahan D. Drug resistance by evasion of antiangiogenic targeting of VEGF signaling in late-stage pancreatic islet tumors. Cancer Cell. 2005;8:299–309. - PubMed
    1. Casazza A., Laoui D., Wenes M., Rizzolio S., Bassani N., Mambretti M., Deschoemaeker S., Van Ginderachter J.A., Tamagnone L., Mazzone M. Impeding macrophage entry into hypoxic tumor areas by Sema3A/Nrp1 signaling blockade inhibits angiogenesis and restores antitumor immunity. Cancer Cell. 2013;24:695–709. - PubMed

Publication types

MeSH terms