. 2017 Aug 15;20(7):1705-1716.
doi: 10.1016/j.celrep.2017.07.062.

Antibiotics Disrupt Coordination between Transcriptional and Phenotypic Stress Responses in Pathogenic Bacteria

Affiliations

Antibiotics Disrupt Coordination between Transcriptional and Phenotypic Stress Responses in Pathogenic Bacteria

Paul A Jensen et al. Cell Rep. .

Abstract

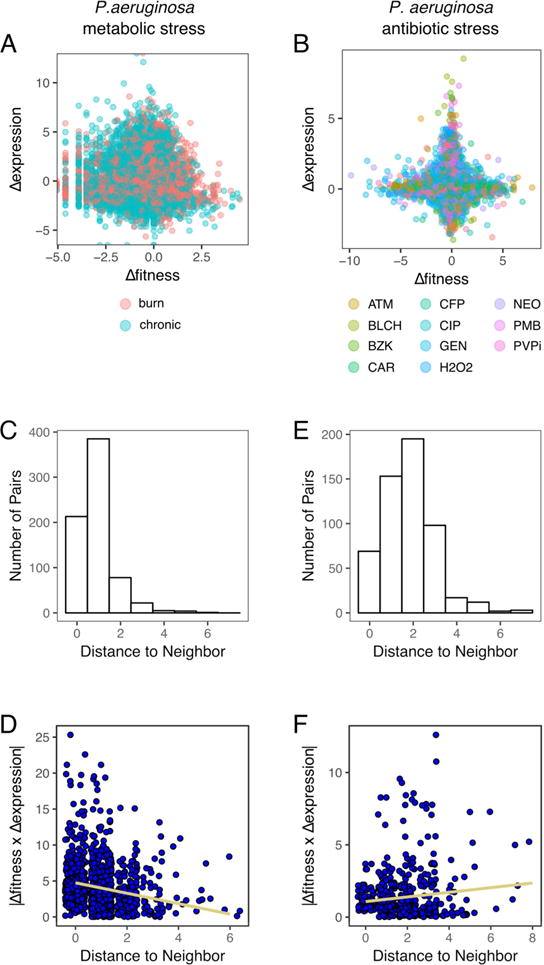
Bacterial genes that change in expression upon environmental disturbance have commonly been seen as those that must also phenotypically matter. However, several studies suggest that differentially expressed genes are rarely phenotypically important. We demonstrate, for Gram-positive and Gram-negative bacteria, that these seemingly uncoordinated gene sets are involved in responses that can be linked through topological network analysis. However, the level of coordination is stress dependent. While a well-coordinated response is triggered in response to nutrient stress, antibiotics trigger an uncoordinated response in which transcriptionally and phenotypically important genes are neither linked spatially nor in their magnitude. Moreover, a gene expression meta-analysis reveals that genes with large fitness changes during stress have low transcriptional variation across hundreds of other conditions, and vice versa. Our work suggests that cellular responses can be understood through network models that incorporate regulatory and genetic relationships, which could aid drug target predictions and genetic network engineering.

Keywords: Pseudomonas; RNA-seq; Streptococcus; Tn-seq; data integration; metabolic modeling; stress response; systems biology.


Conflict of interest statement

The authors declare that they have no competing interests.

Figures

Figure 1
Figure 1
High-resolution profiles of gene expression and fitness responses during stress incurred by nutrient depletion. Fitness values from Tn-Seq and transcript abundance from RNA-Seq were measured for three S. pneumoniae strains (19F, T4, and D39) and in three media conditions (SDMM, CDM, and MCDM). A. By plotting Tn-Seq and RNA-Seq data on the same graph it becomes clear that genes with a significant fitness defect (see methods for significance determination, but fitness (W) is at least < 0.85) are highly expressed. With relatively few exceptions, genes important for growth in an environment are maintained at high transcript abundance. Of the few genes with fitness defects and low expression, most have unknown function (indicated by a triangle). The low-fitness, low-expression genes with known functions (indicated by a circle) include metabolic enzymes such as: a.) SP1296/SPT0930, chorismate mutase; b.) SP0313, glutathione peroxidase; and c.) SPD1663, trehalose-6-phosphate hydrolase. B. A strong correlation between Tn-Seq fitness and fitness calculated from individual mutant growth curves or 1×1 competitions (Wvalidation; n = 122; shown are mean ± SEM; linear fit yields R2 > 0.82) emphasizes that the profiles are composed of high-confidence Tn-Seq data. (NB. RNA-Seq validation is shown in Table S5.)
Figure 2
Figure 2
Changes in fitness and expression occur across all strains, media, and cellular subsystems. A. Δfitness (ΔW) depicts how genes change their fitness as a strain transitions from rich media (SDMM) to defined (CDM) or minimal (MCDM) media. B. Shown are how genes change their expression as a strain transitions from rich media (SDMM) to defined (CDM) or minimal (MCDM) media. Expression is log2 fold change in transcript abundance from RNA-Seq. In both figures statistically significant changes are colored and both assays were performed on three S. pneumoniae strains (T4, 19F, and D39) and two media transitions (SDMM→CDM, SDMM→MCDM). C. S. pneumoniae genes were classified into one of sixteen categories based on the strain’s genome annotation. Percentage of genes in each category with significant changes are shown in fitness (red) and expression (green). For the total number of genes in each category (by strain), see Table S2.
Figure 3
Figure 3
Genes with significant changes in expression (green), fitness (red), or both (blue) are distributed throughout the iSP16 metabolic model. Lines indicate reactions connecting metabolites (circles). Minor and currency metabolites are not shown (see Supplemental Experimental Procedures). Reactions are colored based on gene associations in the iSP16 model. A. Changes caused by a media shift from semi-defined (SDMM) to defined (CDM) media. B. Changes caused by a media shift from defined (CDM) to minimal (MCDM) media. Highlighted boxes denote pathways featured in subpanels of Figure 4.
Figure 4
Figure 4
Individual pathways are partitioned into sub-pathways with either fitness or expression changes. A. Changes in gene expression and fitness are separated in the tryptophan biosynthesis branch of the shikimate pathway. Single and double-headed arrows indicate reversibility or non-reversibility of individual chemical reactions, respectively, while arrows spanning two genes indicate enzymatic subunits catalyzing the same reaction. The dashed blue line (between SP1374 and SP1816) indicates the branch point into tryptophan biosynthesis. The opposite pattern appears in the riboflavin pathway (B), where expression changes lie upstream of two reactions catalyzed by an essential gene (SP1110). PEP = phosphoenol-pyruvate, E4P = D-erythrose-4-phosphate, Trp = L-tryptophan. Genes with statistically significant changes in fitness or expression are highlighted in red.
Figure 5
Figure 5
Fitness and expression changes do not occur on the same gene but are co-localized in a stress-dependent manner. A. When plotting changes in gene expression (RNA-Seq: Δexpression) vs. changes in fitness (Tn-Seq: Δfitness (ΔW)), genes with only fitness changes appear along the horizontal axis (red dot); genes with only expression changes appear along the vertical axis (green dot); and genes with both fitness and expression changes appear away from both axes (blue dot). B. Expression vs. fitness changes for S. pneumoniae during nutrient depletion. For each data point (gene) Δfitness (ΔW) and Δexpression are plotted depicting how a gene’s fitness and expression change as a strain transitions from rich media (SDMM) to defined (CDM) or minimal (MCDM) media. C. Metabolic models can be used to quantify distances between reactions and genes. For instance, the distance between the subunits pgmA and pgmB in glycolysis is zero, while either enzyme has a distance one to eno and a distance two to pyk. D. Pairs of PIGs and TIGs are separated by short distances during nutrient stress. E. To identify pairs of genes with both large Δfitness and Δexpression, the magnitude of the fitness change is multiplied by the magnitude of the nearest expression change. The product (blue box) is maximized when both the fitness and expression changes are large. If either Δexpression or Δfitness is small, the product is also small (F). G. The product Δexpression• Δfitness decays with distance between the gene and its nearest neighbor, indicating that changes are closely located within the network and that the largest changes in fitness are close to the largest expression changes. H. During antibiotic stress, Δexpression and Δfitness are uncorrelated similar to nutrient depletion stress. However, the coordination between Δexpression and Δfitness is lost; i.e. pairs of PIGs and TIGs are farther apart (I), and the largest PIGs with the largest fitness changes are no longer closest to the TIGs with the largest expression changes (J). Thus, metabolic transcriptional and phenotypic stress responses appear coordinated during nutrient stress, but uncoordinated during antibiotic stress.
Figure 6
Figure 6
Pseudomonas aeruginosa confirms patterns found in S. pneumoniae. No correlation exists between fitness and expression changes during metabolic (A) or antibiotic (B) stress. Paring PIGs and TIGs in the metabolic stress data indicate that the largest phenotypic and transcriptional changes are nearby (C,E); however, just as for S. pneumoniae, the PIGs and TIGs move farther apart during antibiotic stress (D), and the largest fitness and expression changes are no longer adjacent (F).
Figure 7
Figure 7
Meta-analysis shows that essential and phenotypically important genes are shielded from large changes in expression. A. Quantifying gene expression plasticity using meta-analysis of GEO expression studies. Plasticity is the normalized variance in gene expression across all S. pneumoniae or P. aeruginosa data in GEO (see Supplemental Experimental Procedures), which means that genes that change often in expression have a high plasticity while genes that almost never change have a low plasticity. B. Gene expression plasticity decreases with increasing magnitude of the fitness change (relative to SDMM). Thus the amount of shielding is proportional to a gene’s phenotypic importance, and genes with the largest fitness changes show the smallest variation in expression across the experiments in GEO. C. Gene expression plasticity is significantly lower for essential genes (p < 10−14) and conditionally essential genes (genes with a significant fitness change) (p < 10−34, both comparisons t-test on lognormal distributions; log-normality confirmed by Shapiro-Wilke test with p < 10−12). Both the essential and conditionally essential genes appear to be shielded from transcriptional changes not only in our RNA-Seq data, but across all the expression datasets in GEO. D. In P. aeruginosa, genes with fitness changes also show decreased plasticity, and, similar to S. pneumoniae, (conditionally) essential genes appear to be shielded from transcriptional changes across all the expression datasets in GEO (E).

References

    1. Aaberge IS, Eng J, Lermark G, Løvik M. Virulence of Streptococcus pneumoniae in mice: a standardized method for preparation and frozen storage of the experimental bacterial inoculum. Microbial Pathogenesis. 1995;18:141–152. - PubMed
    1. Bao H, Kommadath A, Liang G, Sun X, Arantes AS, Tuggle CK, Bearson SMD, Plastow GS, Stothard P, Guan LL. Genome-wide whole blood microRNAome and transcriptome analyses reveal miRNA-mRNA regulated host response to foodborne pathogen Salmonella infection in swine. Sci Rep. 2015;5:e12620. - PMC - PubMed
    1. Bartell JA, Blazier AS, Yen P, Thogersen JC, Jelsbak L, Goldberg JB, Papin JA. Reconstruction of the metabolic network of Pseudomonas aeruginosa to interrogate virulence factor synthesis. Nat Commun. 2017;8:14631. - PMC - PubMed
    1. Belenky P, Ye JD, Porter CB, Cohen NR, Lobritz MA, Ferrante T, Jain S, Korry BJ, Schwarz EG, Walker GC, Collins JJ. Bactericidal antibiotics induce toxic metabolic perturbations that lead to cellular damage. Cell Rep. 2015;13:968–980. - PMC - PubMed
    1. Birrell GW, Brown JA, Wu HI, Giaever G, Chu AM, Davis RW, Brown JM. Transcriptional response of Saccharomyces cerevisiae to DNA-damaging agents does not identify the genes that protect against these agents. PNAS. 2002;99:8778–8783. - PMC - PubMed

MeSH terms