. 2017 Oct 13;91(21):e01248-17.
doi: 10.1128/JVI.01248-17. Print 2017 Nov 1.

HIV Fusion in Dendritic Cells Occurs Mainly at the Surface and Is Limited by Low CD4 Levels

Affiliations

HIV Fusion in Dendritic Cells Occurs Mainly at the Surface and Is Limited by Low CD4 Levels

Lise Chauveau et al. J Virol. .

Abstract

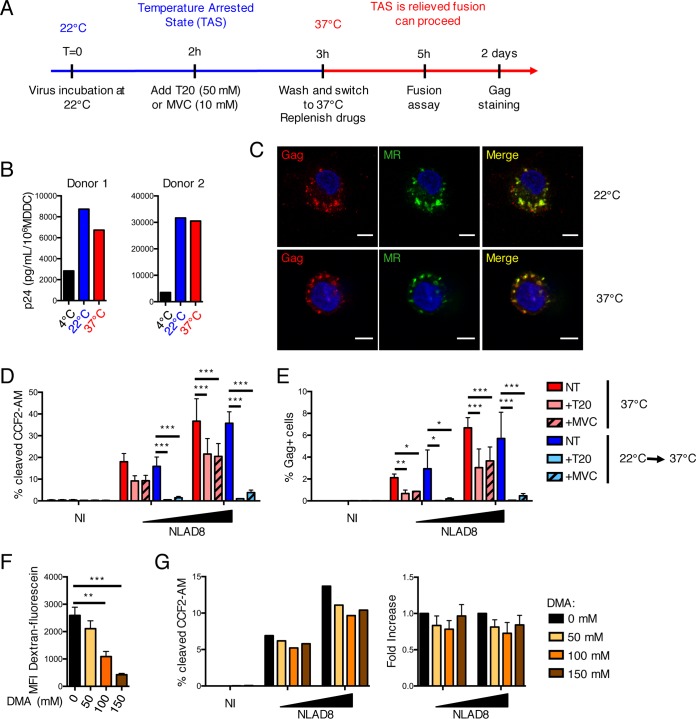
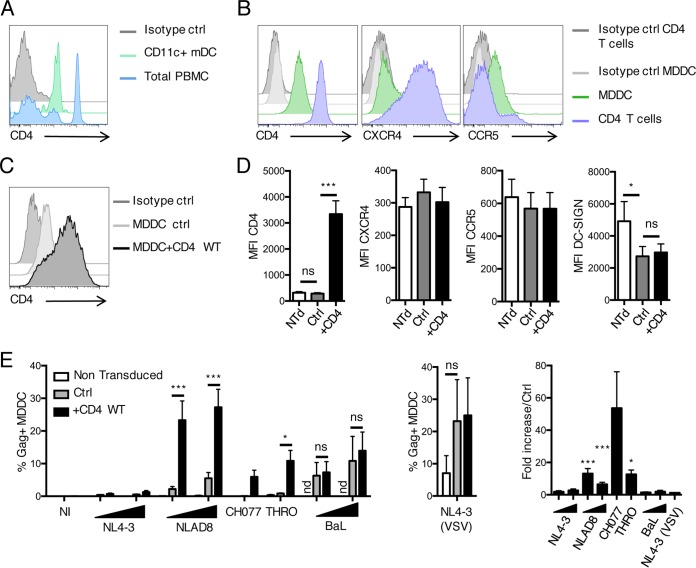
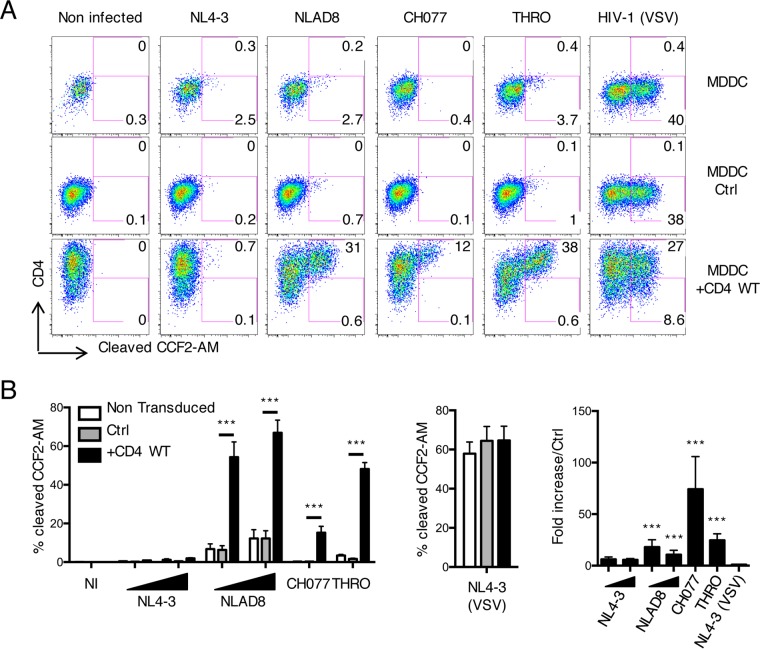
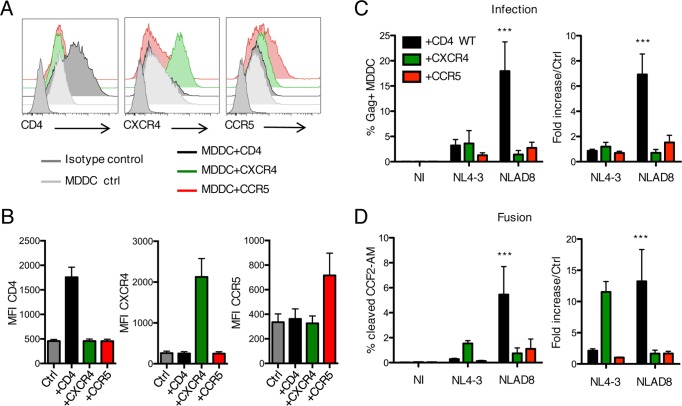
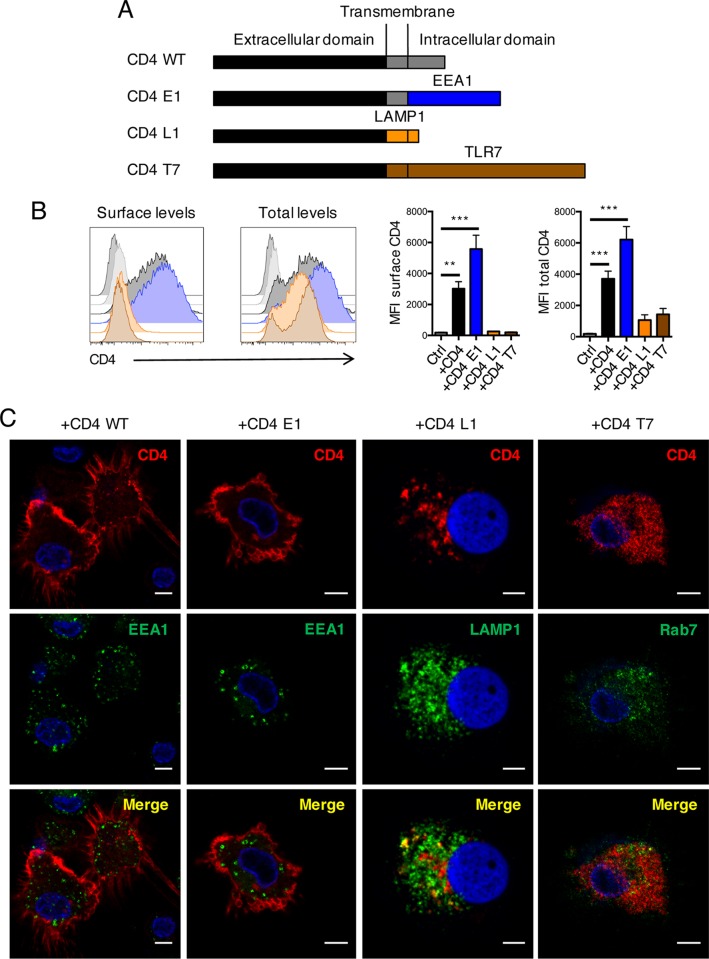
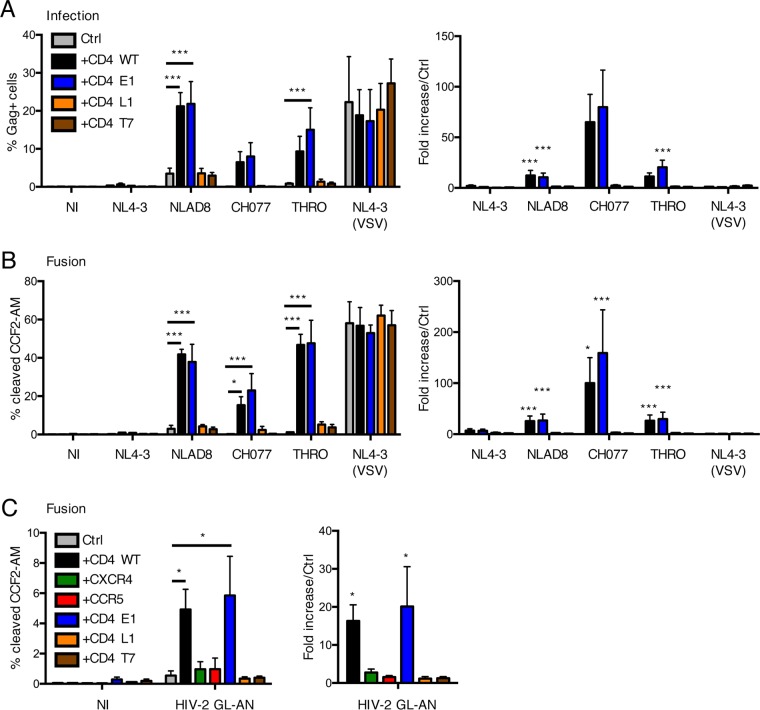
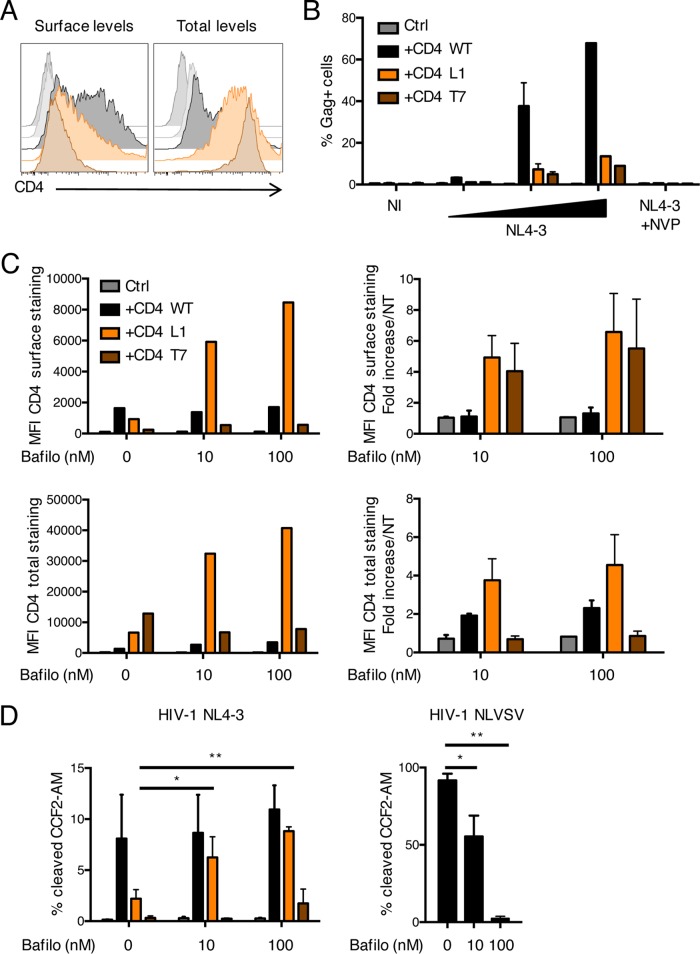
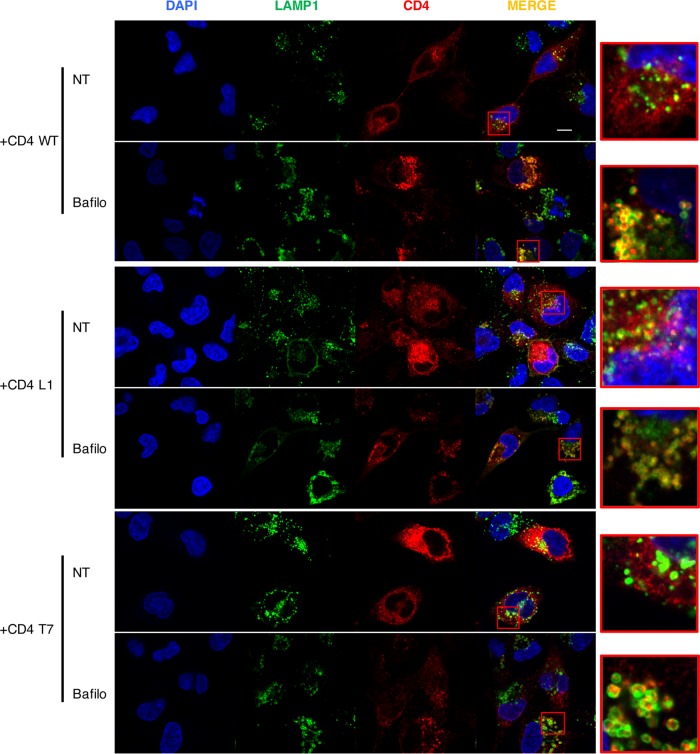
HIV-1 poorly infects monocyte-derived dendritic cells (MDDCs). This is in large part due to SAMHD1, which restricts viral reverse transcription. Pseudotyping HIV-1 with vesicular stomatitis virus G protein (VSV-G) strongly enhances infection, suggesting that earlier steps of viral replication, including fusion, are also inefficient in MDDCs. The site of HIV-1 fusion remains controversial and may depend on the cell type, with reports indicating that it occurs at the plasma membrane or, conversely, in an endocytic compartment. Here, we examined the pathways of HIV-1 entry in MDDCs. Using a combination of temperature shift and fusion inhibitors, we show that HIV-1 fusion mainly occurs at the cell surface. We then asked whether surface levels or intracellular localization of CD4 modulates HIV-1 entry. Increasing CD4 levels strongly enhanced fusion and infection with various HIV-1 isolates, including reference and transmitted/founder strains, but not with BaL, which uses low CD4 levels for entry. Overexpressing coreceptors did not facilitate viral infection. To further study the localization of fusion events, we generated CD4 mutants carrying heterologous cytoplasmic tails (LAMP1 or Toll-like receptor 7 [TLR7]) to redirect the molecule to intracellular compartments. The intracellular CD4 mutants did not facilitate HIV-1 fusion and replication in MDDCs. Fusion of an HIV-2 isolate with MDDCs was also enhanced by increasing surface CD4 levels. Our results demonstrate that MDDCs are inefficiently infected by various HIV-1 and HIV-2 strains, in part because of low CD4 levels. In these cells, viral fusion occurs mainly at the surface, and probably not after internalization.IMPORTANCE Dendritic cells (DCs) are professional antigen-presenting cells inducing innate and adaptive immune responses. DCs express the HIV receptor CD4 and are potential target cells for HIV. There is debate about the sensitivity of DCs to productive HIV-1 and HIV-2 infection. The fusion step of the viral replication cycle is inefficient in DCs, and the underlying mechanisms are poorly characterized. We show that increasing the levels of CD4 at the plasma membrane allows more HIV fusion and productive infection in DCs. We further demonstrate that HIV fusion occurs mainly at the cell surface and not in an intracellular compartment. Our results help us understand why DCs are poorly sensitive to HIV infection.

Keywords: dendritic cells; human immunodeficiency virus; virus entry.


Figures

FIG 1
FIG 1
HIV-1 NLAD8 fusion occurs at the cell surface in MDDCs. (A) Experimental outline. MDDCs were infected with HIV-1 NLAD8 at 22°C to induce the TAS. Before allowing fusion to proceed by shifting the temperature, the cells were treated or not with the fusion inhibitor T20 or MVC. After washing the virus, replenishing the drugs, and shifting the cells to 37°C, the cells were used for a fusion assay or further maintained in culture for 2 days to assess productive infection. (B and C) Incubation at 22°C does not impair HIV uptake in MDDCs. Cells incubated with NLAD8 at 4°C, 22°C, or 37°C for 2 h were lysed or analyzed by immunofluorescence. (B) Gag p24 levels were measured in cell lysates from 2 donors. (C) Cells were stained for Gag and mannose receptor, a marker of early endosomes. Scale bars, 5 μm. (D) T20 and MVC inhibit HIV-1 fusion in the TAS assay. Cells were exposed to virions containing the Vpr-Blam protein. The cells were then loaded with CCF2-AM for 2 h and analyzed by flow cytometry. Cells maintained at 37°C were used as controls. The data are means and standard errors of the mean (SEM) for 4 different donors. (E) T20 and MVC inhibit HIV-1 infection. MDDCs were treated as described for panel A, and productive infection was monitored by measuring the proportion of Gag-positive cells by flow cytometry 2 days after infection. The data are means and SEM for 3 to 5 different donors. (F and G) Macropinocytosis does not lead to viral fusion in MDDCs. The indicated amounts of DMA were used to inhibit macropinocytosis. (F) Effect of DMA on the uptake of dextran-fluorescein, as measured by flow cytometry as a control. Means and SEM for 4 different donors are shown. (G) Effect of DMA on HIV-1 fusion, assessed with the Vpr-Blam assay. (Left) One representative donor is shown. (Right) Fold increase in fusion compared to nontreated cells. The data are means and SEM for 4 different donors. *, P < 0.05; **, P < 0.01; ***, P < 0.001.
FIG 2
FIG 2
CD4 levels modulate HIV infection in DCs. (A) CD11c+ mDCs express intermediate levels of CD4. Total PBMCs and mDCs (positive for HLA-DR and CD11c and negative for CD3, CD14, CD16, CD19, and CD56) were stained for CD4 surface expression. CD4 levels in one representative donor out of four are shown. (B) MDDCs and activated CD4+ T cells were stained for CD4, CXCR4, and CCR5 expression. One representative donor out of 4 is shown. (C and D) Nontransduced (Ntd) MDDCs or cells transduced with a lentiviral vector encoding CD4 (MDDC+CD4 WT) or luciferase (MDDC Ctrl) were stained for CD4 and, as controls, CXCR4, CCR5, and DC-SIGN. CD4 staining for 1 representative donor out of 4 (C) and the mean fluorescence intensity (MFI) of the indicated proteins (D) are shown as means and SEM from 4 donors. (E) HIV-1 infection is increased in MDDC plus CD4 WT. The cells described in panel C were infected with the indicated strains of HIV-1. After 3 days, productive infection was monitored by measuring the proportion of Gag-positive cells by flow cytometry. The results are means and SEM from 4 donors for HIV-1 strains (left) or as a control VSV-G-pseudotyped HIV-1 NL4-3 (middle); the fold increase of infection was calculated by comparing MDDC plus CD4 WT with MDDC Ctrl (right). *, P < 0.05; ***, P < 0.001; ns, not significant; nd, not done.
FIG 3
FIG 3
High levels of CD4 enhance HIV-1 fusion in MDDCs. MDDCs were transduced with vectors encoding luciferase (MDDC Ctrl) or CD4 WT (MDDC+CD4 WT). Nontransduced MDDCs were used as an additional control. The cells were exposed to the indicated viral particles containing the Vpr-Blam protein for 2 h. The cells were then loaded with CCF2-AM for 2 h, stained for CD4, and analyzed by flow cytometry. (A) One representative experiment. (B) Results (means and SEM from at least 4 donors for HIV-1 strains [left] or VSV-G-pseudotyped HIV-1 NL4-3 [middle]); the fold increase in fusion was calculated by comparing MDDC plus CD4 WT with MDDC Ctrl (right). ***, P < 0.001.
FIG 4
FIG 4
Importance of coreceptor levels for HIV-1 infection of MDDCs. (A and B) MDDCs were transduced with vectors encoding CXCR4 (MDDC+CXCR4) or CCR5 (MDDC+CCR5); stained for expression of CD4, CXCR4, and CCR5; and analyzed by flow cytometry. One representative donor out of 4 (A) and MFI of the indicated markers (B) are shown as means and SEM for 4 donors. (C) The transduced MDDCs were infected with NL4-3 or NLAD8 HIV-1 strains. After 3 days, productive infection was monitored by measuring the proportion of Gag-positive cells by flow cytometry. (Left) The results are means and SEM for at least 4 donors. (Right) The fold increase in infection was calculated by comparing transduced cells to MDDC Ctrl. (D) The transduced cells were used for a fusion assay as described in the legend to Fig. 3. (Left) The results are means and SEM for at least 4 donors. (Right) The fold increase in infection was calculated by comparing transduced cells to MDDC Ctrl. ***, P < 0.001.
FIG 5
FIG 5
Generation and characterization of CD4 chimeras. (A) Schematic representation of CD4 WT and a chimera containing the transmembrane and intracellular domains of the indicated proteins. (B) MDDCs were transduced with lentiviral vectors encoding CD4 WT (+CD4 WT), CD4 E1 (+CD4 E1), CD4 L1 (+CD4 L1), and CD4 T7 (+CD4 T7) proteins. CD4 levels were assessed by flow cytometry after fixation and staining without permeabilization (surface levels) or with permeabilization with 0.05% saponin (total levels). One representative donor out of 4 is shown in the two left panels, and MFI is shown in the two right panels as means and SEM for 4 donors. **, P < 0.01; ***, P < 0.001. (C) Transduced cells were seeded on coverslips, fixed, and permeabilized before costaining with antibodies against CD4 (red) and the indicated endosomal markers (green). The merged images (bottom row) highlight the colocalization events (yellow). Representative images from 4 independent donors are shown. Scale bars, 5 μm.
FIG 6
FIG 6
Impact of CD4 chimeras on HIV fusion and infection in MDDCs. MDDCs were transduced with the CD4 chimeras shown in Fig. 5. (A) Effect of the CD4 chimeras on HIV-1 infection. Cells were infected with the indicated strains of HIV-1. After 3 days, productive infection was monitored by measuring the proportion of Gag-positive cells by flow cytometry. (Left) The results are means and SEM for at least 4 donors. (Right) The fold increase in infection was calculated by comparing transduced cells to MDDC Ctrl. (B) Effect of CD4 chimeras on HIV-1 fusion. The transduced cells were used for a fusion assay. (Left) Results are means and SEM for at least 4 donors. (Right) The fold increase in fusion was calculated by comparing transduced cells to MDDC Ctrl. (C) Effect of the CD4 chimeras on HIV-2 fusion. The transduced cells were used for a fusion assay, using the HIV-2 strain GL-AN. The fold increase in fusion was calculated by comparing transduced cells to MDDC Ctrl. The results are means and SEM for at least 3 donors. *, P < 0.05; ***, P < 0.001.
FIG 7
FIG 7
Impact of CD4 chimeras on HIV fusion and infection in CHME cells. CHME cells were transduced with the CD4 chimeras described in the legend to Fig. 5. (A) CD4 levels were assessed in cells by flow cytometry after fixation and staining without permeabilization (surface levels) or with permeabilization with 0.05% saponin (total levels). One representative staining is shown. (B) Cells were infected with HIV-1 NL4-3. After 3 days, productive infection was monitored by measuring the proportion of Gag-positive cells by flow cytometry. The results are means and SEM for 3 independent experiments. (C and D) CHME cells were treated with the indicated doses of bafilomycin A1 for 24 h. (C) CD4 levels were assessed by flow cytometry as for panel A. (Left) One representative experiment. (Right) Means and SEM for 3 experiments. (D) Cells were then used for a fusion assay with the indicated viruses. The data are means and SEM for 3 independent experiments. *, P < 0.05; **, P < 0.01.
FIG 8
FIG 8
Localization of CD4 chimeras in CHME cells. CHME cells transduced with the CD4 chimeras were treated or not with bafilomycin A1 (100 nM) (Bafilo). After 24 h, the cells were costained with CD4 (red) and the lysosomal marker LAMP1 (green). One representative image per condition from 3 independent experiments is shown. The red squares indicate the zone that has been magnified on the right. Scale bar, 10 μm.

Similar articles

Cited by

References

    1. Buseyne F, Le Gall S, Boccaccio C, Abastado JP, Lifson JD, Arthur LO, Rivière Y, Heard JM, Schwartz O. 2001. MHC-I-restricted presentation of HIV-1 virion antigens without viral replication. Nat Med 7:344–349. doi:10.1038/85493. - DOI - PubMed
    1. Alloatti A, Kotsias F, Magalhaes JG, Amigorena S. 2016. Dendritic cell maturation and cross-presentation: timing matters! Immunol Rev 272:97–108. doi:10.1111/imr.12432. - DOI - PMC - PubMed
    1. Guilliams M, Ginhoux F, Jakubzick C, Naik SH, Onai N, Schraml BU, Segura E, Tussiwand R, Yona S. 2014. Dendritic cells, monocytes and macrophages: a unified nomenclature based on ontogeny. Nat Rev Immunol 14:571–578. doi:10.1038/nri3712. - DOI - PMC - PubMed
    1. Segura E, Amigorena S. 2015. Cross-presentation in mouse and human dendritic cells. Adv Immunol 127:1–31. doi:10.1016/bs.ai.2015.03.002. - DOI - PubMed
    1. Villani A-CC, Satija R, Reynolds G, Sarkizova S, Shekhar K, Fletcher J, Griesbeck M, Butler A, Zheng S, Lazo S, Jardine L, Dixon D, Stephenson E, Nilsson E, Grundberg I, McDonald D, Filby A, Li W, De Jager PL, Rozenblatt-Rosen O, Lane AA, Haniffa M, Regev A, Hacohen N. 2017. Single-cell RNA-seq reveals new types of human blood dendritic cells, monocytes, and progenitors. Science 356:eaah4573. doi:10.1126/science.aah4573. - DOI - PMC - PubMed

Publication types