

Subgenome Dominance in an Interspecific Hybrid, Synthetic Allopolyploid, and a 140-Year-Old Naturally Established Neo-Allopolyploid Monkeyflower
- PMID: 28814644
- PMCID: PMC5635986
- DOI: 10.1105/tpc.17.00010
Subgenome Dominance in an Interspecific Hybrid, Synthetic Allopolyploid, and a 140-Year-Old Naturally Established Neo-Allopolyploid Monkeyflower
Abstract
Recent studies have shown that one of the parental subgenomes in ancient polyploids is generally more dominant, having retained more genes and being more highly expressed, a phenomenon termed subgenome dominance. The genomic features that determine how quickly and which subgenome dominates within a newly formed polyploid remain poorly understood. To investigate the rate of emergence of subgenome dominance, we examined gene expression, gene methylation, and transposable element (TE) methylation in a natural, <140-year-old allopolyploid (Mimulus peregrinus), a resynthesized interspecies triploid hybrid (M. robertsii), a resynthesized allopolyploid (M. peregrinus), and progenitor species (M. guttatus and M. luteus). We show that subgenome expression dominance occurs instantly following the hybridization of divergent genomes and significantly increases over generations. Additionally, CHH methylation levels are reduced in regions near genes and within TEs in the first-generation hybrid, intermediate in the resynthesized allopolyploid, and are repatterned differently between the dominant and recessive subgenomes in the natural allopolyploid. Subgenome differences in levels of TE methylation mirror the increase in expression bias observed over the generations following hybridization. These findings provide important insights into genomic and epigenomic shock that occurs following hybridization and polyploid events and may also contribute to uncovering the mechanistic basis of heterosis and subgenome dominance.
© 2017 American Society of Plant Biologists. All rights reserved.
Figures

 ) for all testable homoeolog pairs. Testable homoeolog pairs (N) are those that could clearly be identified as homologous and had at least 1 read in each tissue sampled. Homoeolog pairs significantly biased toward the M. guttatus-like homoeolog are crosshatched, while pairs significantly biased toward the “other” homoeolog are shown in solid blue. Across all three hybrid individuals (F1, synthetic, and natural allopolyploid) the “other” subgenome dominates the M. guttatus-like subgenome either by the number of homoeologs biased toward it (NLb > NLa) or on average,
  , where
  and
and  are averages over all homoeolog pairs that were biased toward Lb or La, respectively.
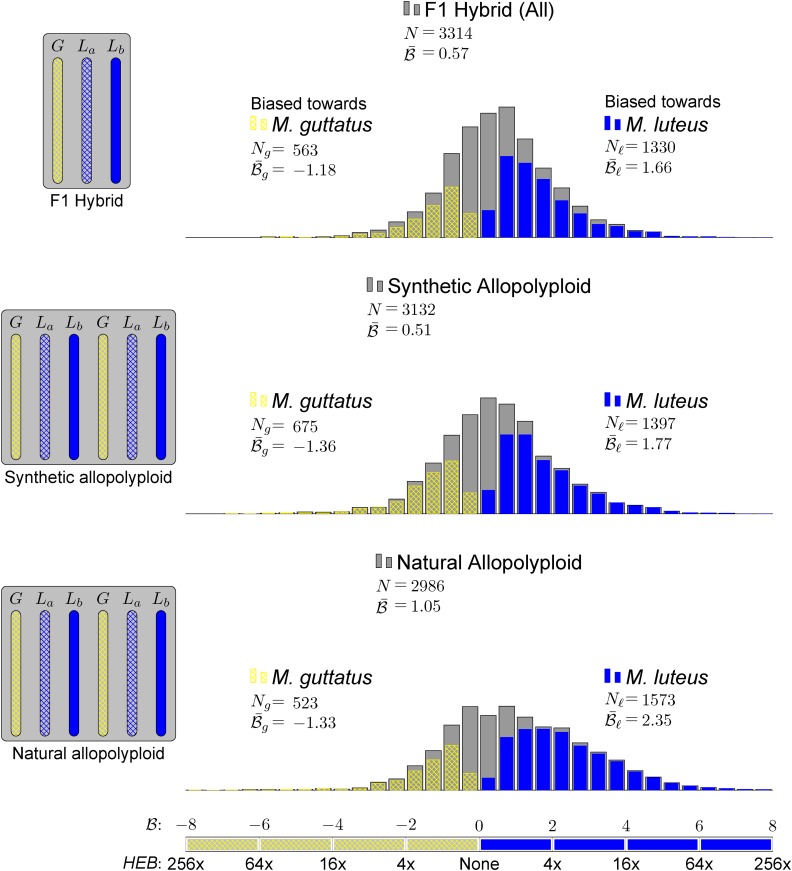
 ) for all testable homoeolog pairs. Only genes that had a clear 2 to 1 (M. luteus to M. guttatus) homology were considered. Homoeolog pairs significantly biased toward the M. guttatus homoeolog are shown in yellow, while pairs significantly biased toward the M. luteus homoeolog are shown in blue. Across all three hybrid individuals (F1, synthetic, and natural allopolyploid) the pair of M. luteus homoeologs, when added together, dominates the M. guttatus homoeolog (i.e.,
  and
and  , where
  and
and  are averages over all homoeolog pairs).
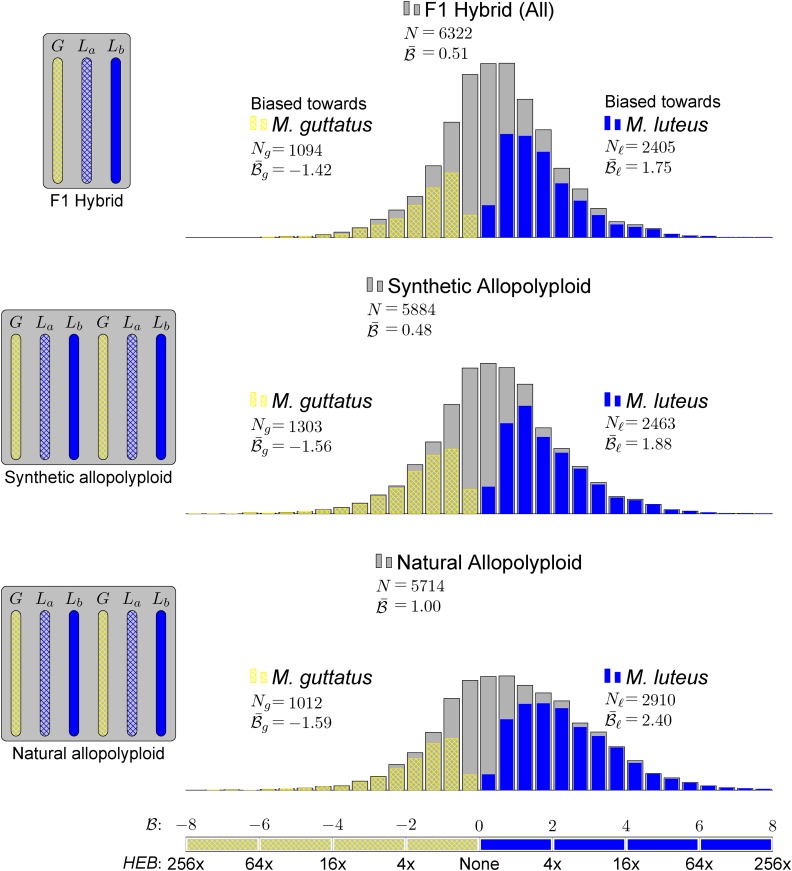
 ) for all testable homoeolog pairs. Homoeolog pairs significantly biased toward the M. guttatus homoeolog are shown in yellow, while pairs significantly biased toward the M. luteus homoeolog are shown in blue. Across all three hybrid individuals (F1, synthetic, and natural allopolyploid) the M. luteus homoeolog dominates the M. guttatus homoeolog (i.e.,
  and
and  , where
  and
and  are averages over all homoeolog pairs).
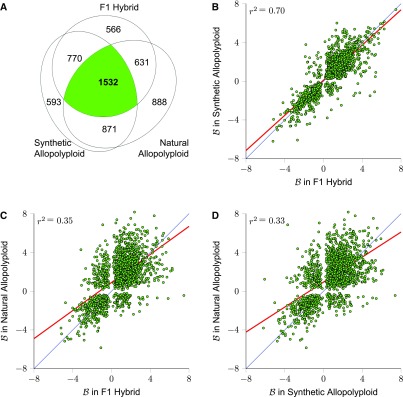
 ) for these 1532 homoeolog pairs comparing hybrid to synthetic allopolyploid, hybrid to natural allopolyploid, and synthetic to natural allopolyploid (red line is linear regression; thin blue line is identity).
References
-
- Adams K.L., Wendel J.F. (2005). Novel patterns of gene expression in polyploid plants. Trends Genet. 21: 539–543. - PubMed
-
- Barker M.S., Arrigo N., Baniaga A.E., Li Z., Levin D.A. (2015). On the relative abundance of autopolyploids and allopolyploids. New Phytol. 210: 391–398. - PubMed
-
- Benjamini Y., Hochberg Y. (1995). Controlling the false discovery rate: a practical and powerful approach to multiple testing. J. R. Stat. Soc. B 57: 289–300.
MeSH terms
LinkOut - more resources
Full Text Sources
Other Literature Sources
Molecular Biology Databases
