. 2017 Sep;29(9):2106-2125.
doi: 10.1105/tpc.17.00099. Epub 2017 Aug 16.

Zygotic Genome Activation Occurs Shortly after Fertilization in Maize

Affiliations

Zygotic Genome Activation Occurs Shortly after Fertilization in Maize

Junyi Chen et al. Plant Cell. 2017 Sep.

Abstract

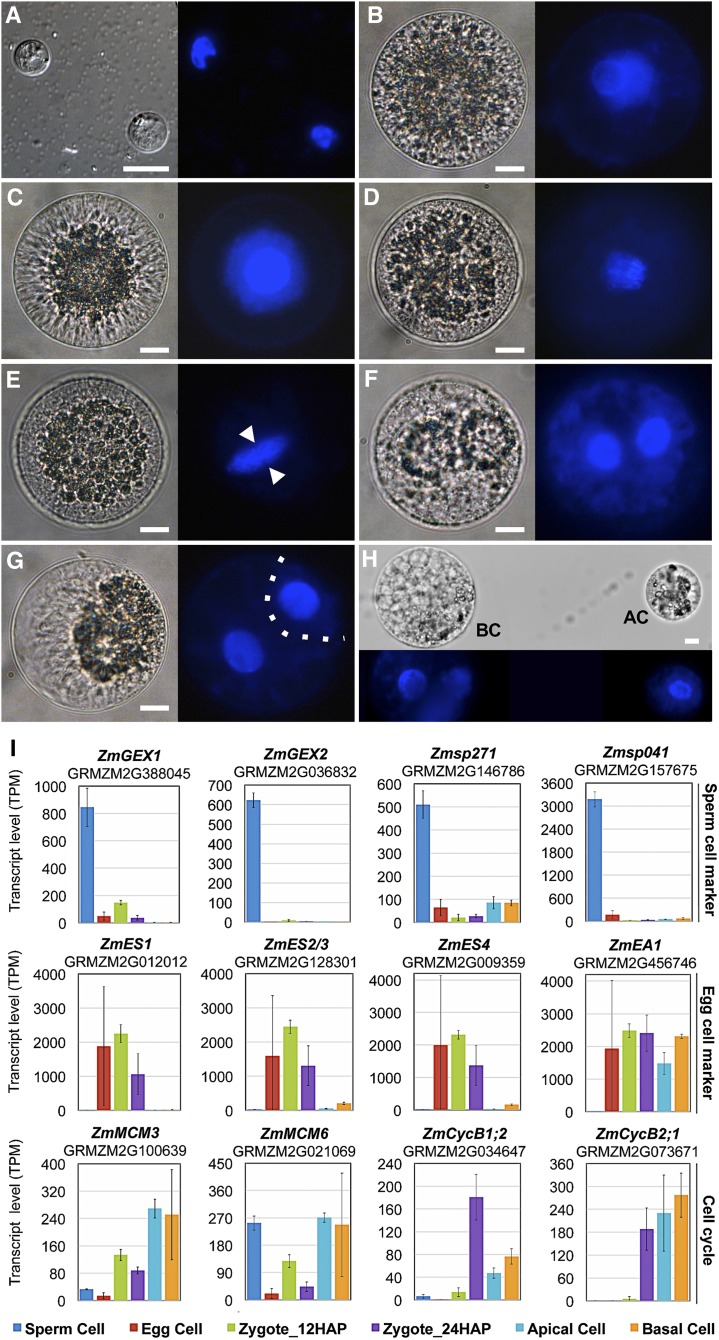
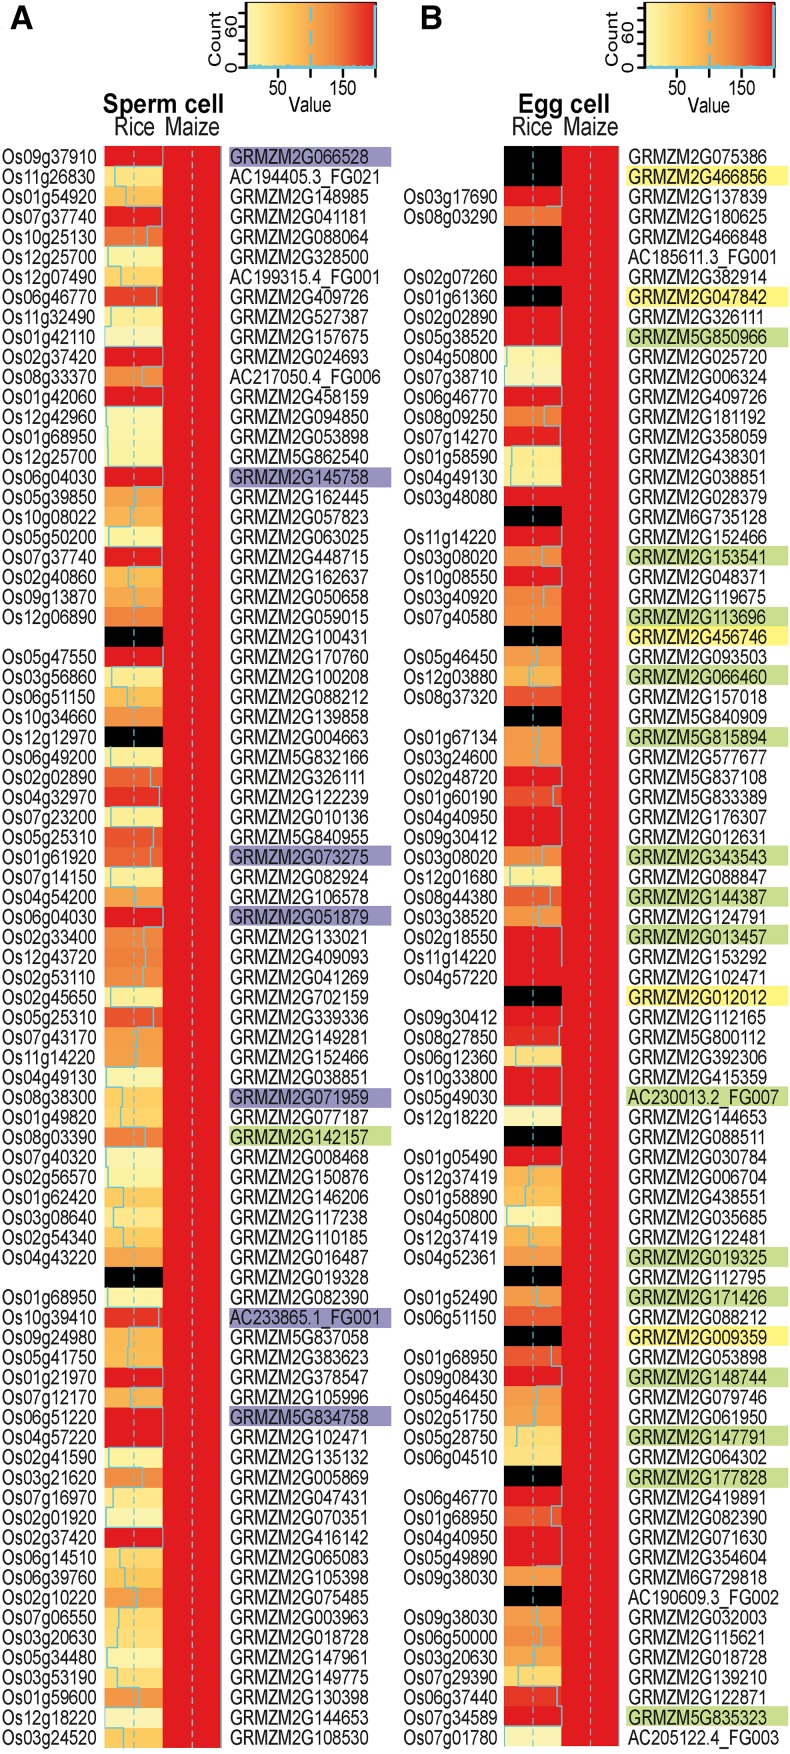
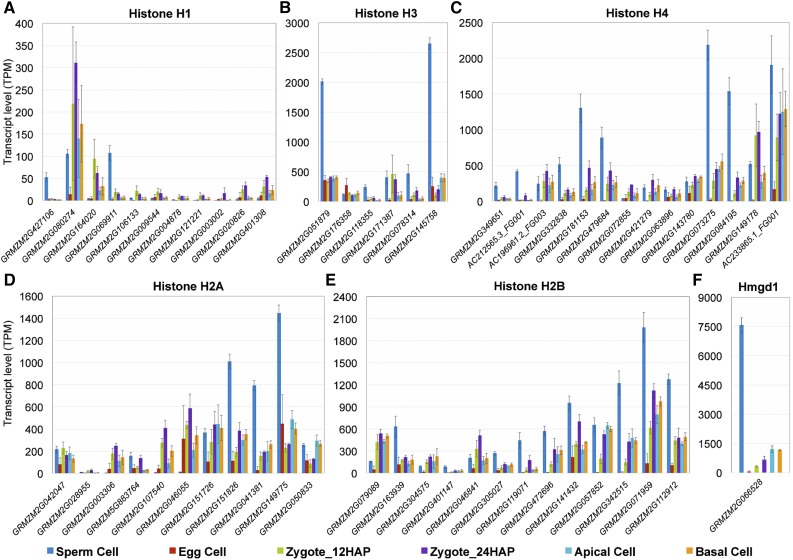
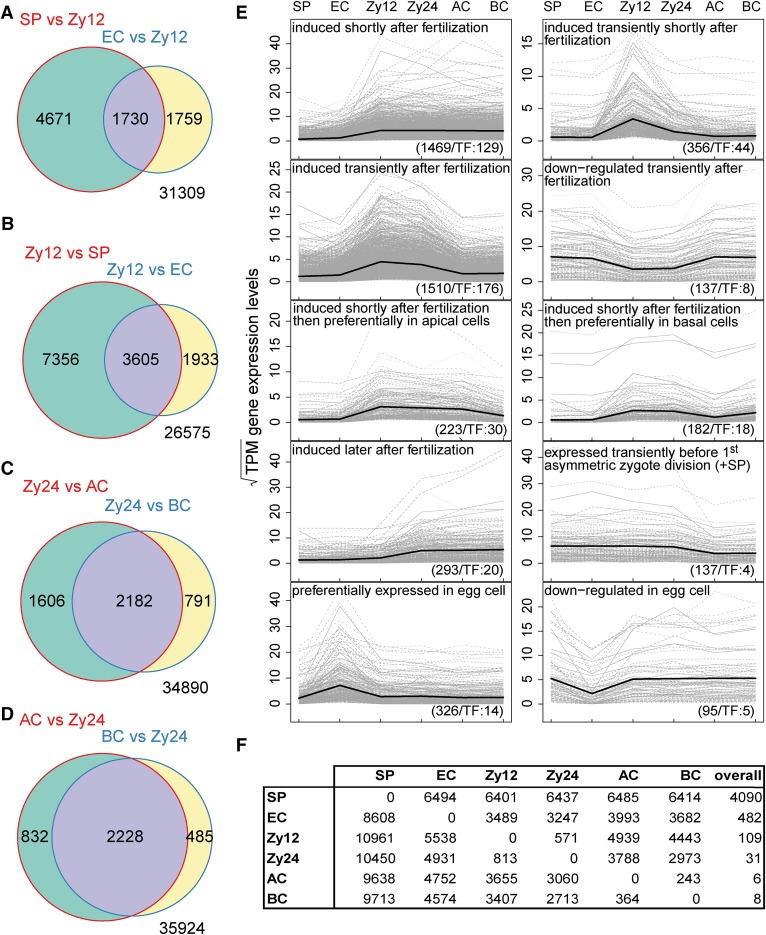
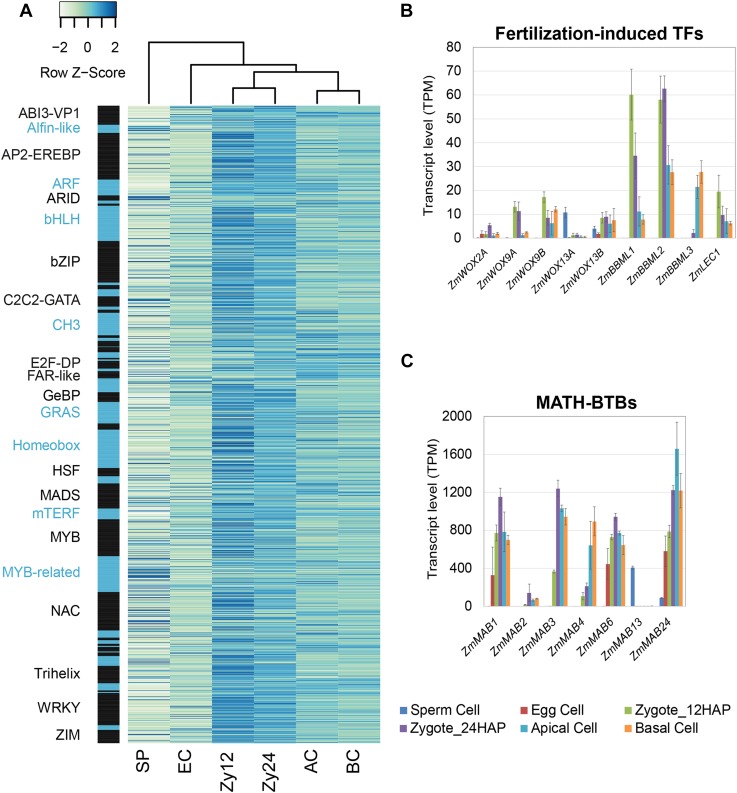
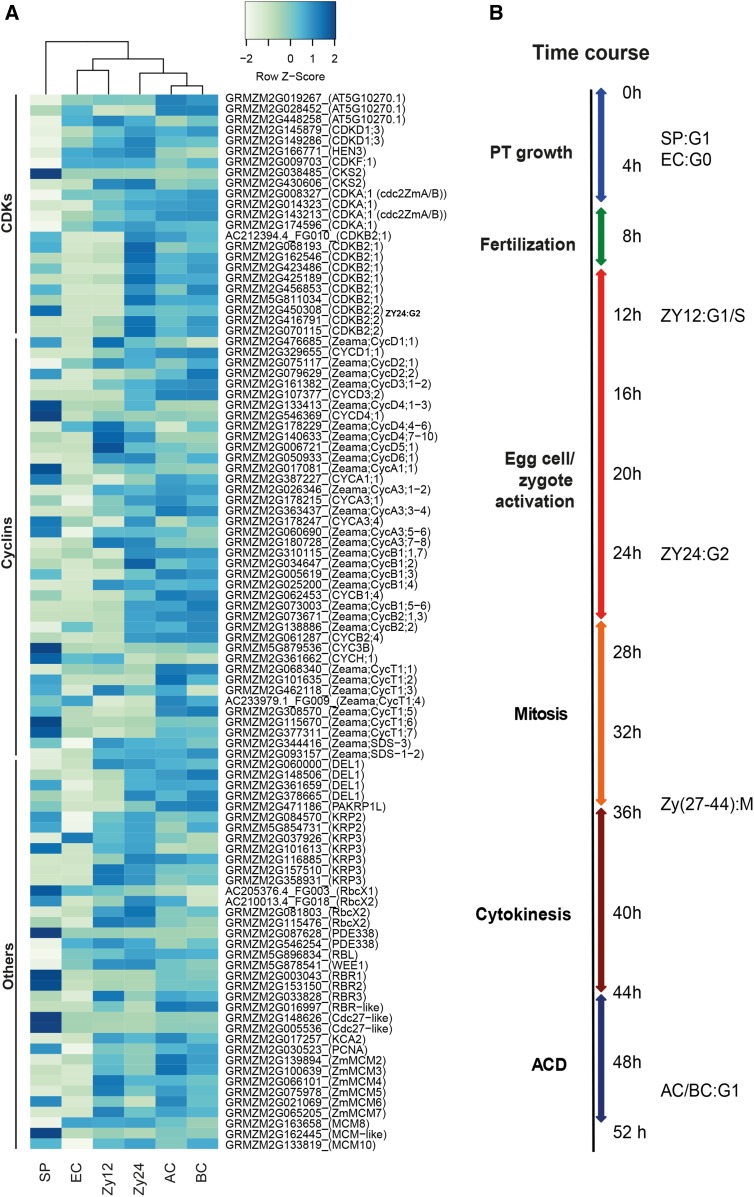
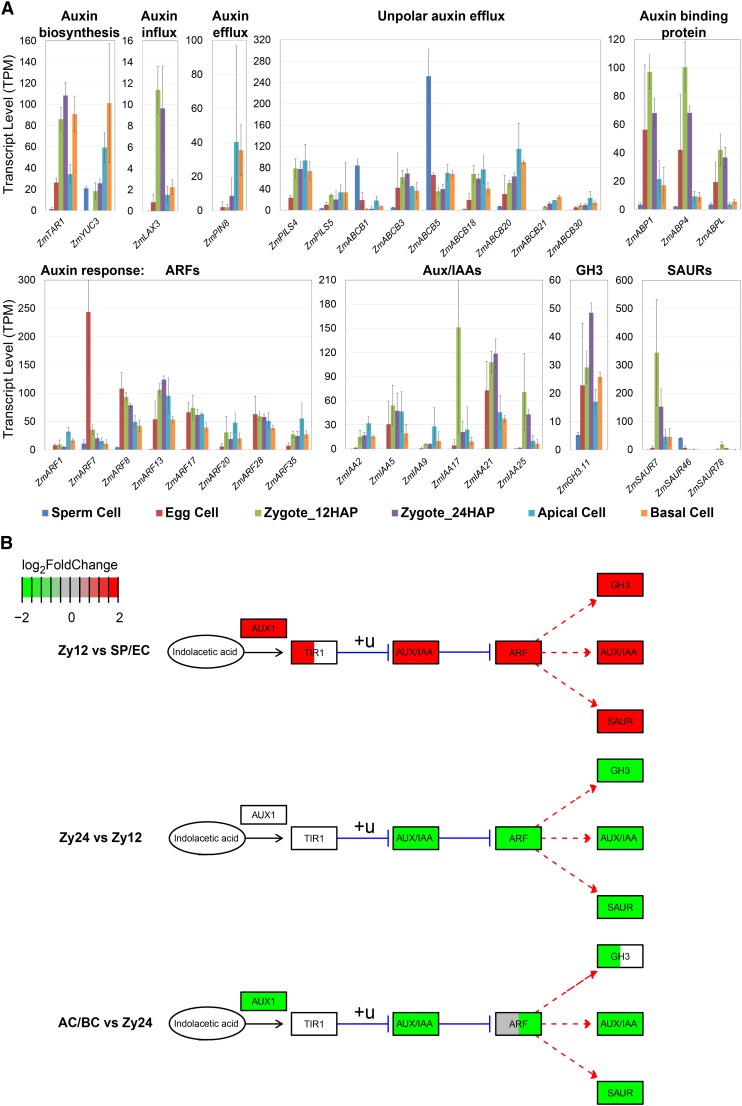
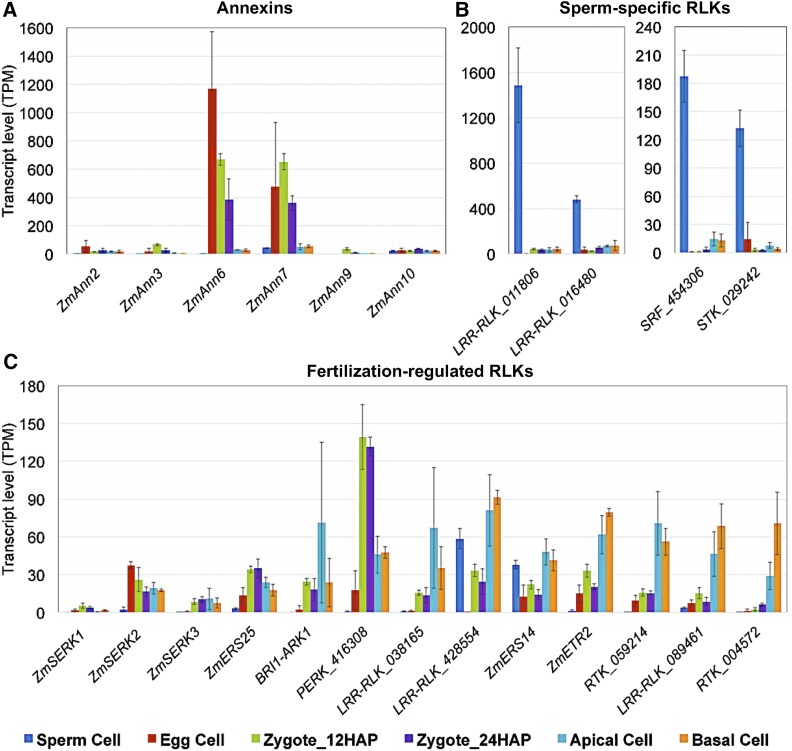
The formation of a zygote via the fusion of an egg and sperm cell and its subsequent asymmetric division herald the start of the plant's life cycle. Zygotic genome activation (ZGA) is thought to occur gradually, with the initial steps of zygote and embryo development being primarily maternally controlled, and subsequent steps being governed by the zygotic genome. Here, using maize (Zea mays) as a model plant system, we determined the timing of zygote development and generated RNA-seq transcriptome profiles of gametes, zygotes, and apical and basal daughter cells. ZGA occurs shortly after fertilization and involves ∼10% of the genome being activated in a highly dynamic pattern. In particular, genes encoding transcriptional regulators of various families are activated shortly after fertilization. Further analyses suggested that chromatin assembly is strongly modified after fertilization, that the egg cell is primed to activate the translational machinery, and that hormones likely play a minor role in the initial steps of early embryo development in maize. Our findings provide important insights into gamete and zygote activity in plants, and our RNA-seq transcriptome profiles represent a comprehensive, unique RNA-seq data set that can be used by the research community.


Figures

Figure 1.
Figure 1.
Time Course of Zygote Development and Validation of RNA-Seq Data. (A) Sperm cells. (B) Egg cell. (C) Zygote at 24 HAP. (D) Zygote at 30 HAP at anaphase. (E) Zygote at 35 HAP at telophase. Arrowheads indicate phragmoplast between daughter chromosome sets. (F) Zygote at 43 HAP during ACD. (G) Zygote at 48 HAP. Cytokinesis is completed. Dotted line indicates the cell division plane. (H) Apical (AC) and basal cell (BC) have been separated at 54 HAP. Bright-field microscopy images are shown on the left and UV images of DAPI-stained cells on the right. Bars = 10 μm. (I) Validation of RNA-seq data with known genes, as indicated. Top row: Genes preferentially expressed in sperm cells. Middle row: Genes highly expressed in egg cells and downregulated after fertilization. Bottom row: Expression of cell cycle regulators. Transcript levels are shown as TPM values (means ± sd) of three biological replicates.
Figure 2.
Figure 2.
Heat Map Showing a Comparison of the 80 Most Highly Expressed Genes in Maize Gametes and Their Predicted Orthologs in the Corresponding Rice Gametes. TOP80 most highly expressed genes in maize sperm cells (A) and TOP80 genes in maize egg cells (B). Rice and maize gene expression values (TPM) were square root transformed and classified into 200 expression bins using the 99th percentile of the data as the maximum value. Note that all maize genes shown are in the bin with maximum expression and are therefore represented by red bars. Plastid genomes were excluded, as they showed overshooting of expression in the rice data. Nonexpressed genes in the rice data and genes lacking a clear homolog are marked by black bars. Orthologous gene information is based on the EnsemblPlants Compara database, The Rice Genome Annotation Project (RGAP), and orthologs from RGAP based on OrthoMCL. Maize genes encoding histones and high-mobility group genes are shaded in purple, proteins involved in translation are in green, and EA1-box proteins and predicted secreted CRPs are in yellow. Proteins were classified according to InterPro.
Figure 3.
Figure 3.
Expression of Major Chromatin Structure Protein Genes in Maize Gametes, Zygotes, and Daughter Cells. Histone H1 (A), histone H3 (B), histone H4 (C), histone H2A (D), histone H2B (E), and HMG protein Hmgd1 (F). All genes of the various families differentially expressed in at least one comparison are presented. See Supplemental Figure 3 for phylogenetic analysis of male-specific and active chromatin-specific variants of histones H3 and H2A. Gene identifiers are listed in Supplemental Data Set 7 (important gene families). Transcript levels in the cells indicated are given as TPM values (means ± sd).
Figure 4.
Figure 4.
Gene Expression Dynamics in Maize Gametes, Zygotes, and Two-Celled Pro-Embryo Cells. Genes with an absolute log2FC > 1 and P-adjusted < 0.05 were considered to be biologically meaningful. (A) Comparison of the number of genes induced in sperm cells (SP) and egg cells (EC) versus zygotes at 12 HAP (Zy12). (B) Comparisons of genes upregulated in zygotes at 12 HAP versus sperm and egg cells. (C) Number of genes induced in zygotes at 24 HAP compared with apical (AC) and basal (BC) cells. (D) Comparison of genes upregulated in apical and basal cells versus zygotes at 24 HAP (Zy24). (E) Selected gene expression profiles across the specific cell types analyzed (Supplemental Data Set 6). The Pearson correlation (>0.9) of square root transformed TPM values per gene and binary profile vectors were used to identify genes belonging to a specific profile. The total number of genes including TFs contained in each profile is shown at the bottom. The mean expression level of all genes per specific cell type is plotted in each profile (black line). (F) Table of differentially upregulated genes (log2FC > 1, P-adjusted<0.05) of row cell type versus column cell type. The last column shows the number of differentially upregulated genes in a row cell type versus all other cell types.
Figure 5.
Figure 5.
Expression Levels of TF and MAB Genes in Gametes, Zygotes, and Early Two-Celled Pro-Embryo Cells in Maize. (A) Expression levels of TF genes in gametes and at early developmental stages after fertilization. Genes with abs(log2FC) > 1 and P-adjusted < 0.05 in at least one cell type comparison were considered. To make the expression levels comparable across multiple cell types, z-scores were calculated from the square root transformed TPM values corresponding to the number of standard deviations between the cell type-specific expression value and the mean expression value of the respective gene. Genes were ordered by TF classes (black/blue bars). Black and blue fonts were used alternatively to distinguish the various classes. See Supplemental Data Sets 2 and 7 for details. (B) and (C) Expression analysis of selected maize genes encoding homologs of Arabidopsis early embryogenesis-related TFs (B) and MATH-BTB (MAB) family genes (C) involved in ACD.
Figure 6.
Figure 6.
Gene Expression Analysis of Cell Cycle Regulators. (A) Major regulators of the maize cell cycle (Supplemental Data Set 2). Transformation of gene expression values as described above. Genes were ordered into protein classes based on data from the literature (see Methods for details). (B) Summary of the time course of pollen tube (PT) growth, fertilization, and zygote development. Cell cycle stages of the selected cells are indicated based on the currently reported expression data.
Figure 7.
Figure 7.
Analysis of Gene Expression Changes in the Auxin Pathway in Gametes, Zygotes, and during Early Embryogenesis. (A) Expression analysis of the most highly expressed auxin biosynthesis, transport, and auxin response-related genes. (B) Auxin pathway analysis using three developmental transitions during zygote development. The median values over the log2FCs of all differentially expressed genes (P-adjusted <0.05) from the respective comparison are color-coded in green (downregulated) and red (upregulated). All log2FCs above 2 or below –2 were set to 2/–2 to improve visualization. White boxes, no significant log2FC; +u, ubiquitination; blue line, inhibition; red dashed line, expression. Pathway based on KEGG database. See Supplemental Data Set 2 for genes.
Figure 8.
Figure 8.
Expression Analysis of Selected Maize Genes with Putative Roles in Signaling during Gamete Interaction and Early Embryogenesis. Ca2+-dependent phospholipid binding annexin family proteins (A), sperm-specific receptor-like kinases (B), and fertilization-regulated receptor-like kinases (C). Gene identifiers are listed in Supplemental Data Set 2 (important gene families). Transcript levels in the cells indicated are given as TPM values (means ± sd).

References

    1. Ahmad K., Henikoff S. (2002). The histone variant H3.3 marks active chromatin by replication-independent nucleosome assembly. Mol. Cell 9: 1191–1200. - PubMed
    1. Amien S., Kliwer I., Márton M.L., Debener T., Geiger D., Becker D., Dresselhaus T. (2010). Defensin-like ZmES4 mediates pollen tube burst in maize via opening of the potassium channel KZM1. PLoS Biol. 8: e1000388. - PMC - PubMed
    1. Anderson S.N., Johnson C.S., Jones D.S., Conrad L.J., Gou X., Russell S.D., Sundaresan V. (2013). Transcriptomes of isolated Oryza sativa gametes characterized by deep sequencing: evidence for distinct sex-dependent chromatin and epigenetic states before fertilization. Plant J. 76: 729–741. - PubMed
    1. Autran D., et al. (2011). Maternal epigenetic pathways control parental contributions to Arabidopsis early embryogenesis. Cell 145: 707–719. - PubMed
    1. Baroux C., Grossniklaus U. (2015). The maternal-to-zygotic transition in flowering plants: Evidence, mechanisms, and plasticity. Curr. Top. Dev. Biol. 113: 351–371. - PubMed

MeSH terms