. 2017 Aug 17;2(16):e91914.
doi: 10.1172/jci.insight.91914.

Irgm1 coordinately regulates autoimmunity and host defense at select mucosal surfaces

Affiliations

Irgm1 coordinately regulates autoimmunity and host defense at select mucosal surfaces

Kathleen M Azzam et al. JCI Insight. .

Abstract

The pathogenesis of primary Sjogren's syndrome (SS), an autoimmune disease that targets the mucosa of exocrine tissues, is poorly understood. Although several mouse models have been developed that display features of SS, most of these are within the larger context of a lupus-like presentation. Immunity-related GTPase family M protein 1 (Irgm1) is an interferon-inducible cytoplasmic GTPase that is reported to regulate autophagy and mitochondrial homeostasis. Here, we report that naive Irgm1-/- mice display lymphocytic infiltration of multiple mucosal tissues including the lung in a manner reminiscent of SS, together with IgA class-predominant autoantibodies including anti-Ro and anti-La. This phenotype persists in the germ-free state, but is abolished by deletion of Irgm3. Irgm1-/- mice have increased local production in the lung of TECP15-idiotype IgA, a natural antibody with dual reactivity against host and pneumococcal phosphorylcholine. Associated with this, Irgm1-/- mice display enhanced opsonization and clearance of Streptococcus pneumoniae from the lung and increased survival from pneumococcal pneumonia. Taken together, our results identify Irgm1 as a master regulator of mucosal immunity that dually modulates evolutionarily conserved self- and other-directed immune responses at the interface of host with environment.

Keywords: Autoimmunity; Pulmonology.


Conflict of interest statement

Conflict of interest: The authors have declared that no conflict of interest exists.

Figures

Figure 1
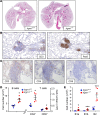
Figure 1. Peribronchovascular lymphocytic infiltrates in the Irgm1–/– lung.
(A) Hematoxylin and eosin–stained lungs from naive Irgm1–/– mice and littermate controls. Original magnification, ×1.1. (B) Peribronchovascular cellular infiltrates in Irgm1–/– lungs were evaluated by immunohistochemical (IHC) staining for CD3 (T cells) and Pax5 (B cells). Original magnification, ×20. (C) Irgm1–/– lung lesions were IHC stained for the targets shown. Original magnification, ×20. (D) B cells (CD45+CD19+CD3), and CD4+ and CD8+ T cells (CD45+CD19CD3+) were quantified by flow cytometry in lung digests from naive Irgm1–/– mice and controls (n = 4/genotype). (E) B1a (CD19+CD5+CD11b+IgMhi), B1b (CD19+CD5CD11b+IgMhi), and B2 (CD19+CD5CD11bIgMlo) cells were quantified by flow cytometry in lung digests from naive Irgm1–/–mice and controls (n = 4–6/genotype). Histology and IHC data are representative of at least 4–5 mice/genotype. Graphed data are the mean ± SEM and are representative of at least 3 independent experiments. *P < 0.05, ***P < 0.001 by unpaired 2-tailed Student’s t test.
Figure 2
Figure 2. Dysregulated lymphocyte populations in Irgm1–/– mice.
(A) Counts of circulating total leukocytes (WBC) and leukocyte subtypes were enumerated in naive Irgm1–/– mice and controls (n = 10/genotype). (B) Circulating B cells (CD3B220+) and T cells (CD3+B220) in naive Irgm1–/– mice and controls (n = 4/genotype) were quantified by flow cytometry. (C) Peritoneal B1a (CD19+CD5+CD11b+IgMhiCD23lo), B1b (CD19+CD5CD11b+IgMhiCD23lo), and B2 (CD19+CD5CD11bIgMloCD23hi) cells in naive Irgm1–/– mice and controls (n = 7/genotype) were quantified by flow cytometry. Data are the mean ± SEM and are representative of at least 2–3 independent experiments. *P < 0.05, **P < 0.01, ***P < 0.001 by unpaired 2-tailed Student’s t test. ND, not detected; PMN, neutrophil; Lymph, lymphocyte; Mono, monocyte; Eo, eosinophil; Baso, basophil.
Figure 3
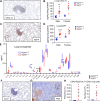
Figure 3. Lung lesions of Irgm1–/– mice display active germinal centers.
(AD) Lungs of naive Irgm1–/– mice and controls were evaluated by IHC and ELISA for CXCL13 (A and B) and B cell–activating factor (BAFF) (C and D). Original magnification for panels A and C, ×20. For ELISA, 4–8 mice/genotype were used. (E) Cytokines were quantified in lung homogenates from naive Irgm1–/– mice and controls (n = 7/genotype) using multiplex technology. (F and G) Lung lesions of Irgm1–/– mice were stained by IHC for (F) Ki-67 (original magnification, ×20) and (G) peanut agglutinin (PNA; original magnification, ×40). (H) CD45+B220+GL7+CD38 germinal center B cells were quantified in lung digests of naive Irgm1–/– mice and controls (n = 4–5/genotype). Data are the mean ± SEM and are representative of at least 3 independent experiments. IHC images are representative of at least 3–4 mice. *P < 0.05, **P < 0.01, ***P < 0.001, ****P < 0.0001 by unpaired 2-tailed Student’s t test.
Figure 4
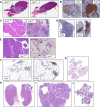
Figure 4. Lymphocytic infiltration of multiple exocrine tissues in Irgm1–/– mice.
(A and B) Submandibular salivary glands from naive Irgm1–/– mice and controls were stained with hematoxylin and eosin (H&E; original magnification, ×1.4) (A), and lymphocytic lesions detected in Irgm1–/– tissue (shown by arrows in A) were then IHC stained for T cells (CD3) and B cells (Pax5) (original magnification, ×40) (B). (C and D) Extraorbital lacrimal glands from naive Irgm1–/– mice and controls were stained with H&E (original magnification, ×4) (C), and lymphocytic lesions detected in Irgm1–/– tissue were then IHC stained for T cells (CD3) and B cells (Pax5) (original magnification, ×20) (D). (E and F) Pancreas from naive Irgm1–/– mice and controls was stained with H&E (original magnification, ×4) (E). Arrows indicate ducts and islets, which are unaffected; asterisks indicate surrounding adipose replacement of exocrine regions. Rare lymphocytic infiltrates in Irgm1–/– tissue were IHC stained for T cells (CD3) and B cells (Pax5) (original magnification, ×20) (F). (GJ) Lungs (G), submandibular salivary glands (H), extraorbital lacrimal glands (I), and pancreas (J) were evaluated by H&E stain in naive Irgm1–/– Irgm3–/– mice. Original magnification, ×0.9 for G and J, ×1.4 for H, and ×4 for I. Tissues in all cases are representative of at least 3–4 mice per genotype.
Figure 5
Figure 5. IgA-predominant autoimmunity in naive Irgm1–/– mice.
(A) Serum from naive Irgm1–/– mice and controls (n = 9/genotype) was evaluated for IgA-class anti-nuclear antibodies (ANAs) by indirect immunofluorescence staining of HEp-2 cells. At right, ANA staining was quantified by endpoint (reciprocal of last dilution revealing discernible nuclear staining pattern) and MetaMorph (intensity) analysis (AUs = arbitrary units). (B) IgA, IgG, and IgM anti–double stranded DNA (dsDNA) antibodies were quantified in serum of Irgm1–/– mice and controls of 2 ages using ELISA (n = 7–12/condition). (C) IgA anti-SSA (Ro-52 and Ro-60) and anti-La antibodies were quantified in male and female mice of 2 ages (n = 6–10/condition). (D) Cytokines were quantified in serum of Irgm1–/– mice and controls using multiplex technology (n = 10–13/genotype). (E) Serum B cell–activating factor (BAFF) and CXCL13 were quantified by ELISA (n = 6–12/genotype). Data are the mean ± SEM and are representative of at least 3 independent experiments. *P < 0.05, **P < 0.01, ***P < 0.001 by unpaired 2-tailed Student’s t test.
Figure 6
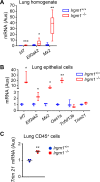
Figure 6. Spontaneous induction of interferon-stimulated genes in the Irgm1–/– lung.
mRNA expression (normalized to GAPDH) of the indicated targets was quantified in whole lung (A), pulmonary epithelial (CD45CD31CD34EpCAM+) cells sorted by FACS (B), and pulmonary hematopoietic (CD45+) cells purified by column (C) from naive Irgm1–/– and Irgm1+/+ mice (n = 3–7/genotype). Data are the mean ± SEM and are representative of at least 3 independent experiments. *P < 0.05, **P < 0.01, ***P < 0.001 by unpaired 2-tailed Student’s t test.
Figure 7
Figure 7. Antibody production by the Irgm1–/– lung.
(A and B) IgM, IgG, and IgA were quantified by ELISA in serum (A) and bronchoalveolar lavage fluid (BALF) (B) of naive Irgm1–/– mice and controls (n = 4/genotype). (C and D) Polymeric Ig receptor (pIgR) was detected by immunoblot in equal protein aliquots of lung homogenate (C) (n = 4–5/genotype) and BALF, i.e., as cleaved secretory component (SC) (D) (n = 3–4/genotype), from independent mice as shown. Actin serves as a loading control. Densitometry of the corresponding blots is shown at right (AU = arbitrary unit). (E) IgA was detected by immunoblot under nonreducing conditions in BALF of naive mice as shown. n = 3–4/genotype. (F) Immunohistochemically stained sections of naive Irgm1–/– lungs showing staining for IgM, IgG, and IgA in lymphocytic infiltrates. Original magnification, ×10. (G and H) Antibody-secreting cells (ASCs) of the 3 immunoglobulin classes shown were quantified in lung, bone marrow, and spleen of naive Irgm1–/– mice and controls using ELISPOT. In H the corresponding serial dilution ELISPOT plates for lung are depicted for n = 4 mice/genotype. (I) IgM, IgG, and IgA were quantified by ELISA in homogenates of perfused lungs from Irgm1–/– mice and controls (n = 4/genotype). Data are the mean ± SEM and are representative of at least 3 independent experiments. P = 0.08, *P < 0.05, **P < 0.01, ***P < 0.001 by unpaired 2-tailed Student’s t test.
Figure 8
Figure 8. Production of T15-idiotype anti-phosphorylcholine IgA in the Irgm1–/– lung.
(A) Anti-phosphorylcholine (anti-PC) IgM, IgA, and IgG was quantified by ELISA in serum of naive Irgm1–/– mice and controls. (B) Anti-PC IgA antibody-secreting cells (ASCs) were quantified in perfused lung of naive Irgm1–/– mice and controls by ELISPOT. Data were verified by BSA negative control run in parallel and background subtracted. (C) Anti-PC IgA was quantified by ELISA in bronchoalveolar lavage fluid (BALF) of naive Irgm1–/– mice and controls. (D) T15-idiotype IgA was quantified by ELISA in BALF, lung, and serum of naive Irgm1–/– mice and controls. (E) T15-idiotype B cells were quantified by flow cytometry in lung of naive Irgm1–/– mice and controls. Data are the mean ± SEM and are representative of at least 3 independent experiments involving n = 4–6/genotype. *P < 0.05, **P < 0.01, ***P < 0.001 by unpaired 2-tailed Student’s t test.
Figure 9
Figure 9. Enhanced anti-Pneumococcal host defense in Irgm1–/– mice.
(A and B) Mice (n = 5/genotype) were infected in the lungs with PKH26-labeled Streptococcus pneumoniae. Thirty minutes after infection, the percentage of IgM- and IgA-opsonized cell-free (CD45) extracellular bacteria was quantified by flow cytometry. The gating strategy is shown in B. (C) Lung bacterial colony-forming units (CFUs) were quantified 48 hours after infection of Irgm1–/– mice and controls with S. pneumoniae (n = 6–7/genotype). (D) Survival was monitored in Irgm1–/– mice and controls (n = 10/genotype) following lung infection with S. pneumoniae. Data are the mean ± SEM and are representative of at least 2–3 independent experiments. *P < 0.05, **P < 0.01 by unpaired 2-tailed Student’s t test. Survival was evaluated by log-rank test (P < 0.05).

References

    1. Nocturne G, Mariette X. Advances in understanding the pathogenesis of primary Sjögren’s syndrome. Nat Rev Rheumatol. 2013;9(9):544–556. doi: 10.1038/nrrheum.2013.110. - DOI - PubMed
    1. Delaleu N, Nguyen CQ, Peck AB, Jonsson R. Sjögren’s syndrome: studying the disease in mice. Arthritis Res Ther. 2011;13(3):217. doi: 10.1186/ar3313. - DOI - PMC - PubMed
    1. Kreider M, Highland K. Pulmonary involvement in Sjögren syndrome. Semin Respir Crit Care Med. 2014;35(2):255–264. doi: 10.1055/s-0034-1371529. - DOI - PubMed
    1. Randall TD. Bronchus-associated lymphoid tissue (BALT) structure and function. Adv Immunol. 2010;107:187–241. doi: 10.1016/B978-0-12-381300-8.00007-1. - DOI - PMC - PubMed
    1. Moyron-Quiroz JE, et al. Role of inducible bronchus associated lymphoid tissue (iBALT) in respiratory immunity. Nat Med. 2004;10(9):927–934. doi: 10.1038/nm1091. - DOI - PubMed