. 2017 Aug 17;2(16):e78210.
doi: 10.1172/jci.insight.78210.

MTG16 is a tumor suppressor in colitis-associated carcinoma

Affiliations

MTG16 is a tumor suppressor in colitis-associated carcinoma

Elizabeth M McDonough et al. JCI Insight. .

Abstract

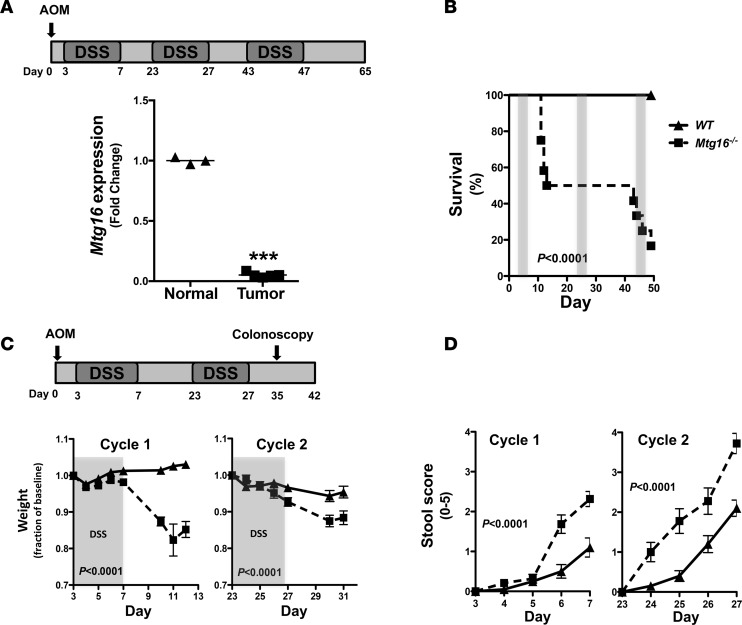
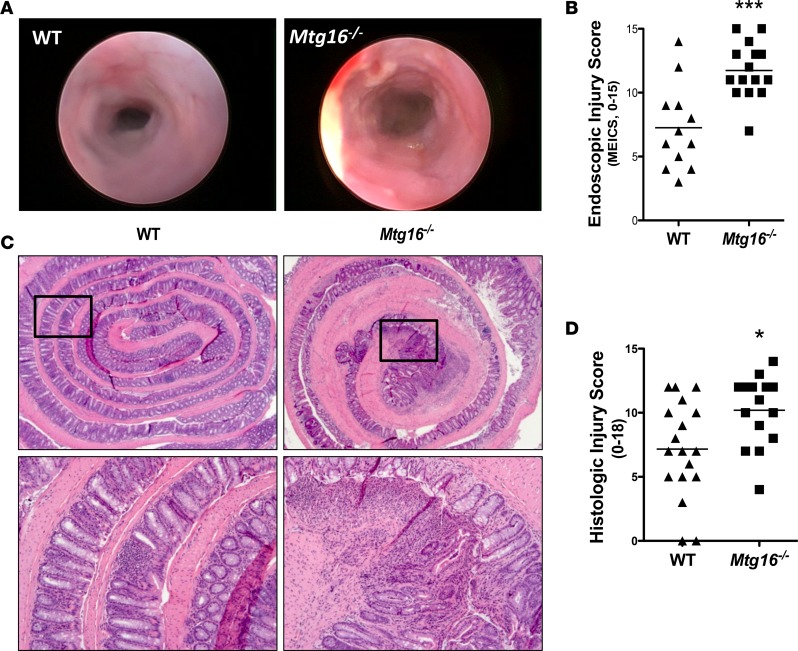
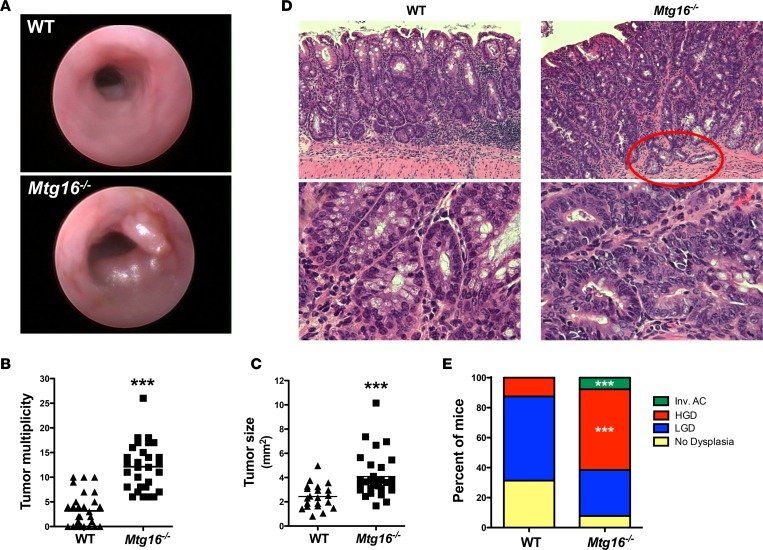
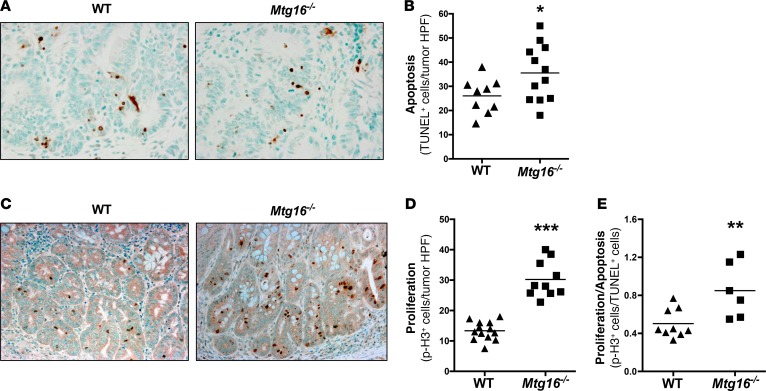
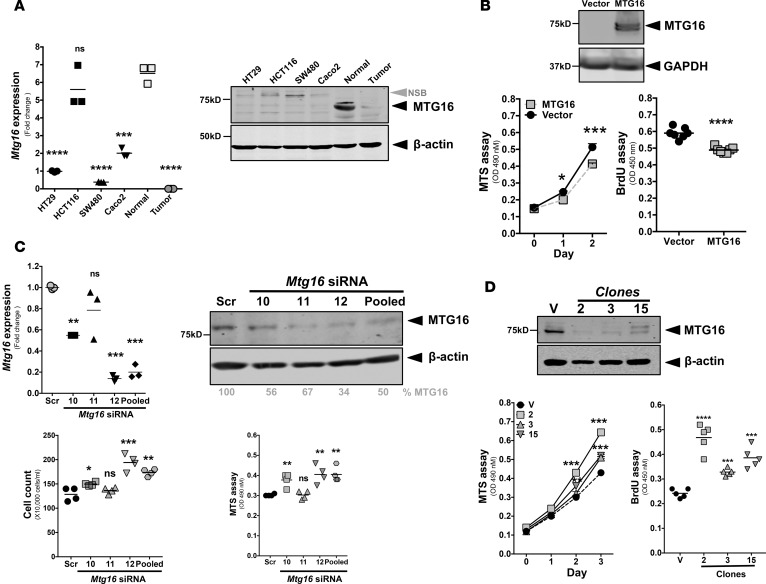
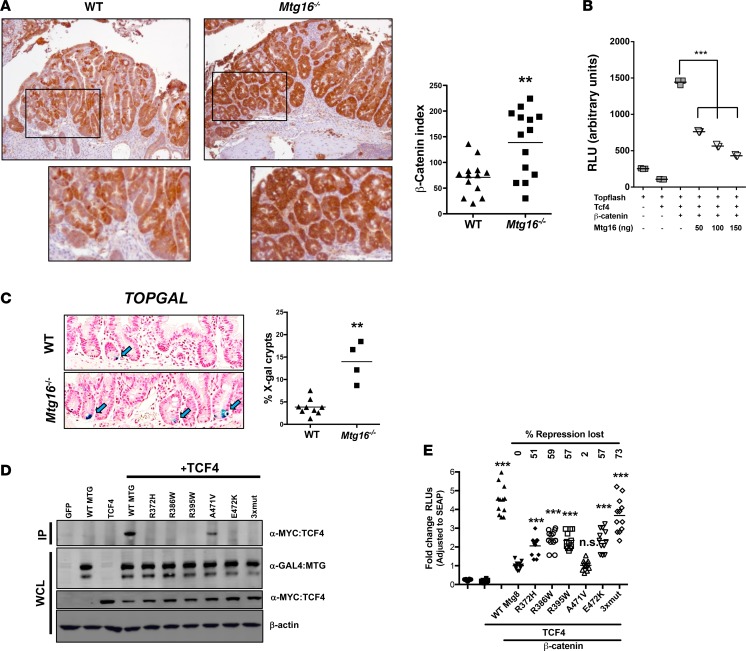
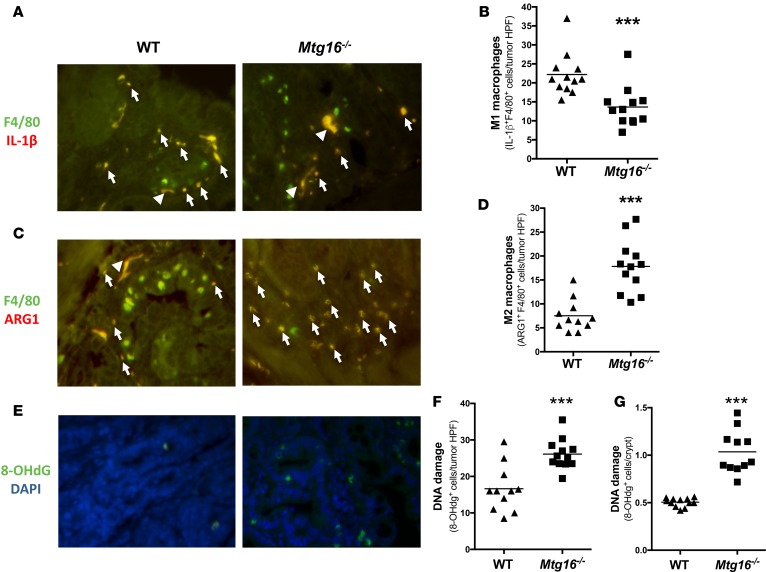
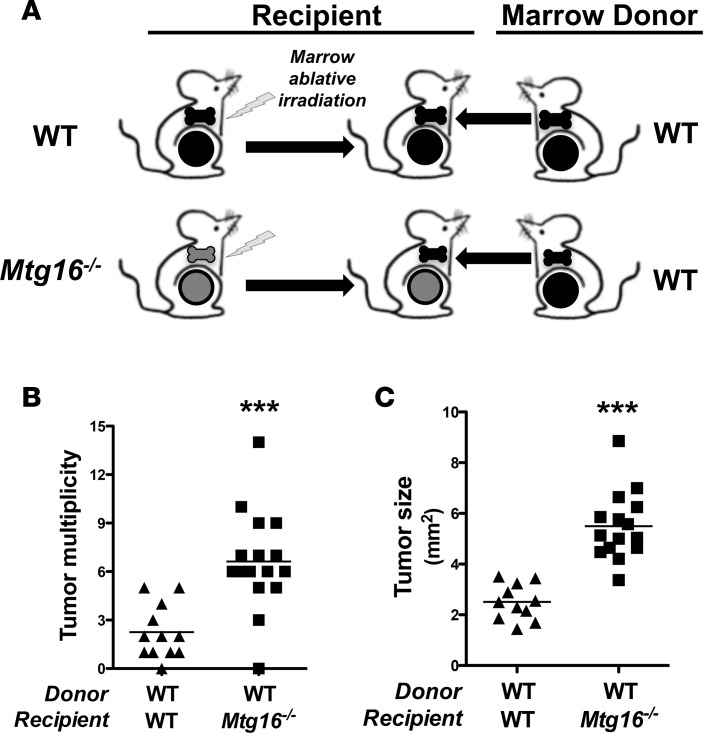
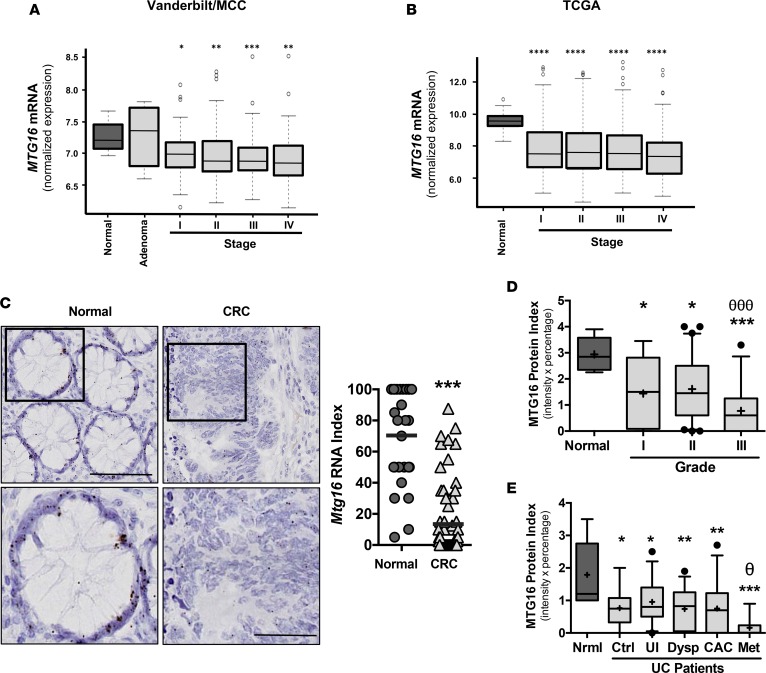
MTG16 is a member of the myeloid translocation gene (MTG) family of transcriptional corepressors. While MTGs were originally identified in chromosomal translocations in acute myeloid leukemia, recent studies have uncovered a role in intestinal biology. For example, Mtg16-/- mice have increased intestinal proliferation and are more sensitive to intestinal injury in colitis models. MTG16 is also underexpressed in patients with moderate/severe ulcerative colitis. Based on these findings, we postulated that MTG16 might protect against colitis-associated carcinogenesis. MTG16 was downregulated at the protein and RNA levels in patients with inflammatory bowel disease and in those with colitis-associated carcinoma. Mtg16-/- mice subjected to inflammatory carcinogenesis modeling exhibited worse colitis and increased tumor multiplicity and size. Loss of MTG16 also increased severity of dysplasia, apoptosis, proliferation, DNA damage, and WNT signaling. Moreover, transplantation of WT marrow into Mtg16-/- mice failed to rescue the Mtg16-/- protumorigenic phenotypes, indicating an epithelium-specific role for MTG16. While MTG dysfunction is widely appreciated in hematopoietic malignancies, the role of this gene family in epithelial homeostasis, and in colon cancer, was unrealized. This report identifies MTG16 as an important modulator of colitis and tumor development in inflammatory carcinogenesis.

Keywords: Gastroenterology; Genetics; Inflammation; Oncology.


Conflict of interest statement

Conflict of interest: The authors have declared that no conflict of interest exists.

Figures

Figure 1
Figure 1. MTG16 is required for survival after colonic injury.
(A) Schematic of azoxymethane/dextran sodium sulfate (AOM/DSS) inflammatory carcinogenesis protocol (top) and Mtg16 mRNA expression in tumors and normal adjacent tissue of C57BL/6 mice treated with 12.5 mg/kg AOM followed by 3 cycles of 2% DSS (bottom) (normal = 3, tumor = 4, Student’s t test, ***P < 0.001). (B) Mortality curves in WT versus Mtg16–/– mice undergoing AOM/DSS treatment protocol (WT = 12, Mtg16–/– = 12, log-rank test). (C) Schematic of reduced dose and duration of AOM/DSS inflammatory carcinogenesis protocol (top) and fractional change in daily weight during the course of the protocol (bottom). DSS administration period is highlighted in gray (WT = 20, Mtg16–/– = 19, Student’s t test). (D) Stool score during each cycle of DSS (WT = 20, Mtg16–/– = 19, Student’s t test). ▲ = WT mice, = Mtg16–/– mice.
Figure 2
Figure 2. Mtg16–/– mice have increased AOM/DSS–induced colonic injury.
(A) Representative endoscopic images from WT and Mtg16–/– mice treated with azoxymethane/dextran sodium sulfate (AOM/DSS) after the second cycle of DSS. (B) Murine endoscopic index of colitis severity (MEICS) scores (WT = 12, Mtg16–/– = 15). (C) Representative histologic images from WT and Mtg16–/– mice (top, ×2.5 magnification; bottom, ×10 magnification). (D) Histologic injury score (WT = 18, Mtg16–/– = 15). Student’s t test *P < 0.05, ***P < 0.001.
Figure 3
Figure 3. MTG16 protects from inflammatory carcinogenesis.
(A) Representative endoscopic images of tumors in WT and Mtg16–/–azoxymethane/dextran sodium sulfate–treated mice (day 35). (B) Tumor multiplicity and (C) tumor size (WT = 30, Mtg16–/– = 29, length × width averaged/mouse, Student’s t test, ***P < 0.001). (D) Representative H&E of WT and Mtg16–/– mice. Red circle highlights an invasive adenocarcinoma (top, ×10 magnification; bottom, ×40 magnification). (E) Percentage of mice displaying highest extent of dysplasia (WT = 30, Mtg16–/– = 29). Fisher’s exact test, ***P < 0.001. LGD, low-grade dysplasia; HGD, high-grade dysplasia; Inv. AC, invasive adenocarcinoma.
Figure 4
Figure 4. Cellular growth kinetics are altered in Mtg16–/– tumors.
(A) Representative images from TUNEL-labeled tumors (×40 magnification) and (B) quantification of intratumoral apoptosis (WT = 9, Mtg16–/– = 12). (C) Representative images (×20 magnification) and (D) quantification of phospho-histone H3 (p-H3) labeling within tumor tissue (WT = 13, Mtg16–/– = 10). (E) Ratio of p-H3/TUNEL in WT versus Mtg16–/– tumors (WT = 9, Mtg16–/– = 6). Student’s t test, *P < 0.05, **P < 0.01, ***P < 0.001.
Figure 5
Figure 5. MTG16 attenuates epithelial proliferation.
(A) Mtg16 mRNA expression (adjusted to Gapdh) and protein levels in different colorectal cancer (CRC) lines with matched human CRC and adjacent normal sample (compared with normal, triplicate samples). NSB, nonspecific band. (B) Immunoblot analysis of MTG16 expression in HCT116 cells, cell growth by MTS assay (triplicate samples) and proliferation as determined by BrdU incorporation 48 hours after plating (vector = 7, MTG16 = 7). (C) Mtg16 mRNA expression (adjusted to GAPDH, triplicate samples), protein levels, change in cell growth by MTS assay (triplicate samples) and cell count (quadruplicate samples) method after 96 hours of siRNA treatment in young adult mouse colon (YAMC) cells using 3 individual siRNAs and 1 pooled siRNA. (D) MTG16 protein levels in different clones (2, 3, and 15) of YAMC cells after CRISPR-mediated knockout of Mtg16, cell growth by MTS assay (triplicate samples) and cellular proliferation by BrdU incorporation (5 samples/each). Each experiment repeated at least 2 times. One-way ANOVA and Newman-Keuls post-test, *P < 0.05, **P < 0.01, ***P < 0.001, ****P < 0.0001. Scr, scrambled; V, vector; ns, not significant.
Figure 6
Figure 6. MTG16 represses Wnt signaling.
(A) β-Catenin expression by immunohistochemistry. Representative images from WT and Mtg16–/– tumors stained for β-catenin (left, images ×10 magnification) and quantification of β-catenin staining index (right, percentage of tumors with nuclear β-catenin multiplied by expression intensity (WT = 13, Mtg16–/– = 14), Student’s t test. (B) MTG16-repressed transcription of TOPFLASH reporter in NIH3T3 cells transfected with increasing amounts of Mtg16, as shown (triplicates and repeated twice). (C) Increased frequency of X-gal–positive crypts in Mtg16–/– mice (left, images ×20 magnification) and quantification of percentage of X-gal–positive crypts (right, WT = 12, Mtg16–/– = 4 mice), Student’s t test. (D) Coimmunoprecipitation of MTG colorectal cancer–associated (CRC-associated) mutants and TCF4 and (E) TOPFLASH assay with individual MTG8 mutants (n = 12/category). One-way ANOVA and Newman-Keuls post-test, **P < 0.01, ***P < 0.001. RLU, relative light units; IP, immunoprecipitation; WCL, whole-cell lysate.
Figure 7
Figure 7. Mtg16–/– tumors display altered intratumoral immune environment and increased DNA damage.
Skewing towards M2 macrophage phenotypes inMtg16–/–tumors. (A) Representative images of IL-1β+/F4/80+ cells in WT and Mtg16–/– tumors; white arrow heads indicate nonspecific staining, white arrows indicate dual staining. (B) Quantification of M1 macrophages per tumor high-power field (HPF) (WT = 12, Mtg16–/– = 12). (C) Representative images of ARG1+/F4/80+ cells in WT and Mtg16–/– tumors and (D) quantification of M2 macrophages per tumor HPF (WT = 12, Mtg16–/– = 12). (E) DNA damage was assessed using 8-hydroxy-2-deoxyguanosine (8-OHdG) immunohistochemical staining. Representative images from tumors and (F) quantification of 8-OHdG+ cells in tumors (WT = 12, Mtg16–/– = 13) and (G) crypts (WT = 12, Mtg16–/– = 12, all representative images at ×40 magnification). Student’s t test, ***P < 0.001.
Figure 8
Figure 8. Restoration of hematopoietic MTG16 fails to rescue Mtg16–/– AOM/DSS phenotype.
(A) Schematic of bone marrow transplant experiment. Fifteen WT and 17 Mtg16–/– mice were irradiated, transplanted with WT bone marrow, allowed to recover 12 weeks, and followed by azoxymethane/dextran sodium sulfate (AOM/DSS) inflammatory carcinogenesis protocol. (B) Mtg16–/– and WT mouse tumor multiplicity (WT = 12, Mtg16–/– = 16) and (C) size (WT = 11, Mtg16–/– = 15). Student’s t test, ***P < 0.001.
Figure 9
Figure 9. MTG16 expression is reduced in human colorectal cancer (CRC) and ulcerative colitis (UC) samples.
(A) Analysis of the combined Moffitt Cancer Center (MCC) and Vanderbilt Medical Center colon tumor expression array data set (10 normal samples, 6 adenomas, 33 stage I, 76 stage 2, 82 stage 3, and 59 stage 4, for a combined total of 250 CRC samples). (B) MTG16 mRNA levels in the indicated CRC stage from TCGA datasets (n = 41 normal samples, 75 stage I, 174 stage II, 126 stage III, 64 stage IV). (C) MTG16 mRNA in situ hybridization was performed on the Vanderbilt CRC tissue microarray (left) and quantified (right). (D) Box-and-whisker plot (line, median; +, mean; hinges, 25th and 75th percentile; whiskers, 10th to 90th percentile) demonstrating MTG16 staining extent (intensity and fraction of biopsy at that intensity) in cores from normal (n = 8), grade I (n = 27), grade II (n = 119), and grade III (n = 51) from human CRC. (E) Box-and-whisker plot (line, median; +, mean; hinges, 25th and 75th percentile; whiskers, 10th to 90th percentile) demonstrating MTG16 staining extent in cores from normal, non-UC patients (normal [Nrml], n = 9), control, noncancer UC patients (control [Ctrl], n = 10), uninvolved UC tissue adjacent to dysplasia (UI, n = 39), dysplastic (Dysp, n = 30), colitis-associated carcinoma (CAC, n = 28), and metastatic (Met, n = 8) tissue from patients with UC. One-way ANOVA and Newman-Keuls post-test were used to compare multiple groups such as those seen with MTG16 protein index in the human CAC array. For expression array and TCGA analysis, Wilcoxon rank-sum test with continuity correction was applied. *P < 0.05, **P < 0.01, ***P < 0.001, ****P < 0.0001 for all categories compared with normal tissue; θP < 0.05 between uninvolved UC and metastatic UC; θθθP < 0.001 between grade I and grade III.

Similar articles

Cited by

References

    1. Beaugerie L, Itzkowitz SH. Cancers complicating inflammatory bowel disease. N Engl J Med. 2015;373(2):195. - PubMed
    1. Adami HO, et al. The continuing uncertainty about cancer risk in inflammatory bowel disease. Gut. 2016;65(6):889–893. doi: 10.1136/gutjnl-2015-311003. - DOI - PMC - PubMed
    1. Rubin DC, Shaker A, Levin MS. Chronic intestinal inflammation: inflammatory bowel disease and colitis-associated colon cancer. Front Immunol. 2012;3:107. - PMC - PubMed
    1. Imam MH, Thackeray EW, Lindor KD. Colonic neoplasia in young patients with inflammatory bowel disease and primary sclerosing cholangitis. Colorectal Dis. 2013;15(2):198–203. doi: 10.1111/j.1463-1318.2012.03133.x. - DOI - PubMed
    1. Torres J, Pineton de Chambrun G, Itzkowitz S, Sachar DB, Colombel JF. Review article: colorectal neoplasia in patients with primary sclerosing cholangitis and inflammatory bowel disease. Aliment Pharmacol Ther. 2011;34(5):497–508. doi: 10.1111/j.1365-2036.2011.04753.x. - DOI - PubMed