. 2017 Aug 17;2(16):e93424.
doi: 10.1172/jci.insight.93424.

VIPAR, a quantitative approach to 3D histopathology applied to lymphatic malformations

Affiliations

VIPAR, a quantitative approach to 3D histopathology applied to lymphatic malformations

René Hägerling et al. JCI Insight. .

Abstract

Background: Lack of investigatory and diagnostic tools has been a major contributing factor to the failure to mechanistically understand lymphedema and other lymphatic disorders in order to develop effective drug and surgical therapies. One difficulty has been understanding the true changes in lymph vessel pathology from standard 2D tissue sections.

Methods: VIPAR (volume information-based histopathological analysis by 3D reconstruction and data extraction), a light-sheet microscopy-based approach for the analysis of tissue biopsies, is based on digital reconstruction and visualization of microscopic image stacks. VIPAR allows semiautomated segmentation of the vasculature and subsequent nonbiased extraction of characteristic vessel shape and connectivity parameters. We applied VIPAR to analyze biopsies from healthy lymphedematous and lymphangiomatous skin.

Results: Digital 3D reconstruction provided a directly visually interpretable, comprehensive representation of the lymphatic and blood vessels in the analyzed tissue volumes. The most conspicuous features were disrupted lymphatic vessels in lymphedematous skin and a hyperplasia (4.36-fold lymphatic vessel volume increase) in the lymphangiomatous skin. Both abnormalities were detected by the connectivity analysis based on extracted vessel shape and structure data. The quantitative evaluation of extracted data revealed a significant reduction of lymphatic segment length (51.3% and 54.2%) and straightness (89.2% and 83.7%) for lymphedematous and lymphangiomatous skin, respectively. Blood vessel length was significantly increased in the lymphangiomatous sample (239.3%).

Conclusion: VIPAR is a volume-based tissue reconstruction data extraction and analysis approach that successfully distinguished healthy from lymphedematous and lymphangiomatous skin. Its application is not limited to the vascular systems or skin.

Funding: Max Planck Society, DFG (SFB 656), and Cells-in-Motion Cluster of Excellence EXC 1003.

Keywords: Dermatology; Vascular Biology.


Conflict of interest statement

Conflict of interest: The authors have declared that no conflict of interest exists.

Figures

Figure 1
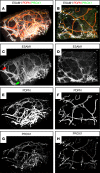
Figure 1. Spatial arrangement of blood and lymphatic vessels in the human dermis visualized by light-sheet–based microscopy.
A whole-mount immunostained human skin biopsy from a healthy control was analyzed using light-sheet microscopy (ultramicroscopy). Shown are projections of 3D computer reconstructions generated using the volume visualization framework Voreen. The depicted antigens are indicated in their respective colors on top of the images. ESAM1 served as a general endothelial marker, PROX1 acted as a transcription factor marker, and podoplanin (PDPN) identified lymphatic endothelial cells. (A, C, E, and G) Visualization of the tissue volume with the papillary dermis located at top and the cutaneous plexus at the bottom. (B, D, F, and H) Digitally rotated view of the same specimen, showing the vessels of the papillary plexus viewed en face through the epidermis. (A and C) Papillary and cutaneous lymphatic and blood vessel plexuses are distinctly visible (red arrow, papillary plexus; green arrow, cutaneous plexus). (B, F, and H) Valves, identified by condensed high PROX1 expression (between opposing white arrows), were regularly detected in connecting lymphatic (precollector) vessels of the papillary plexus. Blind-ending lymphatic capillaries are marked by white asterisks. Scale bars: 100 μm.
Figure 2
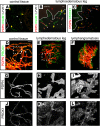
Figure 2. Light-sheet microscopy–based analysis of healthy and diseased skin biopsies reveals lymph vessel defects that are unrecognizable in microtome sections.
(AC) Immunohistological detection of vascular markers in microtome sections of healthy control (A) and patient (B and C) lower limb skin biopsies. ESAM1, endothelial marker; PDPN, LYVE1, and PROX1, lymphatic-specific endothelial markers. Lumenized blood (yellow arrows) and lymphatic vessels (white arrowheads) are indicated. Dashed line depicts the border between epidermis (indicated by red asterisks) and dermis. Scale bars: 100 μm. (DL) Maximum intensity projections of image stacks derived by light-sheet microscopy (UltraMicroscope II) of whole-mount immunostained control (D, G, and J) and patient skin biopsies (E, F, H, I, K, and L). Image stacks were rendered using the volume visualization framework Voreen. Detected antigens and respective colors are indicated. (D and F) Lymphatic valve areas (identified by high PROX1 expression) are marked by white arrows; valve areas were absent in patient biopsies (E and F). Specimens are depicted such that the epidermal layer is located on the top of the picture (red asterisks). Note acanthosis and hyperkeratosis in patient biopsy (B and C). Scale bars: 100 μm.
Figure 3
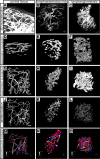
Figure 3. Automated segmentation of the lymphatic vasculature in digital 3D volume reconstructions of control and patient skin biopsies.
Skin biopsies whole-mount immunostained for PDPN were subjected to light-sheet–based microscopy (UltraMicroscope II), and the obtained image stacks were visualized using the volume visualization framework Voreen (AC, also shown in Figure 2, D–F). Lymphatic vessel surfaces were extracted from the volume reconstruction by automatic segmentation of a subvolume using a random walker approach, followed by postprocessing. Spatial 3D renderings of the specimen are shown from a lateral view where the epidermis is located atop the depiction (xz projection, DF) and following a virtual 90° rotation around the x axis, from the en face view of the skin, i.e., seen through the epidermis (xy projection, GI). In the control sample, this view largely corresponds to the lymphatic vessels of the papillary plexus. Subsequently vessels were skeletonized (JL), followed by detection and classification of the branching points of the vessel convolutes (colored dots in MO). The rotational position of the rendered specimen in space is indicated by the axis indicators in the panels.
Figure 4
Figure 4. Quantitative parameters distinguish the lymphatic vascular network in control and patient skin biopsies following automated extraction of vessel shape and connectivity characteristics.
Parameters that distinguished the control sample (n = 1) from the lymphedematous (n = 1) and lymphangiomatosis sample (n = 1) were calculated from automatically extracted vessel shape and connectivity data. (AF) The line in the box-and-whisker plots in represents the median, the boxes represent the upper and lower quartile, and the end of the whiskers represent the 1.5-fold interquartile range. (G and H) Results of the connectivity analysis for (G) total branching point degree and (H) the higher per-edge branching degree. The total branching point analysis is cantered on the spheres forming each node, while the higher degree per-edge analysis for each segment considers the maximum branching degree of both connected nodes. A total branching point degree of zero therefore represents spherical vascular elements, whereas a higher per-edge branching degree of one represents the number of elongated, nonconnected, nonbranched vascular elements. Note the decreased segment length and distance in lymphedema- and lymphangiomatosis-affected samples as well as the increased number of spherical and elongated, nonbranched vessel elements in the lymphedematous sample. Supplemental Figure 3 provides an overview of the definitions of the extracted parameters depicted in Figure 4. Mann-Whitney U test with a Bonferroni correction for multiple comparison was used to compare data between groups. **P < 0.01, ***P < 0.001.
Figure 5
Figure 5. Automated segmentation of the blood vasculature in digital 3D volume reconstructions of control and diseased skin biopsies.
(AC) Digitally generated spatial reconstructions of image stacks obtained by light-sheet–based microscopy (UltraMicroscope II) of skin biopsies, which were whole-mount immunostained for ESAM1. Biopsies were either from the lower leg of a healthy control (A, D, and G) or lymphedematous leg skin (B, E, and H) or a lymphangiomatous skin biopsy (C, F, and I). Scale bars: 100 μm. Computer reconstruction and rendering was performed using the volume visualization framework Voreen. (DF) Identified by ESAM1 immunostaining, the blood vascular network was segmented in a semiautomated fashion and is represented by digital volume rendering. (GI) Following skeletonization, an automated determination of vessel branching points the vascular network was performed allowing a classifying node analysis. Note the exceptional level of complexity within the healthy control tissue sample that was still successfully segmented, skeletonized, and analyzed for automated data extraction. Areas of high background signal intensity (B, E, and H, red broken circle) can result in false-positive signals, while a low foreground signal (C, F, and I, red broken ellipse) may result in false-negative segmentation results.
Figure 6
Figure 6. Determination of distinguishing characteristic parameters of the blood vessels in healthy and patient samples.
Following segmentation and skeletonization, the segment properties of the blood vasculature in three different control skin biopsies (n = 3), the lymphedematous skin biopsy (n = 1), and the lymphangiomatous skin biopsy (n = 1) were quantified, according to the definitions provided in Supplemental Figure 3. (A) Distance describes the length of the direct connection between branching points. (B) Segment length corresponds to the length of the center line of a vessel between two branching points. (C) The volume of the corresponding vessel segment is calculated from the total number of voxels associated with the segment. The vessel cross section is calculated as the quotient of volume and length. Data are presented as box-and-whisker plots, with the line depicting the median, the boxes showing upper and lower quartile, and the end of the whiskers representing the 1.5-fold interquartile range. Note the increased segment length and distance in lymphedematous and lymphangiomatous skin biopsies. Mann-Whitney U test with a Bonferroni correction for multiple comparison was used to compare data between groups. *P < 0.05, **P < 0.01, ***P < 0.001.

References

    1. Schulte-Merker S, Sabine A, Petrova TV. Lymphatic vascular morphogenesis in development, physiology, and disease. J Cell Biol. 2011;193(4):607–618. doi: 10.1083/jcb.201012094. - DOI - PMC - PubMed
    1. Mortimer PS, Rockson SG. New developments in clinical aspects of lymphatic disease. J Clin Invest. 2014;124(3):915–921. doi: 10.1172/JCI71608. - DOI - PMC - PubMed
    1. Alitalo K. The lymphatic vasculature in disease. Nat Med. 2011;17(11):1371–1380. doi: 10.1038/nm.2545. - DOI - PubMed
    1. Aspelund A, Robciuc MR, Karaman S, Makinen T, Alitalo K. Lymphatic system in cardiovascular medicine. Circ Res. 2016;118(3):515–530. doi: 10.1161/CIRCRESAHA.115.306544. - DOI - PubMed
    1. Kutkut I, Meens MJ, McKee TA, Bochaton-Piallat ML, Kwak BR. Lymphatic vessels: an emerging actor in atherosclerotic plaque development. Eur J Clin Invest. 2015;45(1):100–108. doi: 10.1111/eci.12372. - DOI - PubMed