. 2017 Aug 16;8(1):266.
doi: 10.1038/s41467-017-00366-1.

Genetic regulatory effects modified by immune activation contribute to autoimmune disease associations

Affiliations

Genetic regulatory effects modified by immune activation contribute to autoimmune disease associations

Sarah Kim-Hellmuth et al. Nat Commun. .

Abstract

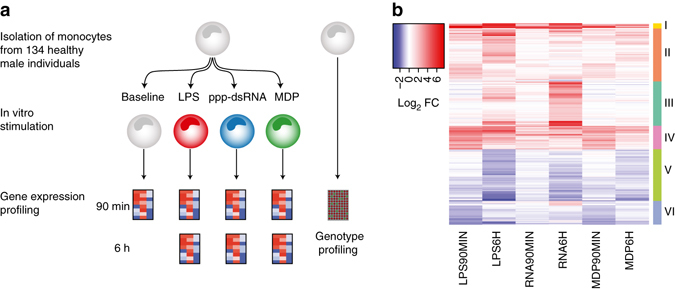
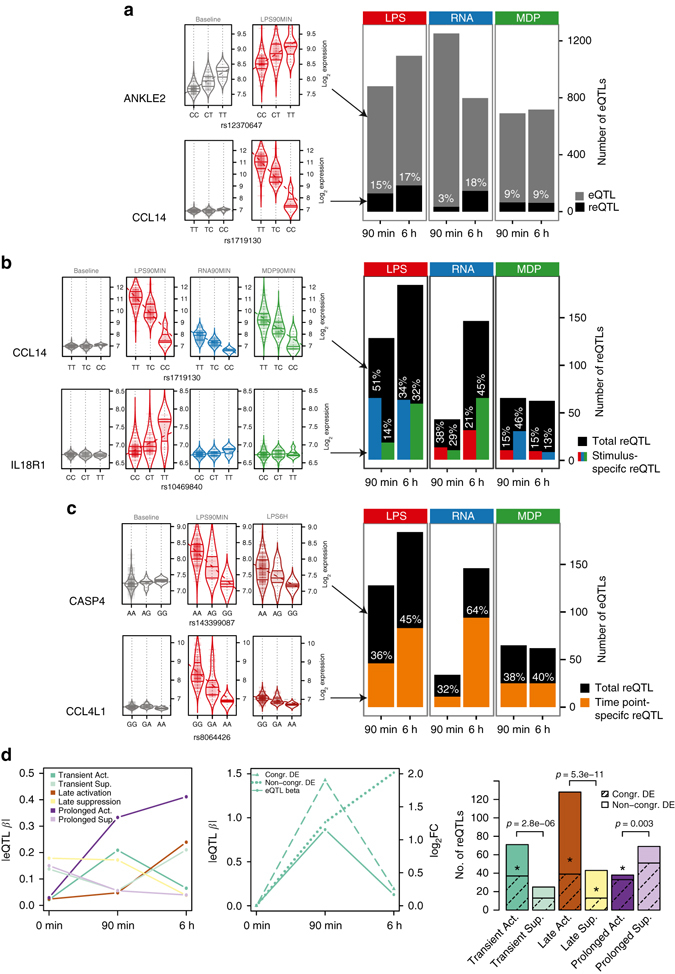
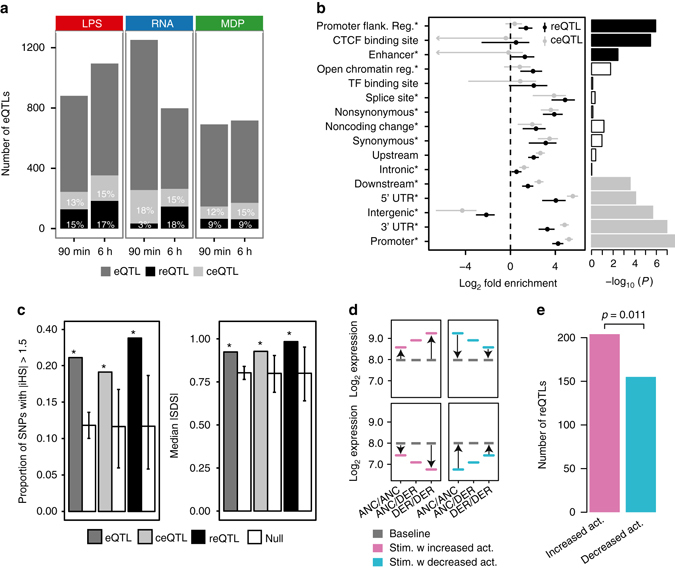
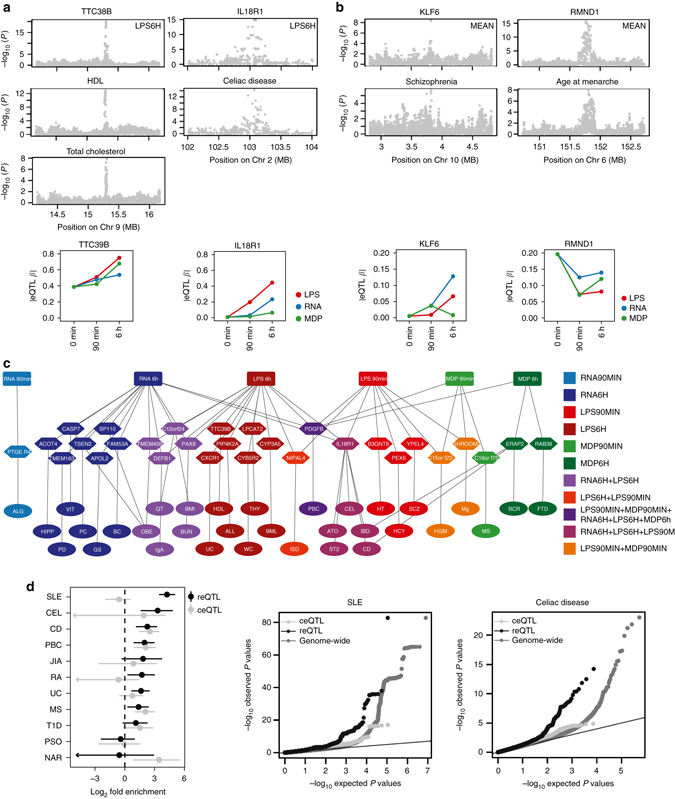
The immune system plays a major role in human health and disease, and understanding genetic causes of interindividual variability of immune responses is vital. Here, we isolate monocytes from 134 genotyped individuals, stimulate these cells with three defined microbe-associated molecular patterns (LPS, MDP, and 5'-ppp-dsRNA), and profile the transcriptomes at three time points. Mapping expression quantitative trait loci (eQTL), we identify 417 response eQTLs (reQTLs) with varying effects between conditions. We characterize the dynamics of genetic regulation on early and late immune response and observe an enrichment of reQTLs in distal cis-regulatory elements. In addition, reQTLs are enriched for recent positive selection with an evolutionary trend towards enhanced immune response. Finally, we uncover reQTL effects in multiple GWAS loci and show a stronger enrichment for response than constant eQTLs in GWAS signals of several autoimmune diseases. This demonstrates the importance of infectious stimuli in modifying genetic predisposition to disease.Insight into the genetic influence on the immune response is important for the understanding of interindividual variability in human pathologies. Here, the authors generate transcriptome data from human blood monocytes stimulated with various immune stimuli and provide a time-resolved response eQTL map.


Conflict of interest statement

The authors declare no competing financial interests.

Figures

Fig. 1
Fig. 1
Overview of the eQTL study and transcriptional immune response in primary human monocytes. a Step-wise experimental design to identify genetic effects on immune response in human monocytes. (1) Isolation and stimulation of primary monocytes from 134 individuals, (2) Transcriptome measurement of the entire cohort at two time points (90 min and 6 h) after stimulation, (3) Genotype profiling to map immune response eQTLs. b Mean mRNA profiles of differentially expressed genes (log2-fold change > 1, FDR 0.001) of 134 individuals between baseline and each of the six stimulated conditions. Genes are hierarchically clustered into six distinct expression patterns (Supplementary Data 1 for a full list of the differential expression and enriched pathways of each cluster)
Fig. 2
Fig. 2
Immune response eQTL study in human monocytes. a Total numbers of cis eQTLs and proportions of reQTLs of LPS-treated (LPS), 5′-ppp-dsRNA (RNA) and MDP-treated (MDP) monocytes at 90 min and 6 h after stimulation. Results of the analysis of 134 individuals are shown unless indicated otherwise. eQTLs include all genes with a significant genetic association in each stimulated condition, and reQTLs are a subset that show a significant difference of the regression slope between untreated and stimulated monocytes, with violin plots shown as examples. The untreated condition has 1653 eQTLs that are not shown in the bar plot. b Numbers of reQTLs and proportions of treatment-specific reQTLs where the regression slope of the tested treatment is different from the slope of the other two treatments within the same time point, with violin plots shown as examples and the color of bar indicating the treatment that was tested. c Numbers of reQTLs and proportions of time point-specific reQTLs where the regression slope of the tested time point is different from the slope of the other time point within the same treatment, with violin plots shown as examples. d reQTLs were divided into six subsets according to their temporal activity (see Methods section). Average of absolute eQTL effect sizes per category is shown on the left panel. The middle panel illustrates a reQTL example with congruent differential expression (DE) (dashed line) or non-congruent DE (dotted line) of the eGene. reQTL distribution to different categories is shown in the right panel, where the shaded portion illustrates the proportion of reQTLs with congruent DE of the eGene and asterisks represent the significance of enrichment of reQTLs with congruent DE of the eGene (Fisher’s exact test *p<0.05). The p-values above the bars indicate the significance between of active and suppressive types (binomial test)
Fig. 3
Fig. 3
Functional annotations and signs of natural selection in reQTLs. a Total numbers of cis eQTLs, and proportions of reQTLs and constant eQTLs (ceQTL) that have similar regression slopes across all conditions. Results of the analysis of 134 individuals are shown unless indicated otherwise. Examples of a ceQTL and reQTL are shown in Supplementary Fig. 8a. b Forest plot of enrichment estimates of reQTL and ceQTL signals for each functional annotation with 95% confidence intervals (see also Supplementary Fig. 5b). Asterisks indicate annotations that improved the model likelihood in a stepwise procedure for the final best-fitting model. Bar plot shows the enrichment of the single most likely causal SNP per locus after fine mapping. The solid bars indicate significant enrichments after Bonferroni correction. c Signal of positive selection measured as the proportion of variants with high |iHS| (left panel), and median |SDS| (right panel), using the variant with the maximum value from each locus across all SNPs in high LD (r 2 > 0.8). Genome-wide null sets of variants matched to eQTL, ceQTL or reQTL were generated by resampling 10,000 sets of random SNPs that matched for MAF and LD (white bars). Error bars indicate minimum and maximum of the null distribution, and asterisks indicate the significant enrichment compared to the null (permutation test p < 10−4). d Illustration of reQTLs where the derived allele causes an increase (left panel) or decrease (right panel) in response amplitude compared to the ancestral allele. The increase or decrease of the response amplitude can be in both directions, e.g., reQTLs that amplify the induction or amplify the suppression of a gene are both considered as reQTLs with “increasing activity” of the derived allele and reQTLs that weaken the induction or suppression of a gene are both considered as reQTLs with “decreasing activity” of the derived allele. e Numbers of reQTLs with increased or decreased activity across all stimulated conditions, with a p-value from a binomial test
Fig. 4
Fig. 4
Immune response modifies genetic associations to disease. a Manhattan plots of eQTL (top panels) and disease (middle panels) p-values in colocalized loci. The bottom panels show the dynamics of corresponding eQTL effect sizes in different conditions. b Two additional GWAS loci colocalize when the mean of gene expression across all seven conditions is used to map eQTLs (see Methods section). c Overlap of GWAS SNPs that are in high LD (r 2 > 0.8) with reQTLs in monocytes with disease phenotypes connected to reQTL genes and corresponding immune stimulations. Supplementary Data 4 for trait abbreviations. d Genome-wide enrichment of reQTL and ceQTL associations in autoimmune GWAS with 95% confidence intervals (left panel), and Quantile–quantile (Q–Q) plots for SLE (middle panel) and Celiac disease (right panel). Supplementary Fig. 10b for additional Q–Q plots, and Supplementary Fig. 11 and Supplementary Fig. 12 for results of non-autoimmune traits

References

    1. Brodin P, Davis MM. Human immune system variation. Nat. Rev. Immunol. 2017;17:21–29. doi: 10.1038/nri.2016.125. - DOI - PMC - PubMed
    1. Gat-Viks I, et al. Deciphering molecular circuits from genetic variation underlying transcriptional responsiveness to stimuli. Nat. Biotechnol. 2013;31:342–349. doi: 10.1038/nbt.2519. - DOI - PMC - PubMed
    1. Li Y, et al. A functional genomics approach to understand variation in cytokine production in humans. Cell. 2016;167:1099–1110.e14. doi: 10.1016/j.cell.2016.10.017. - DOI - PubMed
    1. Oosting M, et al. Functional and genomic architecture of borrelia burgdorferi-induced cytokine responses in humans. Cell Host. Microbe. 2016;20:822–833. doi: 10.1016/j.chom.2016.10.006. - DOI - PubMed
    1. Villani AC, et al. Single-cell RNA-seq reveals new types of human blood dendritic cells, monocytes, and progenitors. Science. 2017;356:eaah4573. doi: 10.1126/science.aah4573. - DOI - PMC - PubMed

Publication types

MeSH terms