. 2017 Jul 26:2017:21-29.
eCollection 2017.

Enabling Comprehension of Patient Subgroups and Characteristics in Large Bipartite Networks: Implications for Precision Medicine

Affiliations

Enabling Comprehension of Patient Subgroups and Characteristics in Large Bipartite Networks: Implications for Precision Medicine

Suresh K Bhavnani et al. AMIA Jt Summits Transl Sci Proc. .

Abstract

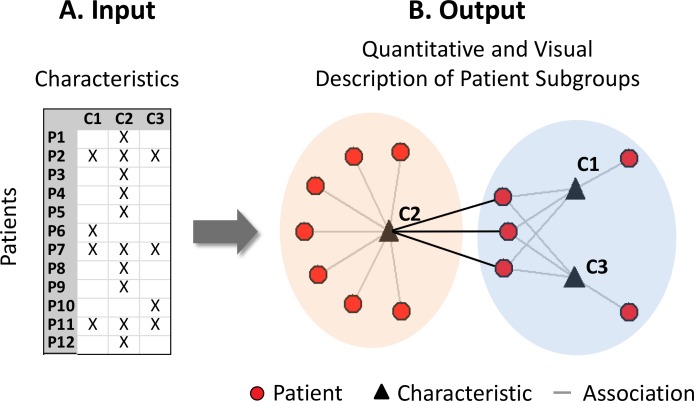
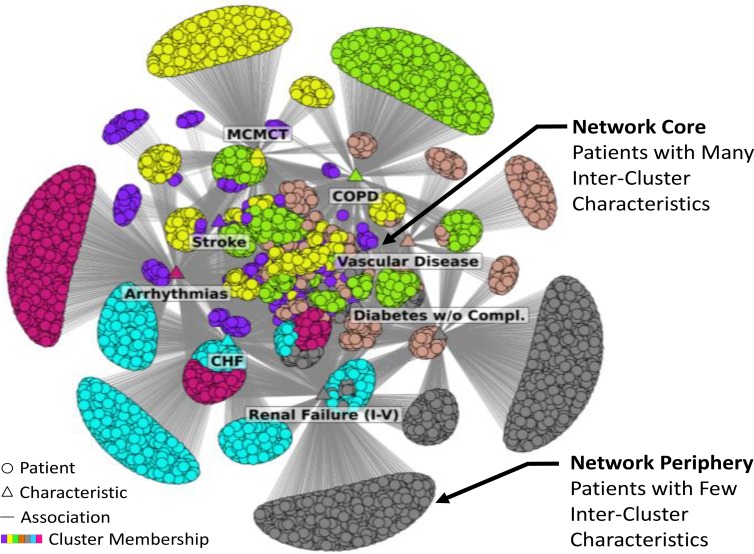
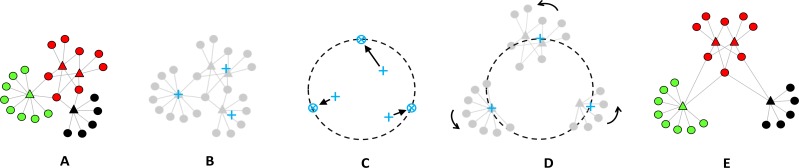
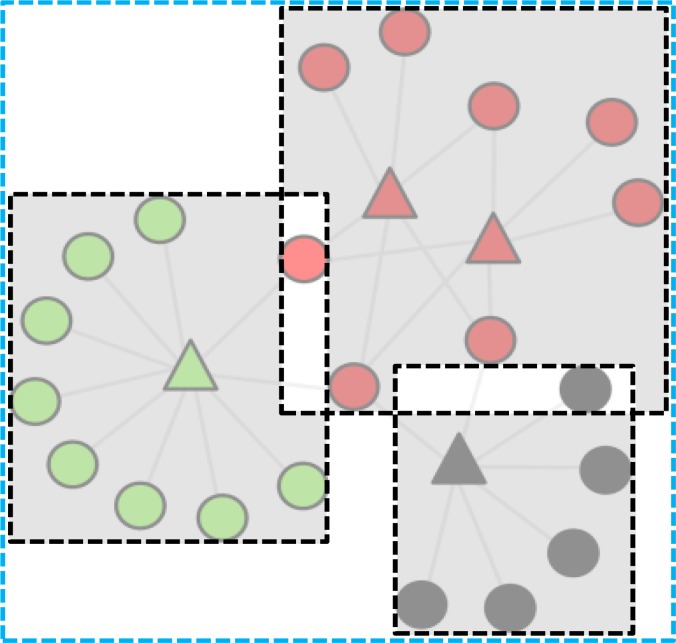
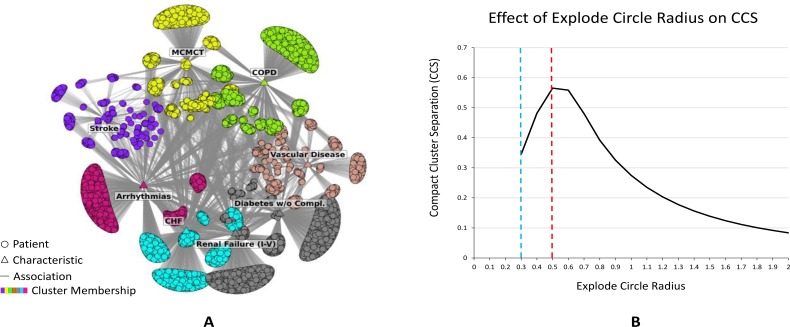
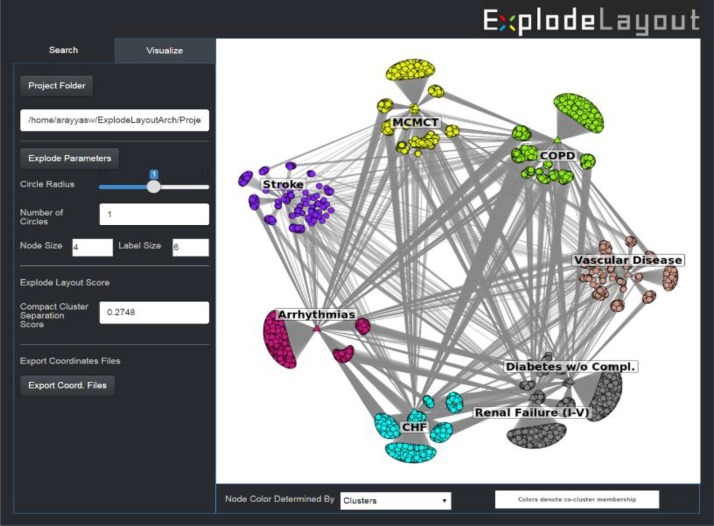
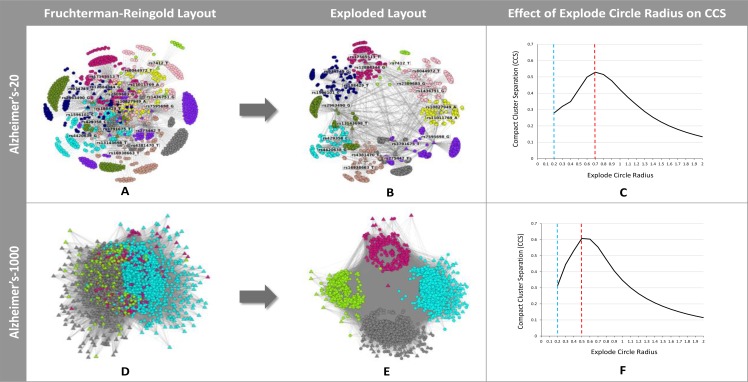
A primary goal of precision medicine is to identify patient subgroups based on their characteristics (e.g., comorbidities or genes) with the goal of designing more targeted interventions. While network visualization methods such as Fruchterman-Reingold have been used to successfully identify such patient subgroups in small to medium sized data sets, they often fail to reveal comprehensible visual patterns in large and dense networks despite having significant clustering. We therefore developed an algorithm called ExplodeLayout, which exploits the existence of significant clusters in bipartite networks to automatically "explode" a traditional network layout with the goal of separating overlapping clusters, while at the same time preserving key network topological properties that are critical for the comprehension of patient subgroups. We demonstrate the utility of ExplodeLayout by visualizing a large dataset extracted from Medicare consisting of readmitted hip-fracture patients and their comorbidities, demonstrate its statistically significant improvement over a traditional layout algorithm, and discuss how the resulting network visualization enabled clinicians to infer mechanisms precipitating hospital readmission in specific patient subgroups.


Figures

Figure 1.
Figure 1.
Bipartite networks of patients and characteristics are designed to automatically generate the number, size and significance of patient subgroups, and a visualization showing relationships within and across patient subgroups.
Figure 2.
Figure 2.
Bipartite network of 6150 readmitted hip fracture patients extracted from the 2010 Medicare database that had at least one of 8 significant comorbidities. Despite strong and significant clustering, the network had highly overlapped clusters in the center of the network, resulting in a core- periphery network topology
Figure 3.
Figure 3.
Exploded view of an assembled mechanical part where the components have been exploded in the horizontal and vertical axes to reveal details of their shape, while preserving their adjacency relationships to the other components in the assembly.
Figure 4.
Figure 4.
The ExplodeLayout algorithm takes as input node coordinates generated from any force-directed layout algorithm, and cluster membership of each node generated from any clustering algorithm (A), calculates the centroid of each cluster (B), places n equidistant points around a circle (whose center is at the centroid of the entire network, and whose radius is determined by a search) such that n=number of clusters, and moves all nodes in each cluster such that its centroid is on the closest point on the circle (C), rotates each cluster around its centroid to match its original orientation (D), and reconnects the nodes resulting in the exploded network (E).
Figure 5.
Figure 5.
The compact cluster separation (CCS) score is the ratio of the total non-overlapped areas of the minimum bounding boxes for each cluster (sum of the gray shaded areas), to the total area of the entire network (area enclosed by the blue dashed rectangle).
Figure 6.
Figure 6.
(A) Network layout after application of the ExplodeLayout algorithm to the original layout of the readmission network shown in Fig. 2. (B) The effect of changing the explode radius on the CCS score for the readmission network. The dashed blue line shows the explode circle radius for the FR layout shown in Figure 2, and the dashed red line shows the explode circle radius corresponding to the maximum CCS score.
Figure 7.
Figure 7.
ExplodeLayout interface provides the ability to change the radius of the explosion through a scroll bar, which enabled users to explore other explosion radii in the vicinity of the optimal explosion suggested by the algorithm.
Figure 8.
Figure 8.
Network layouts before and after application of the ExplodeLayout algorithm for the Alzheimer’s-20 and Alzheimer’s-1000 networks, and the respective CCS scores (the dashed blue line shows the explode circle radius for the corresponding FR layout, and the dashed red line shows the explode circle radius corresponding to the maximum CCS score).

References

    1. McClellan J, King MC. Genetic heterogeneity in human disease. Cell. 2010;141(2):210–217. - PubMed
    1. Waldman SA, Terzic A. Therapeutic targeting: a crucible for individualized medicine. Clinical Pharmacology & Therapeutics. 2008;83(5):651–654. - PubMed
    1. Fitzpatrick AM, Teague WG, Meyers DA, et al. Heterogeneity of severe asthma in childhood: confirmation by cluster analysis of children in the National Institutes of Health/National Heart, Lung, and Blood Institute Severe Asthma Research Program. The Journal of allergy and clinical immunology. 2011;127(2):382–389. e381–313. - PMC - PubMed
    1. Collins FS, Varmus H. A new initiative on precision medicine. The New England journal of medicine. 2015;372(9):793–795. - PMC - PubMed
    1. Sorlie T, Perou CM, Tibshirani R, et al. Gene expression patterns of breast carcinomas distinguish tumor subclasses with clinical implications. Proceedings of the National Academy of Sciences of the United States of America. 2001;98(19):10869–10874. - PMC - PubMed

LinkOut - more resources