. 2017 Nov;92(11):1204-1213.
doi: 10.1002/ajh.24888. Epub 2017 Sep 25.

Bone morphogenetic protein 2 controls iron homeostasis in mice independent of Bmp6

Affiliations

Bone morphogenetic protein 2 controls iron homeostasis in mice independent of Bmp6

Susanna Canali et al. Am J Hematol. 2017 Nov.

Abstract

Hepcidin is a key iron regulatory hormone that controls expression of the iron exporter ferroportin to increase the iron supply when needed to support erythropoiesis and other essential functions, but to prevent the toxicity of iron excess. The bone morphogenetic protein (BMP)-SMAD signaling pathway, through the ligand BMP6 and the co-receptor hemojuvelin, is a central regulator of hepcidin transcription in the liver in response to iron. Here, we show that dietary iron loading has a residual ability to induce Smad signaling and hepcidin expression in Bmp6-/- mice, effects that are blocked by a neutralizing BMP2/4 antibody. Moreover, BMP2/4 antibody inhibits hepcidin expression and induces iron loading in wildtype mice, whereas a BMP4 antibody has no effect. Bmp2 mRNA is predominantly expressed in endothelial cells of the liver, where its baseline expression is higher, but its induction by iron is less robust than Bmp6. Mice with a conditional ablation of Bmp2 in endothelial cells exhibit hepcidin deficiency, serum iron overload, and tissue iron loading in liver, pancreas and heart, with reduced spleen iron. Together, these data demonstrate that in addition to BMP6, endothelial cell BMP2 has a non-redundant role in hepcidin regulation by iron.


Conflict of interest statement

CONFLICT OF INTEREST DISCLOSURES

JLB has ownership interest in Ferrumax Pharmaceuticals, which has licensed technology from the Massachusetts General Hospital based on work cited here and in prior publications. All other authors have nothing to declare.

Figures
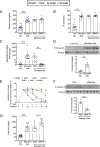
Figure 1
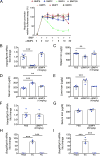
Figure 1. Dietary iron loading induces liver hepcidin expression and Smad phosphorylation in Bmp6−/− mice, effects that are blocked by a neutralizing BMP2/4 antibody
Bmp6−/− mice were fed a low iron diet for 3 weeks upon weaning, and then kept on the low iron diet or switched to a standard diet for 1 week, either alone or in combination with 10mg/kg neutralizing BMP2/4 antibody (αBmp2/4) IP dosed every other day or an equal volume of vehicle alone (PBS). Mice were analyzed for serum iron (A), transferrin saturation (B), liver hepcidin (Hamp) relative to Rpl19 mRNA expression by qRT-PCR (C), liver phosphorylated Smad1/5 (P-Smad1/5) relative to total Smad5 by immunoblot and chemiluminescence quantitation (D, F), and liver iron content (G). n=5–11 males (blue circles) and 3–6 females (red triangles) per group in panels A, B, C, G. A subset of 5 mice per group was analyzed in panels D, F. Bars represent mean ± SEM. For qRT-PCR experiments, the average of low iron diet mice was set to 1. * P<.05, ** P<.01, ***P<.001 relative to the low iron diet or PBS group by Student’s t test. E) Hep3B cells were transfected with a hepcidin promoter firefly luciferase reporter and pRL-TK Renilla luciferase control reporter, followed by treatment without or with 50 ng/ml BMP2, BMP4, BMP2/6, BMP6, BMP5, BMP7, or 5ng/ml BMP9 for 16 hours in combination with 0 to 30 µg/ml αBMP2/4. Relative luciferase activity of ligand-treated cells in the absence of αBMP2/4 was set to 100%. Values represent mean ± SEM of 5 experiments for BMP2, BMP4, and BMP6, and 3 experiments for other BMPs, each performed in triplicate.
Figure 2
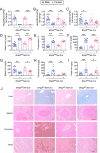
Figure 2. Bmp2 is predominantly expressed in liver endothelial cells, and neutralizing BMP2/4 antibody, but not BMP4 antibody, reduces Hamp mRNA and induces iron loading in wildtype mice
A) Hep3B cells were transfected with a hepcidin promoter firefly luciferase reporter and pRL-TK Renilla luciferase control reporter, followed by treatment without or with 50 ng/ml BMP2, BMP4, BMP2/6, BMP6, BMP5, BMP7 or 5ng/ml BMP9 for 16 hours in combination with 0 to 30 µg/ml neutralizing BMP4 antibody (αBMP4). Relative luciferase activity was analyzed as in Figure 1E. Values represent mean ± SEM of 2 experiments, each performed in triplicate. B–E) Eight-week-old male wildtype mice received an IP injection of 10 mg/kg αBmp2/4, 10 mg/kg αBmp4, or PBS alone daily for 3 days. Animals were analyzed for liver Hamp relative to Rpl19 mRNA expression by qRT-PCR (B), spleen iron content (C), serum iron (D), and liver iron content (E). F–G) Eight-week-old male wildtype mice were injected with 20 mg/kg αBmp4 or PBS alone daily for 3 days. Animals were analyzed for liver Hamp relative to Rpl19 mRNA expression by qRT-PCR (F) and serum iron (G). A–G) n=4–6 mice per group. Bars represent mean ± SEM. For qRT-PCR results, the average of PBS treated mice was set to 1. ** P<.01, ***P<.001 relative to the PBS group by one-way ANOVA with Dunnett’s post hoc test (B–E) or Student’s t test (F–G). H–I) Hepatocytes, endothelial cells (EC), and Kupffer cells (KC) were isolated from wildtype male mouse livers (n=3 mice) and analyzed for Bmp2 (H) and Bmp6 mRNA (I) by qRT-PCR. Transcripts were normalized to Rpl19 and the average expression from KCs was set to 1. Bars represent mean ± SEM. ***P<.001 for ECs relative to hepatocytes and KCs by one-way ANOVA with Tukey post hoc test.
Figure 3
Figure 3. Mice with a conditional ablation of Bmp2 in endothelial cells (Bmp2fl/fl;Tek-Cre+) exhibit reduced liver Bmp2 and Hamp mRNA expression, serum iron overload, tissue iron overload in liver, heart, and pancreas, and reduced spleen iron
Eight-week-old littermate male (blue circles) and female (red triangles) Bmp2fl/fl;Tek-Cre+ mice compared with littermate controls (Bmp2fl/fl;Tek-Cre−) were analyzed for total liver Bmp2 (A), Hamp (B), and Id1 (C) relative to Rpl19 mRNA by qRT-PCR; serum iron (D); transferrin saturation (E); and tissue iron in liver (F,J), spleen (G,J), pancreas (H,J), and heart (I,J) by biochemical analysis (F–I) or Perls’ Prussian blue (J, liver and spleen) or DAB-enahanced Perls’ stain (J, pancreas and heart). n=4–13 mice per gender per group. Bars represent mean ± SEM. For qRT-PCR results, the average of Cre- mice for each gender was set to 1. Tissues from one representative mouse per group are shown in J (original magnification ×20; scale bar represents 100µm). *P<.05, **P<.01, ***P<.001 relative to the respective Cre- controls by Student’s t test.
Figure 4
Figure 4. Iron regulates liver Bmp2 mRNA expression to a lesser extent than Bmp6 and alters the ratio of Bmp2 to Bmp6
A) Eight-week-old littermate male (blue circles) and female (red triangles) Bmp2fl/fl;Tek-Cre+ mice compared with littermate controls (Bmp2fl/fl;Tek-Cre−) were analyzed for total liver Bmp6 relative to Rpl19 mRNA by qRT-PCR. n=4–13 mice per gender per group. Bars represent mean ± SEM. The average of Cre- mice for each gender was set to 1. ***P<.001 relative to the respective Cre- controls by Student’s t test. B–C) C57BL/6 male mice were treated with a standard diet (380 ppm, Ctrl) compared to a low iron diet (2–6 ppm, B) or high iron diet (2% carbonyl iron, ~20,000 ppm, C) for 3 weeks followed by analysis of total liver Bmp2 and Bmp6 mRNA relative to Rpl19 expression by qRT-PCR. n=6–12 mice per group. Bars represent mean ± SEM. The average of standard diet mice was set to 1. **P< .01, ***P<.001 relative to standard diet mice by Student’s t test. D) Liver endothelial cells were isolated by FACS from 129S6/SvEvTac male mice treated with an iron sufficient diet (40 ppm) or a 1% carbonyl iron supplemented diet (~10,000 ppm) for 4 weeks, and Bmp2 and Bmp6 copy numbers were quantitated by qRT-PCR. Fold difference in Bmp2 relative to Bmp6 copy number for each diet is shown above bars. Fold change for each ligand on 1% carbonyl iron diet compared to iron sufficient diet is shown inside bars. n=4–6 mice per group. **P< .01, ***P<.001 for Bmp2 compared with Bmp6 expression for each diet.

References

    1. Dev S, Babitt JL. Overview of iron metabolism in health and disease. Hemodial Int. 2017;21(Suppl 1):S6–S20. - PMC - PubMed
    1. de Benoist B, McLean E, Egli I, Cogswell M. WHO Global Database on Anaemia. Geneva: World Health Organization; 2008. World prevalence of anaemia 1993–2005. http://www.who.int/nutrition/publications/micronutrients/anaemia_iron_de...
    1. Jomova K, Valko M. Advances in metal-induced oxidative stress and human disease. Toxicology. 2011;283:65–87. - PubMed
    1. Pietrangelo A. Iron and the liver. Liver Int. 2016;36:116–123. - PubMed
    1. Camaschella C, Nai A. Ineffective erythropoiesis and regulation of iron status in iron loading anaemias. Br J Haematol. 2016;172:512–523. - PubMed

MeSH terms