. 2017 Oct;37(10):3278-3299.
doi: 10.1177/0271678X17724681. Epub 2017 Aug 17.

New astroglial injury-defined biomarkers for neurotrauma assessment

Affiliations

New astroglial injury-defined biomarkers for neurotrauma assessment

Julia Halford et al. J Cereb Blood Flow Metab. 2017 Oct.

Abstract

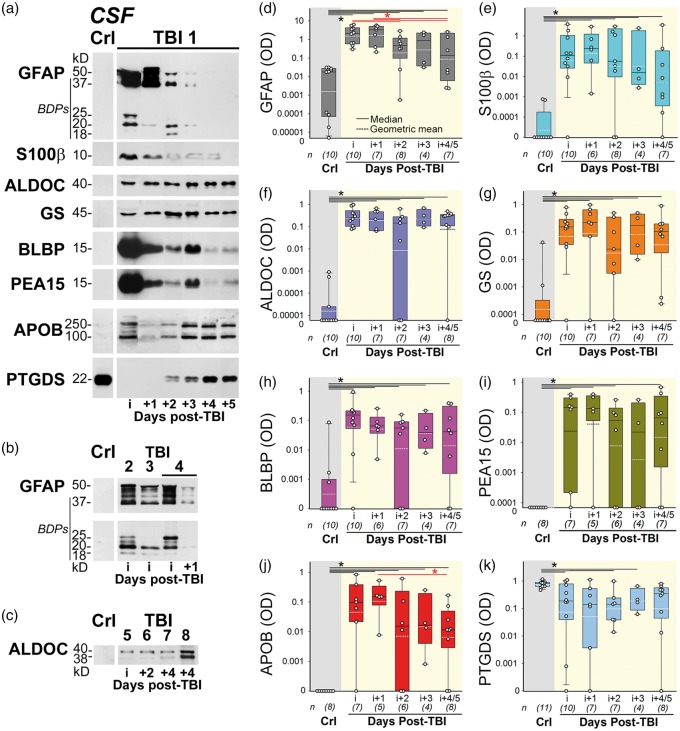
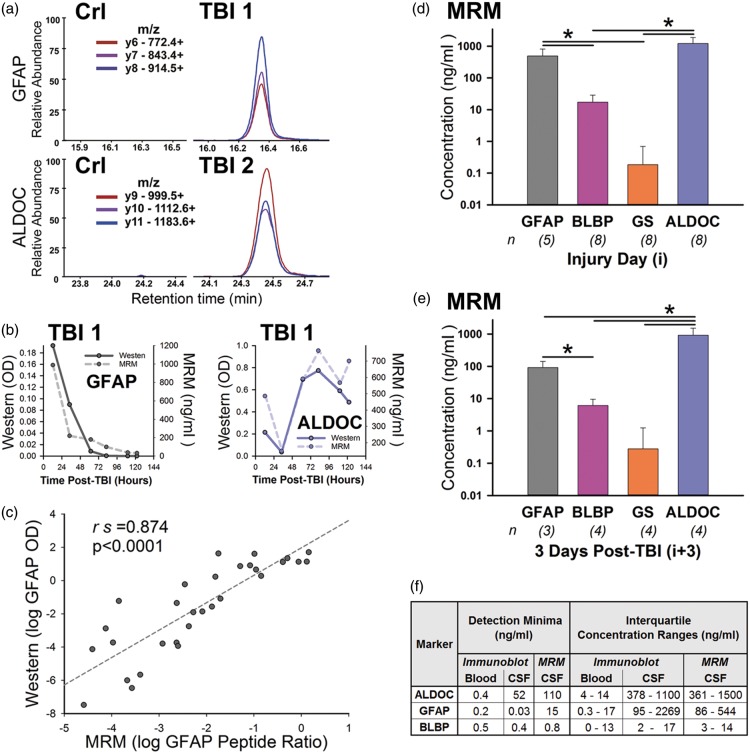
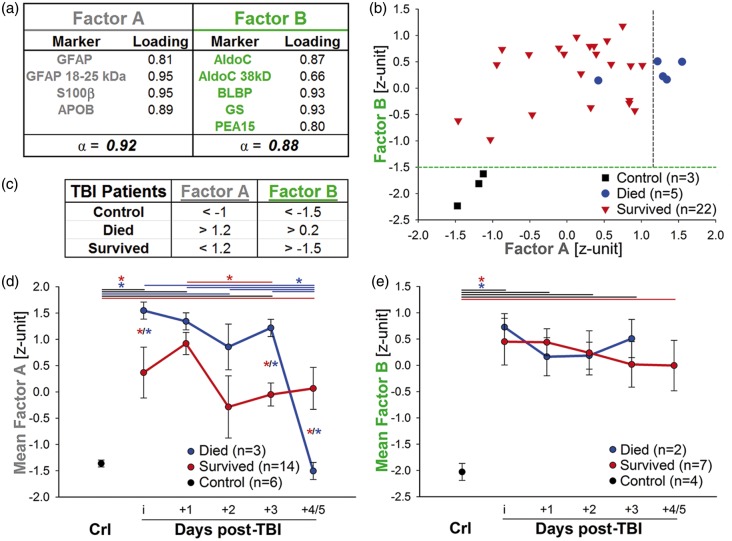
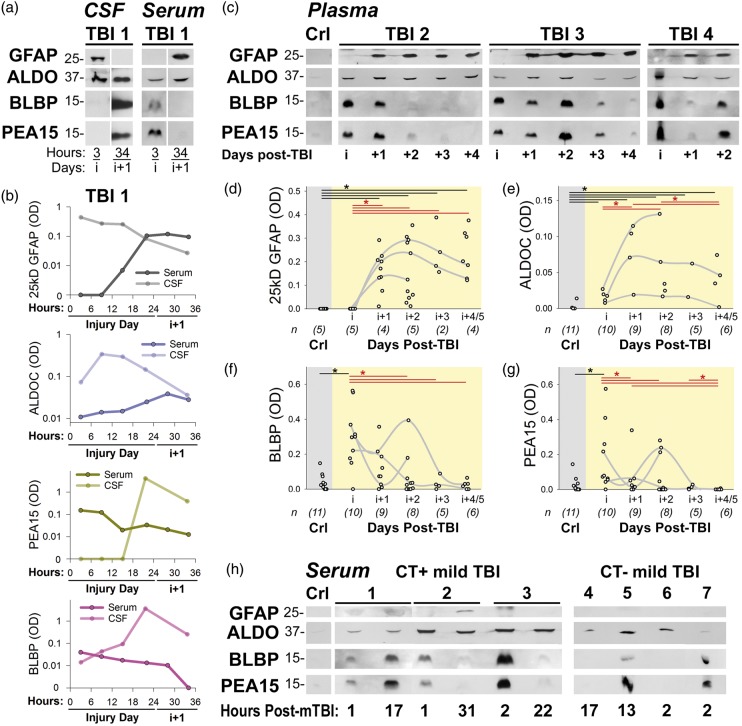
Traumatic brain injury (TBI) is an expanding public health epidemic with pathophysiology that is difficult to diagnose and thus treat. TBI biomarkers should assess patients across severities and reveal pathophysiology, but currently, their kinetics and specificity are unclear. No single ideal TBI biomarker exists. We identified new candidates from a TBI CSF proteome by selecting trauma-released, astrocyte-enriched proteins including aldolase C (ALDOC), its 38kD breakdown product (BDP), brain lipid binding protein (BLBP), astrocytic phosphoprotein (PEA15), glutamine synthetase (GS) and new 18-25kD-GFAP-BDPs. Their levels increased over four orders of magnitude in severe TBI CSF. First post-injury week, ALDOC levels were markedly high and stable. Short-lived BLBP and PEA15 related to injury progression. ALDOC, BLBP and PEA15 appeared hyper-acutely and were similarly robust in severe and mild TBI blood; 25kD-GFAP-BDP appeared overnight after TBI and was rarely present after mild TBI. Using a human culture trauma model, we investigated biomarker kinetics. Wounded (mechanoporated) astrocytes released ALDOC, BLBP and PEA15 acutely. Delayed cell death corresponded with GFAP release and proteolysis into small GFAP-BDPs. Associating biomarkers with cellular injury stages produced astroglial injury-defined (AID) biomarkers that facilitate TBI assessment, as neurological deficits are rooted not only in death of CNS cells, but also in their functional compromise.

Keywords: Astrocytes; brain trauma; cell culture; cerebrospinal fluid; exploratory factor analysis; proteomics.


Figures

Figure 1.
Figure 1.
Biomarkers show diverse temporal CSF profiles during the first week after TBI. (a) Immunoblots of 30 µl CSF samples show GFAP (50 kD with BDPs 37, 25, 20 and 18 kD), S100 β (10 kD), ALDOC (40 kD), GS (45 kD), BLBP (15 kD) and PEA15 (15 kD) on injury day (i) and five post-injury days (i + 1 to i + 5) in a severe TBI patient (TBI 1, clinical data see Supplementary Table 1(b)). These data are shown alongside a control (Crl). Bleeding indicator APOB (130 + 250 kD) varied over time post injury and was absent in control. CSF standard PTGDS (22 kD) had robust signal in Crl but was absent immediately after TBI with slow recovery. (b) CSF samples (30 µl/lane) from three TBI patients (TBI 2 to 4) showed variable GFAP levels, exhibiting full size signal in addition to both large breakdown products (50–37 kD BDPs) and small BDPs (25 kD, 20 + 18 kD) on injury day and day i + 1. Control lacked GFAP signal. (c) CSF immunoblots (30 µl/lane) show full size ALDOC in four TBI patients (TBI 5 to 8) and variable intensity of a 38 kD ALDOC-BDP on i + 4 in two patients (TBI 7, 8). Control lacked ALDOC signal. (d–k) Box-and-whisker plots show median (black line) and geometric means (white dashed line) of exposure-normalized CSF immunoblot optical densities (OD) of astroglial biomarkers, APOB and PTGDS from 20–25 TBI patients (on injury day to day i + 5) and 8–11 Controls. Individual data points are shown, and data shown on a log-spaced axis. Data from post-injury days 4 and 5 were combined, as values did not differ significantly (repeated measures mixed ANOVA). n = subject numbers listed for each day, and same day replicates were averaged. See Supplementary Methods for quantification. (d) Total GFAP was elevated on all TBI days (*p < 0.05) but declined over indicated times (red asterisk, *p < 0.002). (e) S100 β levels were higher on all TBI days versus controls (*p < 0.0022). (f) ALDOC (p < 0.004) and (g) GS (p < 0.001) were elevated on all TBI days without significant decline over time. (h) BLBP (p < 0.03) and (i) PEA15 (p < 0.004) were elevated after TBI on indicated days. (j) APOB was elevated in TBI versus Crl (*p < 0.005). (k) PTGDS decreased variably on indicated TBI days versus Crl (*p < 0.004), with mean PTGDS level recovering four to five days post TBI.
Figure 2.
Figure 2.
MRM mass spectrometry and concentration comparison of AID biomarkers. (a) MRM-MS traces biomarker-specific peptides for GFAP and ALDOC in severe TBI CSF (TBI 1, 2) and from a control (Crl). Three product ion traces (y6-11) with given mass over charge (m/z) values and retention times (min, x-axis) are shown. They are from precursor ions with m/z 549.816 (GFAP) and m/z 526.970 (ALDOC). (b) Immunological and mass spectrometry measurements show comparable TBI CSF temporal profiles for GFAP and ALDOC in longitudinal CSF samples of a severe TBI patient (TBI 1). Biomarker levels were measured using immunoblot densitometry (continued lines show ODs, left y-axes) and multiple reaction monitoring-mass spectrometry, MRM-MS (dashed lines, ng/ml, right y-axes). (c) Biplot shows TBI patients’ CSF log MRM-MS data for the GFAP peptide using endogenous divided by standard ion transition ratios (x-axis) and GFAP log immunoblot ODs (y-axis) with regression line and Spearman correlation (rs = 0.874, p < 0.0001) to demonstrate strong agreement between the two methods. (d) Mean MRM-MS concentrations for GFAP, BLBP, GS and ALDOC in TBI CSF on injury day (n = patient numbers). ALDOC had 2.5-fold higher concentrations than GFAP on injury day (not significant). GFAP and ALDOC concentrations were over two orders larger than those of BLBP (p < 0.001) and over three orders higher than those of GS (p < 0.002). (e) Mean MRM-MS biomarker CSF concentrations on the third post-injury day after TBI. Mean ALDOC concentration was 10-fold higher than that of GFAP (p = 0.008). BLBP levels were lower than those of ALDOC and GFAP (p < 0.001) and ALDOC levels were three orders larger than those of GS (p = 0.02). (f) ALDOC, GFAP and BLBP interquartile concentration ranges were estimated from immunoblot densities using known amounts of pure proteins and calculated from MRM-MS signals using known amounts of isotope-labeled biomarker-specific peptides as standards. Reported detection thresholds are from 30 µl analyzed in immunoblots and 2 µl in MRM-MS.
Figure 3.
Figure 3.
Exploratory factor analysis simplifies and classifies the biomarker panel based on different CSF kinetics. (a) Unsupervised exploratory factor analysis (EFA) grouped biomarkers S100 β, GFAP, small GFAP-BDPs and APOB into Factor A (gray) and ALDOC, ALDOC-BDP, BLBP, GS and PEA15 into Factor B (green). Each biomarker’s loading and both factors’ correlation coefficient (Cronbach’s α) document strong inter-relatedness of biomarkers within each factor. (b) The biplot combines signals from nine biomarkers, giving CSF levels in z-units from 12 subjects with Factor A on x-axis and Factor B on y-axis. The Factors partitioned control from TBI using a Factor B threshold (green dashed line) and survivors from nonsurvivors of TBI using a Factor A threshold (gray dashed line). n = number of observations with available readings for all nine biomarkers. (c) Table reports the classification tree boundaries (factor thresholds, z-units) for partitioning between control subjects, died and survived TBI patients. (d) Longitudinal profiles of Factor A standardized means are plotted for survivors (red) and nonsurvivors (blue) of TBI over five post-injury days, documenting a significant decrease from injury day onwards, indicated with lines for respective groups (black = all TBI, p < 0.005). Factor A differed between TBI survivors and nonsurvivors significantly on post-injury days marked with double-asterisks (*/*, p < 0.03, effect size = 1). (e) Factor B means were elevated in TBI versus controls (p < 0.001), remained elevated over five post-injury days but did not differ with respect to survival; n = number of subjects.
Figure 4.
Figure 4.
AID biomarkers appear hyper-acute and robust in blood of severe and mild TBI patients. (a) Immunoblots show that small GFAP-BDPs, ALDOC, BLBP and PEA15 appear in CSF and serum at different times when compared in one severe TBI patient (TBI 1) at 3 and 34 h post injury (i and i + 1). (b) Temporal profiles of same markers are plotted for concurrent CSF (light lines) and serum (dark lines) samples of the same patient. Biomarker increase in serum correlates with decrease in CSF. ALDOC, PEA15 and BLBP were present in serum earlier than GFAP. (c) Immunoblot of 30 µl depleted plasma samples show signals for 25kD-GFAP-BDP, aldolase A + C (ALDO, mab E9), PEA15 and BLBP in three severe TBI patients on injury day and two to four post-injury days (TBI 2, 3, 4). Corresponding signals are absent in control. (d–g) Scatterplots show biomarker levels in plasma with temporal profiles for (d) 25 kD-GFAP-BDP, (e) ALDOC (isoform-specific mab 5C9), (f) BLBP and (g) PEA15. Consecutive samples from the same patient are connected by a gray line. (d) 25 kD-GFAP-BDP was absent on injury day in all TBI patients, but was elevated on post-injury days 1–5 (p < 0.0001). (e) ALDOC levels were elevated on TBI injury day by 88-fold over control (black lines, asterisk, *p < 0.027). On the following two post-injury days, ALDOC levels rose > 300-fold over controls (black lines, asterisk (*p < 0.009) with levels on i + 1 and i + 2 significantly above those of injury day (red lines, asterisk: *p < 0.027). On i + 3 and i + 4, ALDOC mean levels decreased (red lines, asterisk, *p < 0.05). (f) Mean BLBP levels were elevated on injury day by 122-fold (black line, asterisk, *p = 0.007), remained elevated on i + 1 and decreased subsequently (red line, asterisk, *p < 0.02). (g) PEA15 levels increased on TBI injury day by 40-fold (black line, asterisk, *p = 0.02) and decreased thereafter (red line, asterisk, *p < 0.04). (h) Immunoblots show 30 µl depleted serum samples from mild TBI patients at early post-injury hours. The same film exposures are shown for mild and severe TBI samples. In mTBI, ALDO (mab E9), BLBP and PEA15 signals co-varied, while 25 kD-GFAP-BDP signal was weak or absent. mTBI patients one to three had reported CT scan findings (CT-positive, + ) while mTBI four to seven had no brain injury-associated CT findings (CT-negative, −). See Supplementary Table 1(c) for mTBI patient details.
Figure 5.
Figure 5.
Mechanical trauma causes acute membrane wounding, reactivity and delayed cell death in human astrocytes. (a) GFAP (green) is weakly expressed in uninjured, differentiated neocortical human astrocytes. (b) Reactive astrocytes 1d post injury were star-shaped with enlarged processes and upregulated GFAP. (c) Acutely wounded, mechanoporated astrocytes 30 min after stretching had bright GFAP signals and beaded, disintegrated (arrows) or amputated (*) processes in cells that had taken up PI (red). (d) Nuclear morphologies distinguish intact cells with large, oval-shaped Höchst-stained nuclei (pale blue). Leaky, membrane-wounded astrocytes had same shape and Höchst-stained nuclei but with PI-positive nucleoli (pink). Dead astrocytes had small nuclei with condensed chromatin (pyknotic), which were bright Höchst- and PI- stained (pink). (e) Counted leaky cell medians were elevated at 30 min (p < 0.0001) and 2d post injury (p < 0.01) after mild (2.6–4.0 PSI, formula image
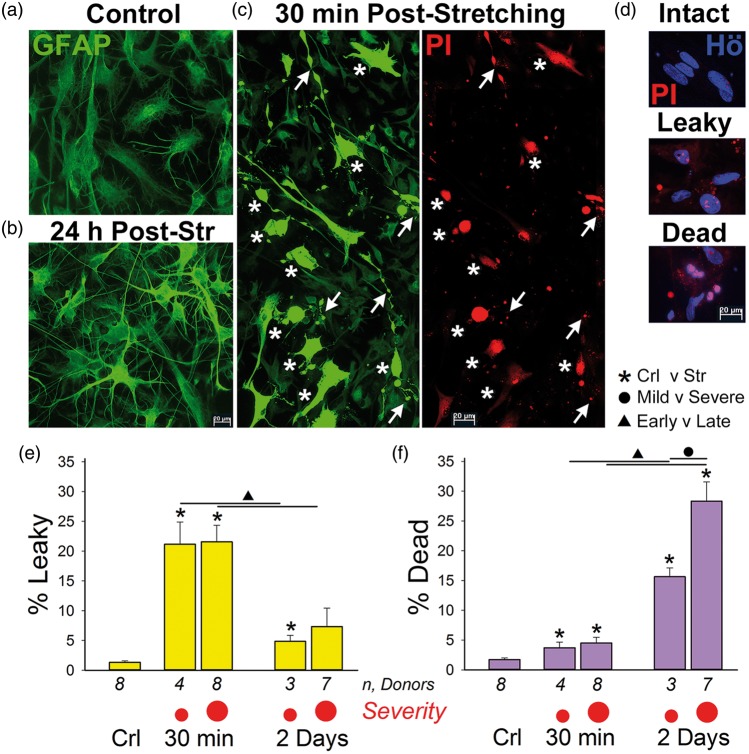
, small red dot) and severe (4.4–5.3 PSI, large red dot, formula image, p < 0.001) stretching. Leaky-cell fractions decreased between 30 min and 2d post injury (Δ, p < 0.01). (f) Median cell death numbers were slightly elevated at 30 min (*p < 0.05, mild; *p < 0.01 severe). Cell death substantially increased by 2d after stretching from 30 min (Δ, p < 0.0001, 2d difference to unstretched were *p < 0.01, mild; *p < 0.001, severe). A severity difference in cell death means was found at 2d post injury between mild and severely stretched cultures (indicated by a black dot • p < 0.001).
Figure 6.
Figure 6.
Human astroglial biomarker release is defined by membrane wounding and cell death after mechanical trauma. (a) Immunoblots from concentrated conditioned medium (fluid) of unstretched (control, Crl), mild stretched (2.6–4 psi, small red dot, formula image
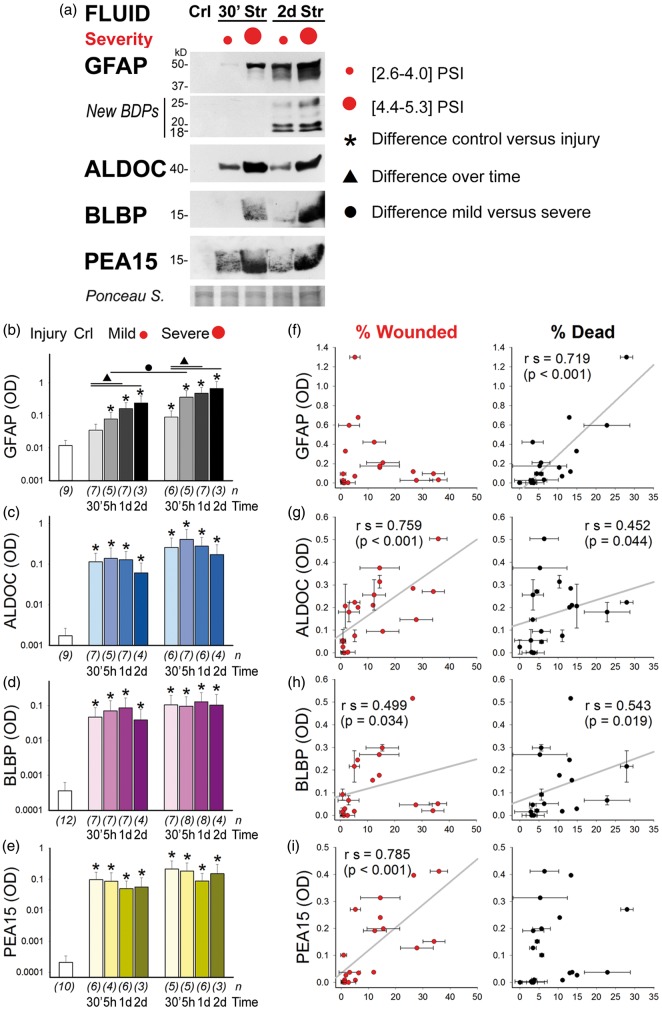
) and severe stretched (4.4–5.3 psi, large red dot, formula image) astrocyte cultures are shown at 30 min (30′) and 2d post injury. Blots show fluid signals for GFAP, ALDOC, BLBP and PEA15. Small GFAP-BDPs (25–18 kD) were absent at 30 min and present by 2d post injury, whereas ALDOC, BLBP and PEA15 were present 30 min post injury and at 2d. Ponceau S shows total protein amount for 30 µl fluid per lane. (b–e) Geometric means of optical densities (OD) for (b) GFAP, (c) ALDOC, (d) BLBP and (e) PEA15 are plotted for unstretched, 30 min, 5 h, 1d and 2d mild and severe stretched cultures. All stretched fluid samples show significant biomarker elevation compared to those of unstretched fluids (*GFAP 5 h mild stretch: p = 0.005, all others p < 0.001; n = number of donors). The exception was that GFAP elevation in fluids was only threefold (p > 0.05) 30 min after mild stretching. In contrast, 30-min mild stretched cultures had significantly elevated levels of ALDOC (66-fold), BLBP (130-fold), and PEA15 (460-fold, all *p < 0.001). GFAP release levels increased over indicated times (see lines and ▴, p < 0.02). GFAP levels showed severity difference at 5 h after stretching (•, p = 0.042). Severity differences for ALDOC, BLBP and PEA15 were two-threefold and not significant. (f–i) Biplots correlate biomarker levels on y-axes with percent wounded astrocytes (red, leaky) and percent dead cells (black) on x-axes. Spearman correlations (rs) are given with p-values and lines of best fit. Error bars are standard deviations of replicate analyses. (f) GFAP correlated only with cell death rates. (g) ALDOC and (h) BLBP correlated with cell wounding and cell death. (i) PEA15 correlated only with cell wounding.
Figure 7.
Figure 7.
Acute cell wounding is associated with depletion of astroglial markers and GFAP filament disruption. PI-dye uptake for membrane leak was combined with biomarker immunofluorescence in control and stretched human astrocytes 30 min after injury. (A1) Intact PI-negative control astrocytes displayed filament-assembled fibrous GFAP (white). (A2) Leaky PI-positive astrocytes (pink in nuclei, arrows) had homogeneous non-fibrous GFAP. (B1) Control astrocytes show bright BLBP staining (green). (B2) Stretched leaky astrocytes had dim BLBP staining. Control cultures show ubiquitous (C1) ALDOC and (D1) PEA15 expression. (C2) Stretched cultures at 30 min post injury had leaky astrocytes (PI-positive, red, arrows) showing plasmalemmal blebbing (arrowheads) and dim ALDOC signals. (D2) PEA15 positive and negative cells were seen 30 min post stretch. Leaky PI-positive cells lacked PEA15 signals (arrows). (e–h) Pie charts show cell fate and marker scoring results corresponding to events in micrographs for four to seven cultures per condition and biomarker. (e) Proportions of fibrous (striped) and non-fibrous (gray) GFAP in populations of intact (blue ring) and leaky (pink ring) astrocytes. Stretching increased non-fibrous GFAP in intact/resealed (p = 0.006) and leaky populations (p < 0.001, n = 5). (f) The population of bright BLBP-stained, GFAP-positive astrocytes decreased 30 min after stretching and was nearly absent in leaky cells (p = 0.007, n = 5, see Supplementary Figure S4 for biomarker double-labeling). (g) Most intact control astrocytes were ALDOC-positive (green). Stretching increased the fraction of ALDOC-depleted cells compared to controls (p < 0.03), with greater numbers of ALDOC-depleted cells among leaky than among resealed/intact subpopulations (p < 0.001, n = 6). (h) Most intact control astrocytes were PEA15-positive. Percentage of PEA15-positive astrocytes diminished 30 min after stretching (p < 0.01), with larger depleted fractions among leaky than among intact/resealed stretched cells (p < 0.0001, n = 6). (i) Percent GFAP-expressing astrocytes with fibrous and non-fibrous patterns in control and in acutely post-stretch astrocytes are plotted. The shift from fibrous to non-fibrous GFAP was significant early post injury (*p < 0.01), but the reduction of overall GFAP-expressing cells was not significant. (j) Percentages of cells with bright and dim biomarker signals differed between control and 30-min post-stretch cultures for BLBP (*p = 0.007), ALDOC (*p = 0.001) and PEA15 (*p = 0.003). (k) Single-cell measurements of immunofluorescence intensities show the decrease in BLBP, ALDOC and PEA15 signals 30-min post injury versus signals in control cells (*p < 0.001, n = 3–5 cultures).

Similar articles

Cited by

References

    1. Roozenbeek B, Maas AI, Menon DK. Changing patterns in the epidemiology of traumatic brain injury. Nat Rev Neurol 2013; 9: 231–236. - PubMed
    1. Rosenbaum SB, Lipton ML. Embracing chaos: the scope and importance of clinical and pathological heterogeneity in mTBI. Brain Imag Behav 2012; 6: 255–282. - PubMed
    1. Buki A, Kovacs N, Czeiter E, et al. Minor and repetitive head injury. Adv Tech Stand Neurosurg 2015; 42: 147–192. - PubMed
    1. Helmick KM, Spells CA, Malik SZ, et al. Traumatic brain injury in the US military: epidemiology and key clinical and research programs. Brain Imag Behav 2015; 9: 358–366. - PubMed
    1. Montenigro PH, Alosco ML, Martin BM, et al. Cumulative head impact exposure predicts later-life depression, apathy, executive dysfunction, and cognitive impairment in former high school and college football players. J Neurotrauma 2016; 34: 328–340. - PMC - PubMed

MeSH terms