

Evaluating Which Dose-Function Metrics Are Most Critical for Functional-Guided Radiation Therapy
- PMID: 28816147
- PMCID: PMC5603256
- DOI: 10.1016/j.ijrobp.2017.03.051
Evaluating Which Dose-Function Metrics Are Most Critical for Functional-Guided Radiation Therapy
Abstract
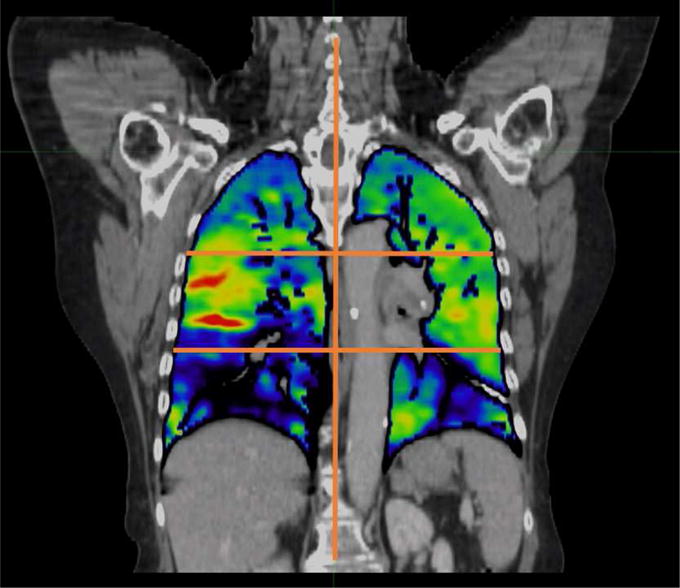
Purpose: Four-dimensional (4D) computed tomography (CT) ventilation imaging is increasingly being used to calculate lung ventilation and implement functional-guided radiation therapy in clinical trials. There has been little exhaustive work evaluating which dose-function metrics should be used for treatment planning and plan evaluation. The purpose of our study was to evaluate which dose-function metrics best predict for radiation pneumonitis (RP).
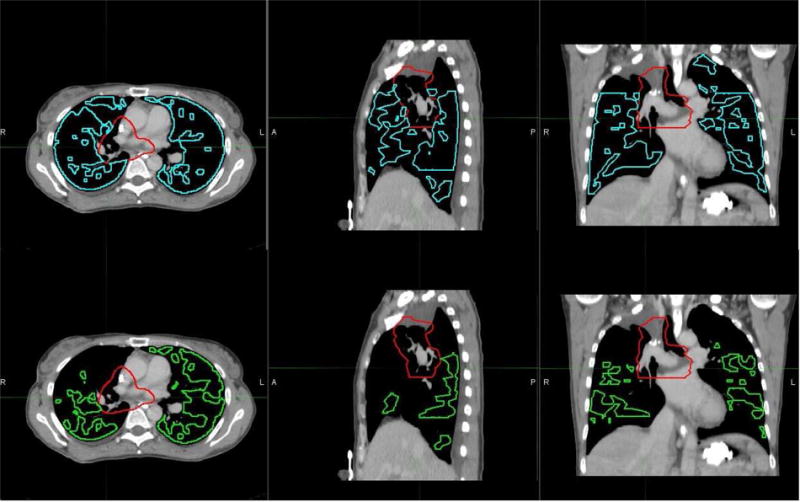
Methods and materials: Seventy lung cancer patients who underwent 4D CT imaging and pneumonitis grading were assessed. Pretreatment 4D CT scans of each patient were used to calculate ventilation images. We evaluated 3 types of dose-function metrics that combined the patient's 4D CT ventilation image and treatment planning dose distribution: (1) structure-based approaches; (2) image-based approaches using the dose-function histogram; and (3) nonlinear weighting schemes. Log-likelihood methods were used to generate normal tissue complication probability models predicting grade 3 or higher (ie, grade 3+) pneumonitis for all dose-function schemes. The area under the curve (AUC) was used to assess the predictive power of the models. All techniques were compared with normal tissue complication probability models based on traditional, total lung dose metrics.
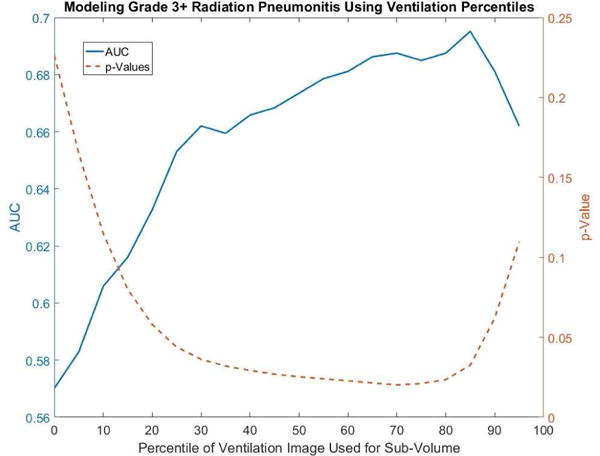
Results: The most predictive models were structure-based approaches that focused on the volume of functional lung receiving ≥20 Gy (AUC, 0.70). Probabilities of grade 3+ RP of 20% and 10% correspond to V20 (percentage of volume receiving ≥20 Gy) to the functional subvolumes of 26.8% and 9.3%, respectively. Imaging-based analysis with the dose-function histogram and nonlinear weighted ventilation values yielded AUCs of 0.66 and 0.67, respectively, when we evaluated the percentage of functionality receiving ≥20 Gy. All dose-function metrics outperformed the traditional dose metrics (mean lung dose, AUC of 0.55).
Conclusions: A full range of dose-function metrics and functional thresholds was examined. The calculated AUC values for the most predictive functional models occupied a narrow range (0.66-0.70), and all showed notable improvements over AUC from traditional lung dose metrics (0.55). Identifying the combinations most predictive of grade 3+ RP provides valuable data to inform the functional-guided radiation therapy process.
Copyright © 2017 Elsevier Inc. All rights reserved.
Conflict of interest statement
Conflict of Interest: This work was partially funded by grant R01CA200817 (AF, RC, EC, YV) and 1K01-CA-181292-01 (RC)
Figures
References
-
- Martel MK, Ten Haken RK, Hazuka MB, et al. Estimation of tumor control probability model parameters from 3-d dose distributions of non-small cell lung cancer patients. Lung Cancer. 1999;24:31–37. - PubMed
-
- Graham MV, Purdy JA, Emami B, et al. Clinical dose-volume histogram analysis for pneumonitis after 3d treatment for non-small cell lung cancer (nsclc) International Journal of Radiation Oncology Biology Physics. 1999;45:323–329. - PubMed
-
- Kwa SLS, Lebesque JV, Theuws JCM, et al. Radiation pneumonitis as a function of mean lung dose: An analysis of pooled data of 540 patients. International Journal of Radiation Oncology* Biology* Physics. 1998;42:1–9. - PubMed
-
-
Redacted
-
Publication types
MeSH terms
Grants and funding
LinkOut - more resources
Full Text Sources
Other Literature Sources
Medical
