

Deficits in category learning in older adults: Rule-based versus clustering accounts
- PMID: 28816474
- PMCID: PMC5560418
- DOI: 10.1037/pag0000183
Deficits in category learning in older adults: Rule-based versus clustering accounts
Abstract
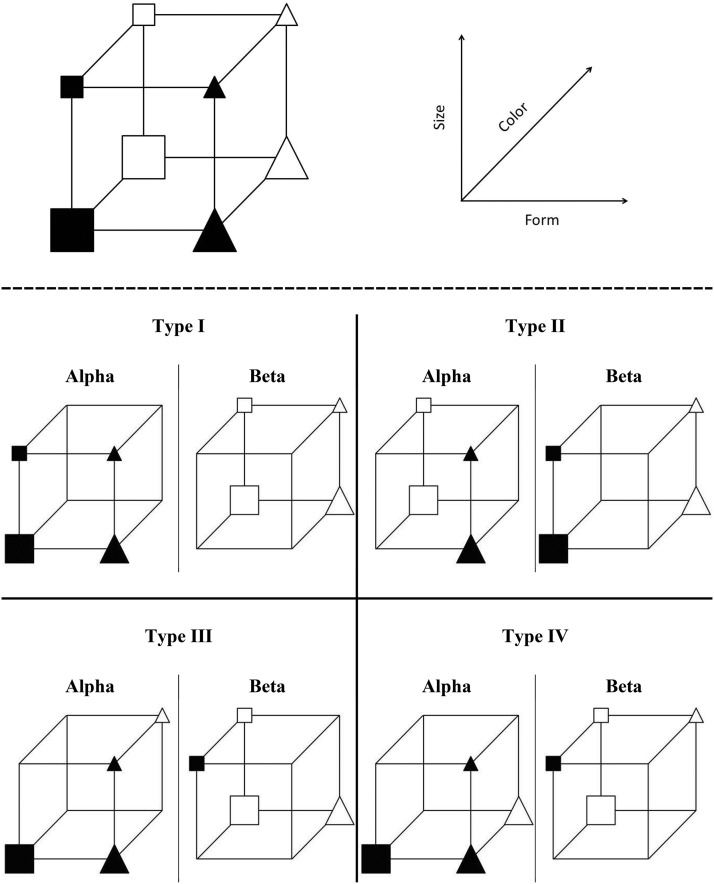
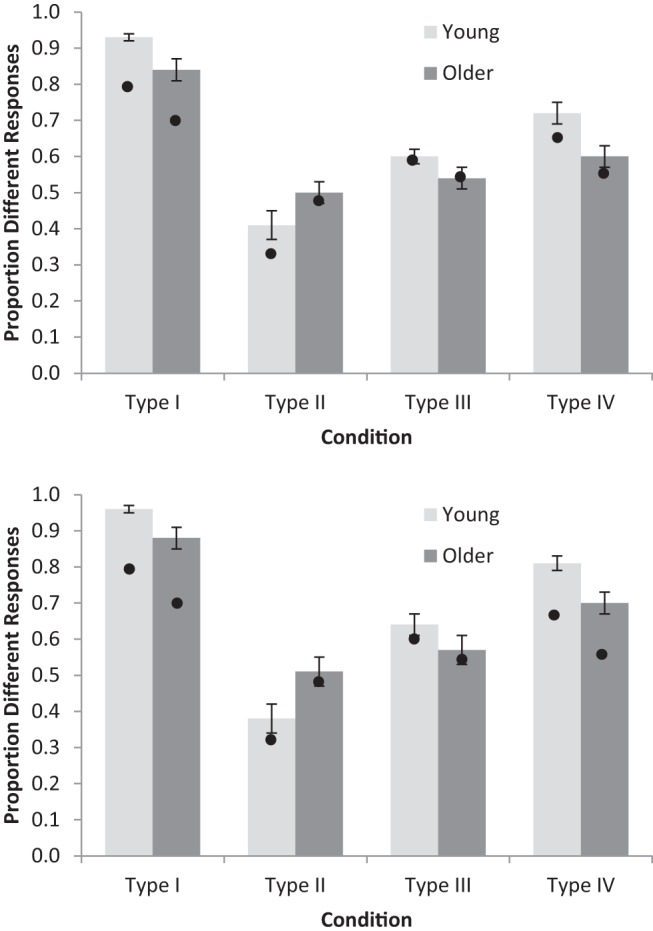
Memory research has long been one of the key areas of investigation for cognitive aging researchers but only in the last decade or so has categorization been used to understand age differences in cognition. Categorization tasks focus more heavily on the grouping and organization of items in memory, and often on the process of learning relationships through trial and error. Categorization studies allow researchers to more accurately characterize age differences in cognition: whether older adults show declines in the way in which they represent categories with simple rules or declines in representing categories by similarity to past examples. In the current study, young and older adults participated in a set of classic category learning problems, which allowed us to distinguish between three hypotheses: (a) rule-complexity: categories were represented exclusively with rules and older adults had differential difficulty when more complex rules were required, (b) rule-specific: categories could be represented either by rules or by similarity, and there were age deficits in using rules, and (c) clustering: similarity was mainly used and older adults constructed a less-detailed representation by lumping more items into fewer clusters. The ordinal levels of performance across different conditions argued against rule-complexity, as older adults showed greater deficits on less complex categories. The data also provided evidence against rule-specificity, as single-dimensional rules could not explain age declines. Instead, computational modeling of the data indicated that older adults utilized fewer conceptual clusters of items in memory than did young adults. (PsycINFO Database Record
(c) 2017 APA, all rights reserved).
Figures


References
-
- Akaike H. (1978). On the likelihood of a time series model. The Statistician, 27, 217–235. 10.2307/2988185 - DOI
-
- Aldous D. (1985). Exchangeability and related topics In Hennequin P. L. (Ed.), École d’été de probabilités de Saint-Flour XIII—1983 [Saint-Flour Probability Summer School XIII—1983] (pp. 1–198). Berlin, Germany: Springer.
-
- Anderson J. R. (1991). The adaptive nature of human categorization. Psychological Review, 98, 409–429. 10.1037/0033-295X.98.3.409 - DOI
-
- Bourne L. E. (1970). Knowing and using concepts. Psychological Review, 77, 546–556. 10.1037/h0030000 - DOI
MeSH terms
Grants and funding
LinkOut - more resources
Full Text Sources
Other Literature Sources
Medical
Miscellaneous
