. 2017 Aug 17;13(8):e1005650.
doi: 10.1371/journal.pcbi.1005650. eCollection 2017 Aug.

Comparing efficacies of moxifloxacin, levofloxacin and gatifloxacin in tuberculosis granulomas using a multi-scale systems pharmacology approach

Affiliations

Comparing efficacies of moxifloxacin, levofloxacin and gatifloxacin in tuberculosis granulomas using a multi-scale systems pharmacology approach

Elsje Pienaar et al. PLoS Comput Biol. .

Abstract

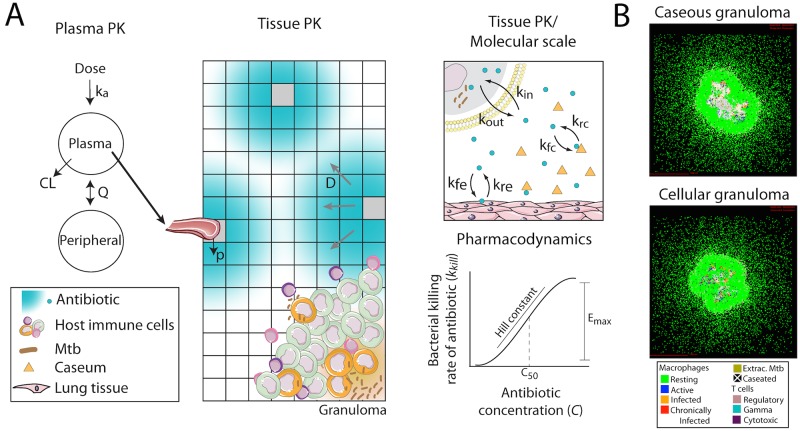
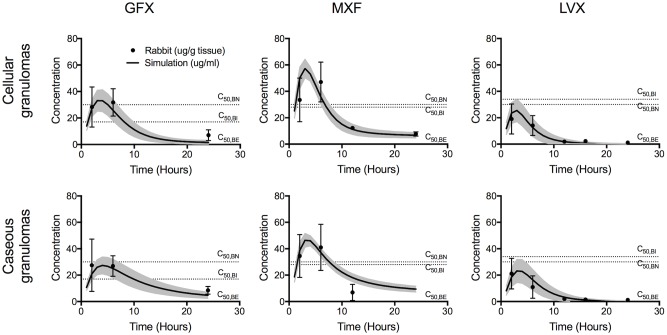
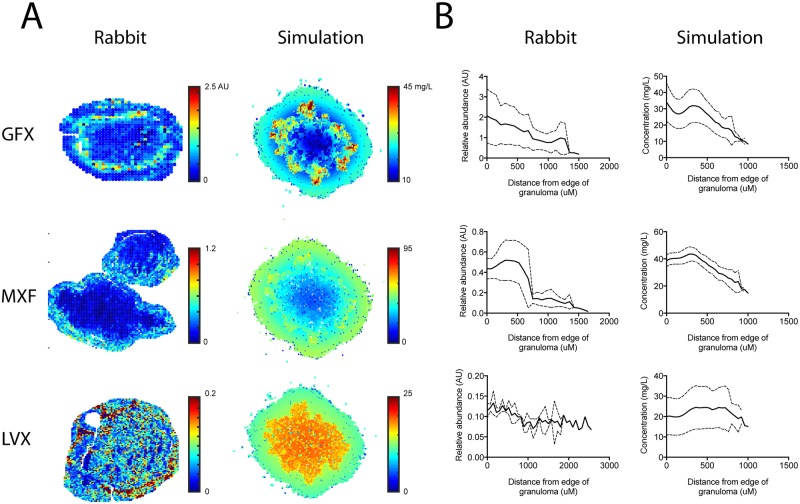
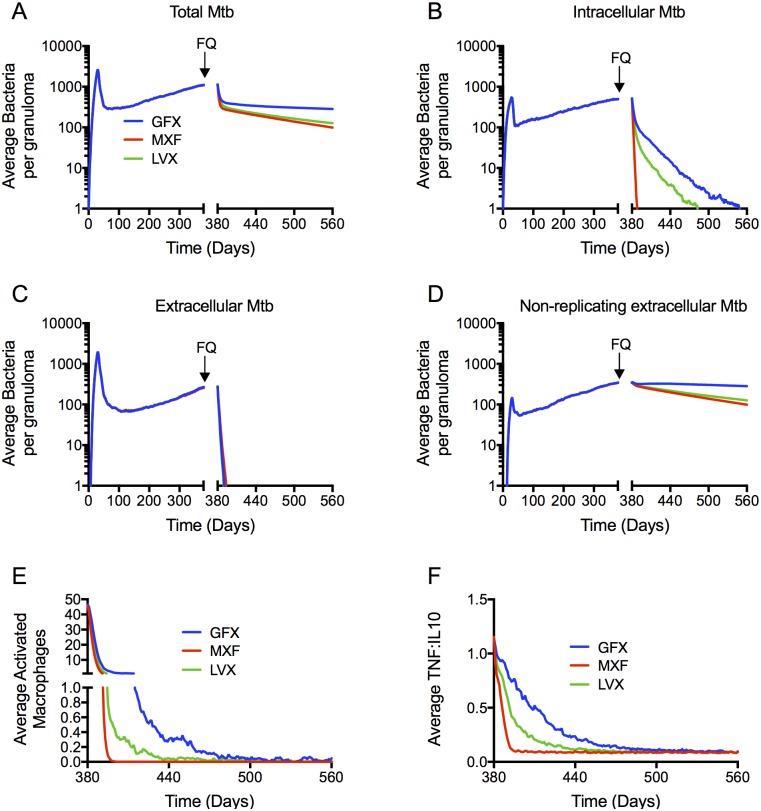
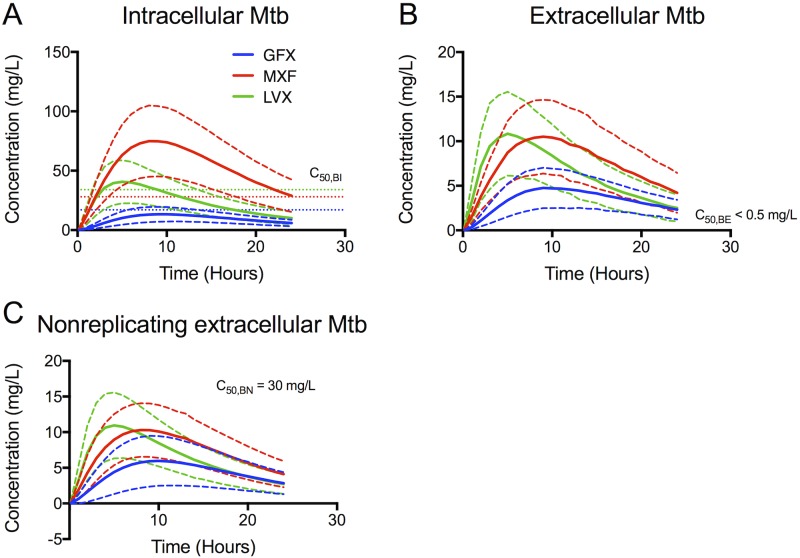
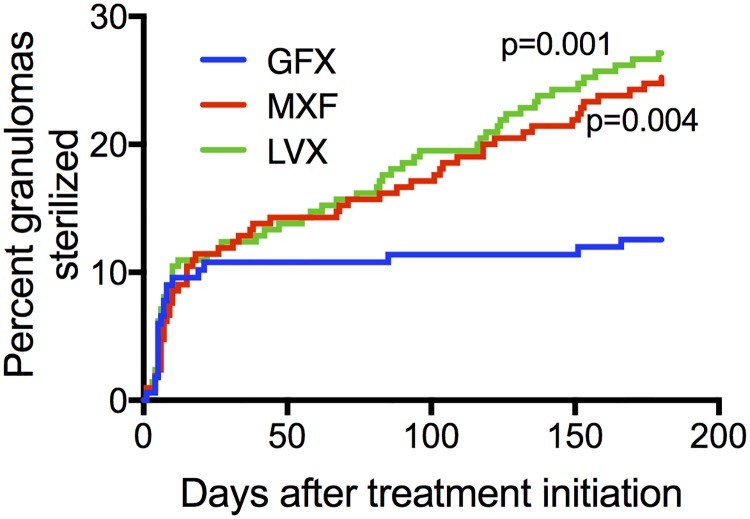
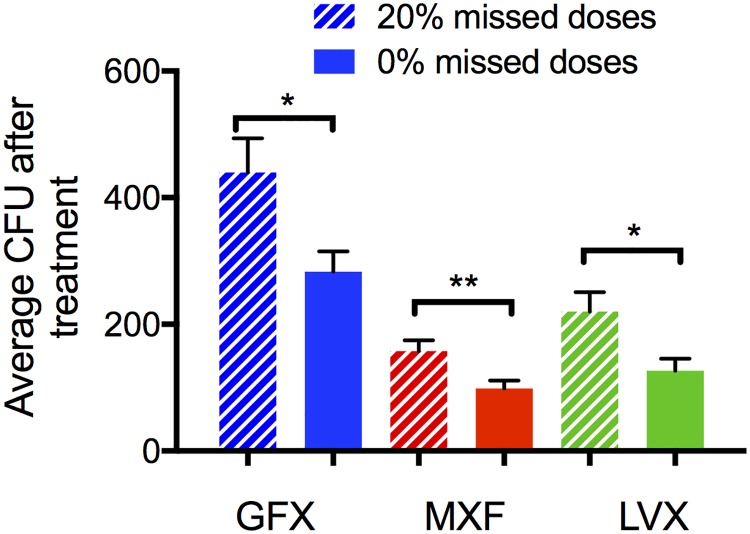
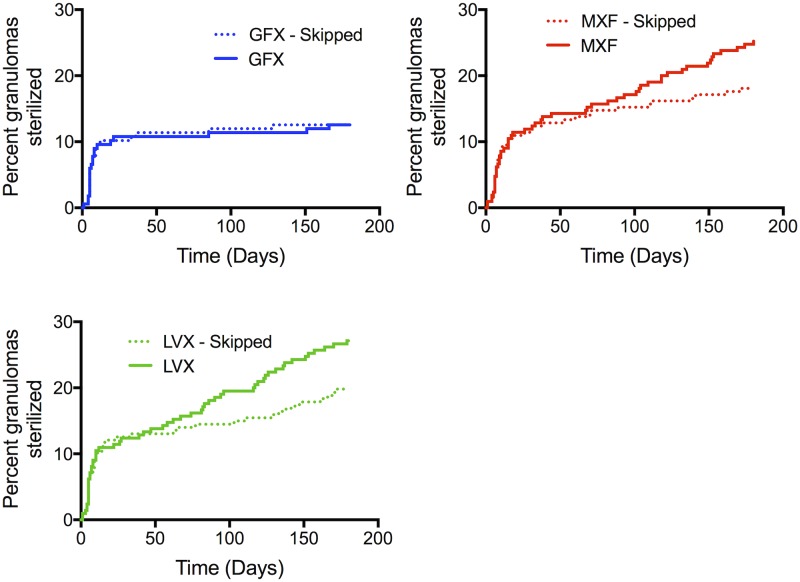
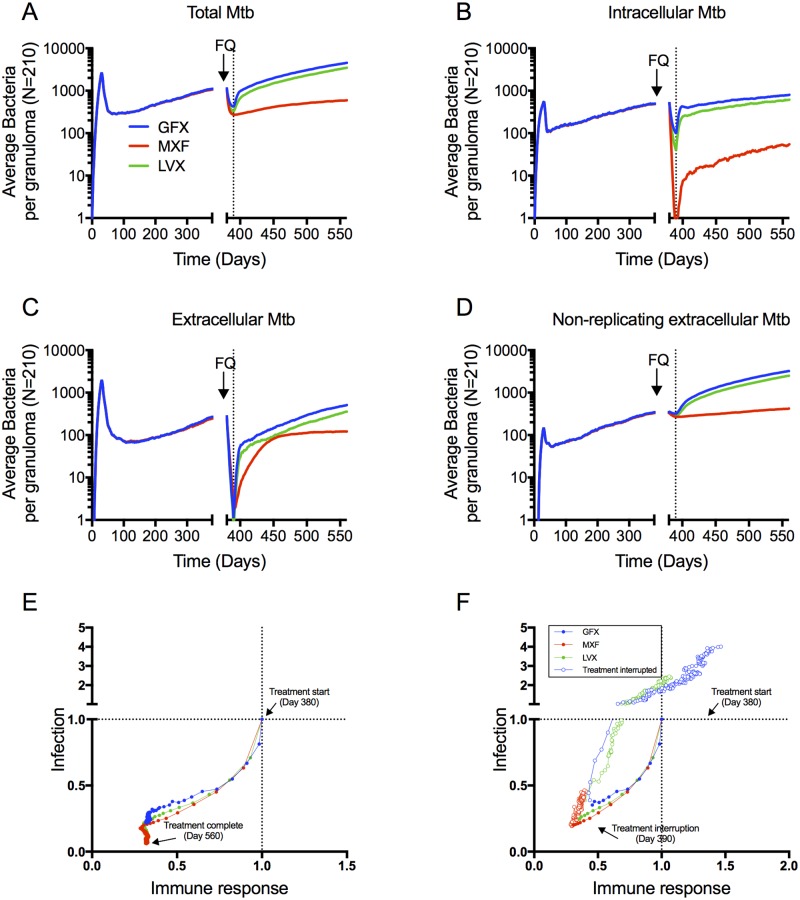
Granulomas are complex lung lesions that are the hallmark of tuberculosis (TB). Understanding antibiotic dynamics within lung granulomas will be vital to improving and shortening the long course of TB treatment. Three fluoroquinolones (FQs) are commonly prescribed as part of multi-drug resistant TB therapy: moxifloxacin (MXF), levofloxacin (LVX) or gatifloxacin (GFX). To date, insufficient data are available to support selection of one FQ over another, or to show that these drugs are clinically equivalent. To predict the efficacy of MXF, LVX and GFX at a single granuloma level, we integrate computational modeling with experimental datasets into a single mechanistic framework, GranSim. GranSim is a hybrid agent-based computational model that simulates granuloma formation and function, FQ plasma and tissue pharmacokinetics and pharmacodynamics and is based on extensive in vitro and in vivo data. We treat in silico granulomas with recommended daily doses of each FQ and compare efficacy by multiple metrics: bacterial load, sterilization rates, early bactericidal activity and efficacy under non-compliance and treatment interruption. GranSim reproduces in vivo plasma pharmacokinetics, spatial and temporal tissue pharmacokinetics and in vitro pharmacodynamics of these FQs. We predict that MXF kills intracellular bacteria more quickly than LVX and GFX due in part to a higher cellular accumulation ratio. We also show that all three FQs struggle to sterilize non-replicating bacteria residing in caseum. This is due to modest drug concentrations inside caseum and high inhibitory concentrations for this bacterial subpopulation. MXF and LVX have higher granuloma sterilization rates compared to GFX; and MXF performs better in a simulated non-compliance or treatment interruption scenario. We conclude that MXF has a small but potentially clinically significant advantage over LVX, as well as LVX over GFX. We illustrate how a systems pharmacology approach combining experimental and computational methods can guide antibiotic selection for TB.


Conflict of interest statement

The authors have declared that no competing interests exist.

Figures

Fig 1
Fig 1. Computational model structure and simulated granulomas.
(A) The model tracks plasma PK dynamics using a two-compartment model. The plasma PK model is linked to an agent-based model (ABM) representing spatial and temporal granuloma formation as well as tissue PK, i.e. antibiotic diffusion in the lung tissue and penetration into the granuloma. The model also tracks molecular level antibiotic dynamics such as cell uptake, and caseum binding. Finally the model calculates the antibacterial activity of antibiotics at specific locations in the granuloma using an Emax model based on local antibiotic concentration. Parameter definitions are in Table 3. (B) Emergent behavior of the model system is the formation of in silico granulomas that can represent the spectrum of granulomas observed in vivo, e.g. caseous and cellular granulomas shown. Art adapted from Servier Medical Art (http://servier.com/Powerpoint-image-bank) provided under a Creative Commons Attribution 3.0 Unported License.
Fig 2
Fig 2. Comparison of plasma PK in rabbits and simulations.
A two-compartment plasma PK model describes plasma dynamics in rabbits. To show variation in simulation outcomes we plot both baseline simulations (dark lines) and standard deviations (shaded) for 100 simulations. To show variation in rabbit data we plot individual measurements (connected circles) for between 3 and 7 rabbits.
Fig 3
Fig 3. Comparison of average FQ concentrations in simulated granulomas (solid lines) recapitulate LCMS measurements in rabbit granulomas (data points).
Lines and data points show means and standard deviations for 100 in silico granulomas, and between 1 and 67 rabbit granulomas. Horizontal dotted lines show C50 values for intracellular (C50,BI), extracellular replicating (C50,BE) and extracellular non-replicating bacteria (C50,BN). Though not used for model calibration, dynamics in uninvolved lung are also in agreement between simulations and rabbit data (Figure in S2 Fig).
Fig 4
Fig 4. Spatial distributions of FQs in simulated granulomas recapitulate MALDI-MS imaging in rabbit granulomas.
(A) Representative granulomas from rabbits (left) and simulations (right) showing different spatial distribution of GFX, MXF and LVX at 6 hours post dose. Simulations capture the qualitative differences between the three FQs. A quantitative comparison between our simulations and MALDI-MSI is not possible due to the semi-quantitative nature of the MALDI-MSI data. (B) Different distributions between GFX, MXF and LVX are consistent across all granulomas studied. Figures show average MALDI-MS abundance in rabbit granulomas (left) and concentrations in simulated granulomas (right) plotted as a function of distance from the edge of the granuloma (in μm). Solid lines show mean and dashed lines show standard deviation for 100 simulated granulomas and between 3 and 7 rabbit granulomas.
Fig 5
Fig 5. Simulated bacterial CFU (A-D) and host immune dynamics (E-F) during treatment are similar between MXF and LVX with GFX killing fewer bacteria.
Dynamics in the total bacterial load (A) are dominated by the non-replicating Mtb population residing the caseum (D), which is not being cleared by any of the FQs. MXF clears the intracellular bacterial population (B) more quickly than LVX and GFX, and all three FQs clear the extracellular bacterial population within days (C). Metrics of inflammation (number of activated macrophages (E), and TNF-α:IL-10 ratio (F)) decline more quickly during MXF treatment compared to LVX and GFX. Lines show means of 210 in silico granulomas, with infection starting at day 0, and daily FQ treatment starting at day 380 (arrows) for 6 months (ending at day 560).
Fig 6
Fig 6. Simulated average free FQ concentrations that each bacterial subpopulation (intracellular (A), extracellular (B) and nonreplicating (C)) is exposed to during one dosing period.
Solid lines show means and dashed lines show standard deviations for 210 in silico granulomas. Horizontal dotted lines show C50 values for intracellular (C50,BI), extracellular replicating (C50,BE) and extracellular non-replicating bacteria (C50,BN) for each FQ.
Fig 7
Fig 7. Simulations show that MXF and LVX sterilize more granulomas than GFX.
Kaplan-Meier curves show percentage granulomas sterilized over 180 days of treatment with MXF, GFX or LVX (N = 210 granulomas).
Fig 8
Fig 8. Simulated effects of non-compliance on bacterial load following treatment.
Treatment simulations are repeated but programmed to randomly miss 20% of doses. Graph shows mean and standard error of total bacteria (CFU) after 180 days of treatment with MXF, GFX or LVX for 100% compliance (solid bars) or 20% missed doses (hashed bars). *: p-value < 0.05, **: p-value < 0.005.
Fig 9
Fig 9. Simulated effects of non-compliance on granuloma sterilization.
Percentage granulomas sterilized over 180 days of treatment with MXF, GFX or LVX (N = 210 granulomas), comparing 100% compliance (solid lines) to 20% missed doses (dotted lines) for each FQ.
Fig 10
Fig 10
Bacteria in all subpopulations increase more slowly following MXF treatment interruption, compared to GFX and LVX (A-D). Lines show means of 210 in silico granulomas, with infection starting at day 0, daily FQ treatment starting at day 380 (arrows). Treatment is interrupted after 10 days (vertical dotted lines), and the simulation is continued to day 560 without antibiotics. (E-F) Immune score (x-axes) and infection score (y-axes) decrease during complete treatment (E) and rebound following treatment interruption after 10 days (F). The start of treatment is located at the intersection of the dotted lines. Filled circles indicate the treatment phase, and open circles indicated progression following treatment interruption.

References

    1. WHO, Global tuberculosis report. 2015.
    1. Lin P.L., et al., Quantitative comparison of active and latent tuberculosis in the cynomolgus macaque model. Infect Immun, 2009. 77(10): p. 4631–42. doi: 10.1128/IAI.00592-09 - DOI - PMC - PubMed
    1. Ramakrishnan L., Revisiting the role of the granuloma in tuberculosis. Nat Rev Immunol, 2012. 12(5): p. 352–66. doi: 10.1038/nri3211 - DOI - PubMed
    1. Lenaerts A., Barry C.E. 3rd, and Dartois V., Heterogeneity in tuberculosis pathology, microenvironments and therapeutic responses. Immunol Rev, 2015. 264(1): p. 288–307. doi: 10.1111/imr.12252 - DOI - PMC - PubMed
    1. WHO, WHO treatment guidelines for drug-resistant tuberculosis. 2016: Geneva, Switzerland. - PubMed

MeSH terms