. 2017 Aug 16;95(4):884-895.e9.
doi: 10.1016/j.neuron.2017.07.034.

Developmental Dysfunction of VIP Interneurons Impairs Cortical Circuits

Affiliations

Developmental Dysfunction of VIP Interneurons Impairs Cortical Circuits

Renata Batista-Brito et al. Neuron. .

Abstract

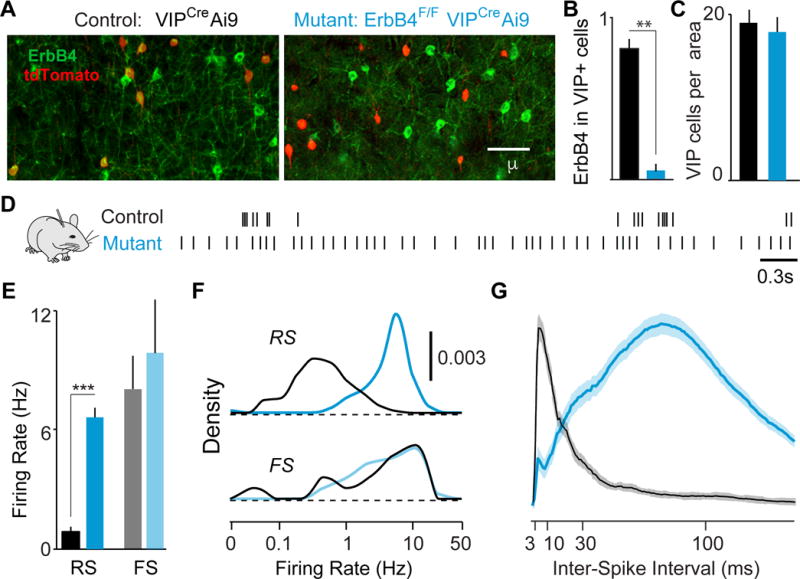
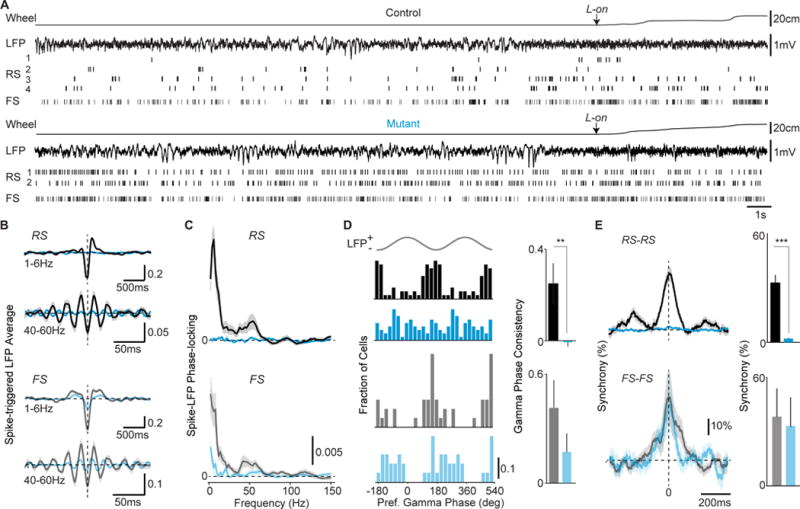
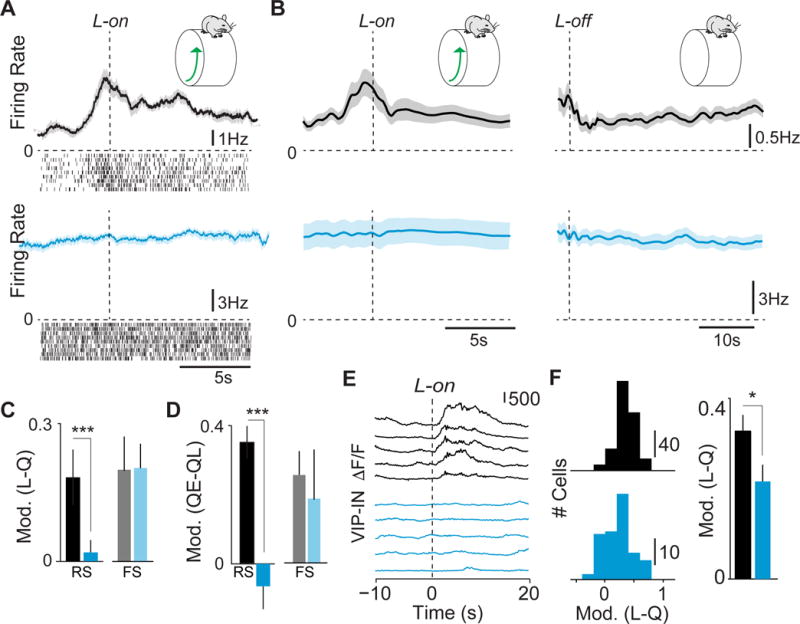
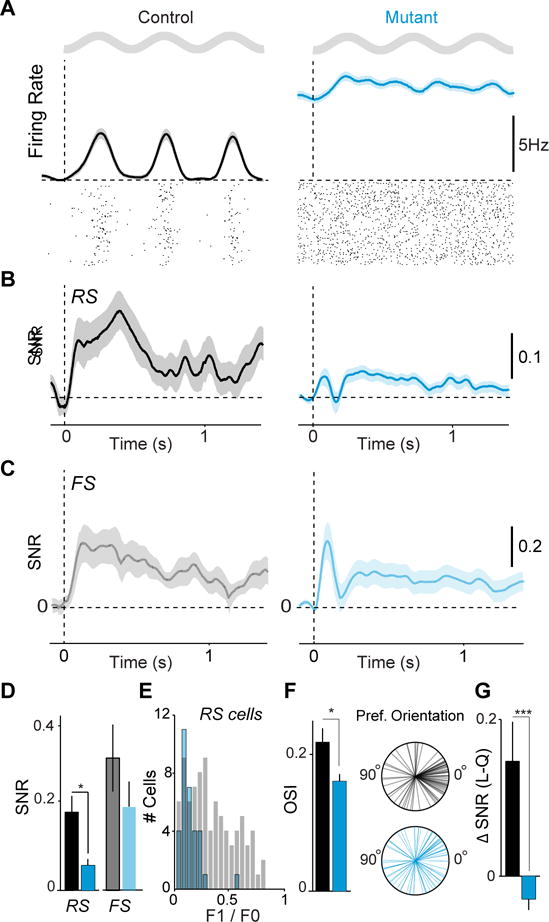
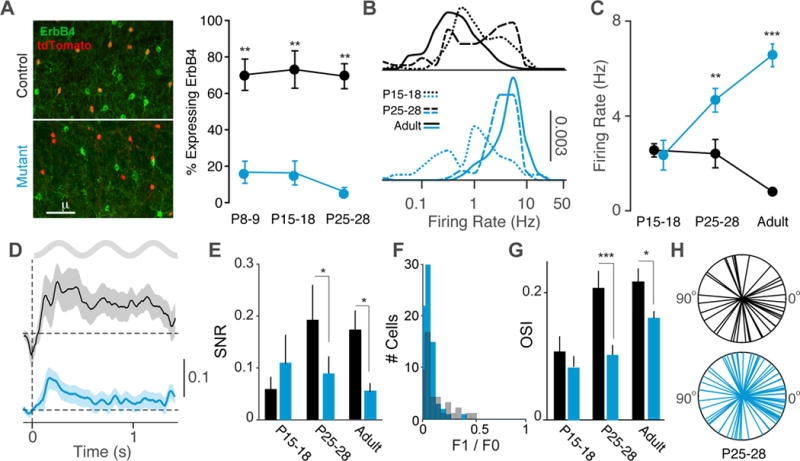
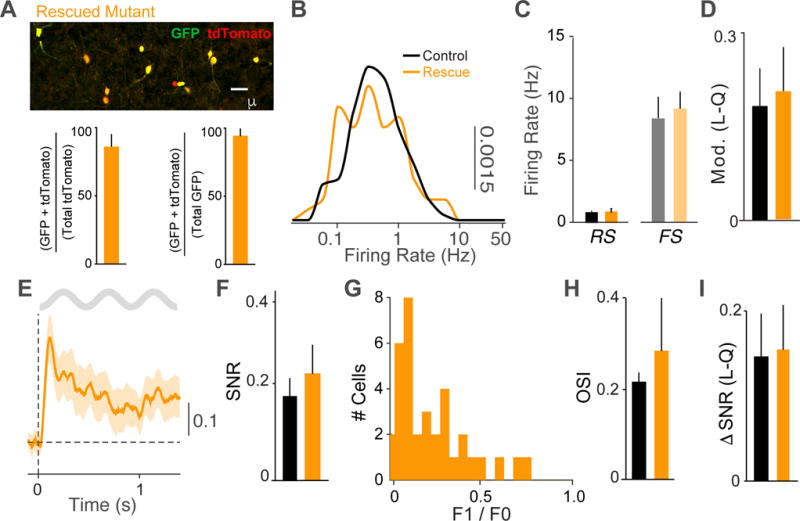
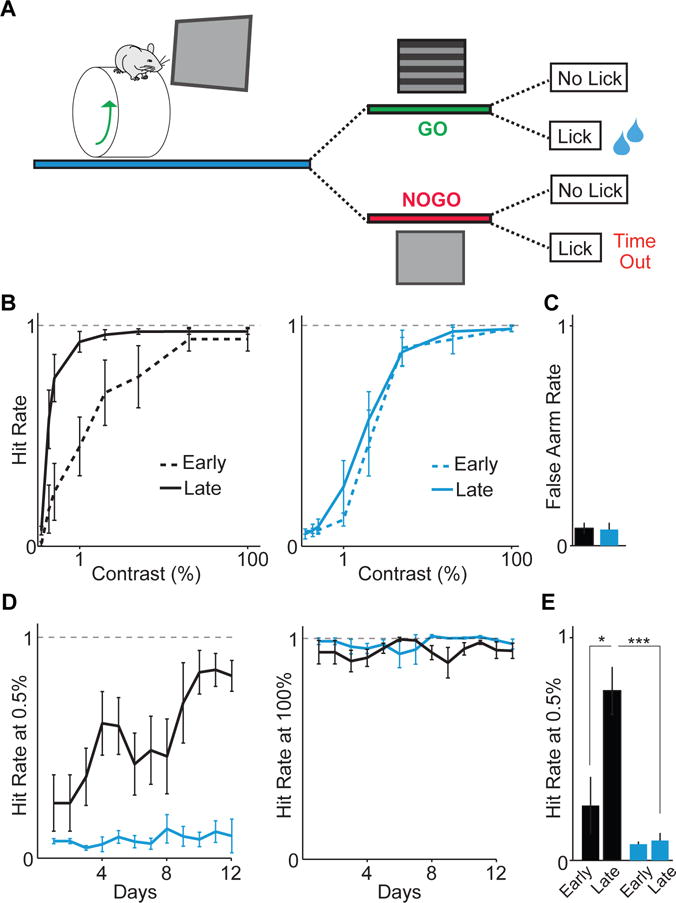
GABAergic interneurons play important roles in cortical circuit development. However, there are multiple populations of interneurons and their respective developmental contributions remain poorly explored. Neuregulin 1 (NRG1) and its interneuron-specific receptor ERBB4 are critical genes for interneuron maturation. Using a conditional ErbB4 deletion, we tested the role of vasoactive intestinal peptide (VIP)-expressing interneurons in the postnatal maturation of cortical circuits in vivo. ErbB4 removal from VIP interneurons during development leads to changes in their activity, along with severe dysregulation of cortical temporal organization and state dependence. These alterations emerge during adolescence, and mature animals in which VIP interneurons lack ErbB4 exhibit reduced cortical responses to sensory stimuli and impaired sensory learning. Our data support a key role for VIP interneurons in cortical circuit development and suggest a possible contribution to pathophysiology in neurodevelopmental disorders. These findings provide a new perspective on the role of GABAergic interneuron diversity in cortical development. VIDEO ABSTRACT.

Keywords: ErbB4; GABAergic; VIP; cholinergic; cortex; development; gCAMP6; interneuron; somatostatin; visual.


Figures

Figure 1
Figure 1. ErbB4 deletion from VIP interneurons alters cortical spiking
(A) ErbB4 and tdTomato immunohistochemistry in V1 cortex of control (black) and mutant (cyan) mice. Upon Cre recombination of the reporter line Ai9, VIP cells express tdTomato. (B) ErbB4 expression in VIP interneurons quantified as a fraction of cells double-labeled for ErbB4 and tdTomato over the total number of tdTomato labeled cells, in controls (black, n = 6 mice) and mutants (cyan, n = 6 mice). (C) Number of VIP fate-mapped cells per optical area in control and mutant mice. (D) Spike trains of example RS cells. (E) Average firing rate during quiescence. Controls: 153 RS, 15 FS cells, 8 mice. Mutants: 134 RS, 32 FS cells, 8 mice. (F) Distribution of firing rates across population. (G) Inter-spike interval histograms (normalized to max) during quiescence for all RS cells. Error bars show s.e.m. p**<0.01, p***<0.001.
Figure 2
Figure 2. Loss of VIP ErbB4 disrupts the temporal organization of cortical activity
(A) Example wheel position and LFP traces, with single-unit activity, around locomotion-onset (L-on). Locomotion is shown as a linearized version of the wheel position. (B) Average spike-triggered LFP average in 40–60Hz and 1–6Hz bands during locomotion. Controls: 55 RS, 23 FS cells, 7 mice (black). Mutants: 61 RS, 23 FS, 8 mice (cyan). (C) Average spike-LFP phase-locking during locomotion. Control vs mutant significant in 1–6Hz (RS: p<0.05) and 40–60Hz (RS: p<0.05; FS: p<0.05). (D) Left: Preferred LFP gamma-phase of firing during locomotion. Right: Consistency of preferred LFP gamma-phases. (E) Left: Average normalized cross-correlograms during quiescence. Right: Percent-wise increase in zero-lag coincidences. RS-RS: Controls 192 pairs, 14 mice; Mutants 227 pairs, 5 mice. FS-FS: Controls n=15 pairs, 4 mice; Mutants 22 pairs, 3 mice. Error bars and shadings show s.e.m. p**<0.01, p***<0.001.
Figure 3
Figure 3. VIP ErbB4 deletion abolishes cortical state transitions
(A) Average firing rate and raster plots for example RS cells around locomotion onset (L-on) in control (black) and mutant (cyan). (B) Population average change in RS firing rate around locomotion on- (left panel) and offset (right panel). (C) Firing rate modulation index (L−Q/L+Q) in early locomotion period (L; −0.5 to 0.5s around L-on) as compared to quiescence period (Q) for RS and FS cells. Controls: 85 cells RS cells, 21 FS cells 8 mice. Mutants: 72 RS cells, 29 FS cells 8 mice. (D) Firing rate modulation index (QE−QL/QE+QL) in late (QL) vs. early (QE) quiescence for RS and FS cells. (E) Ca2+ transients in VIP interneurons at L-on. (F) Left: Histogram of modulation index (L−Q/L+Q) for VIP cells around L-on. Controls: 223 cells, 6 mice. Mutants: 87 cells, 3 mice. Right: Average modulation index for VIP interneurons around L-on. Error bars and shading show s.e.m. p**<0.01, p***<0.001.
Figure 4
Figure 4. ErbB4 mutants exhibit reduced visual response selectivity
(A) Average firing rate and spike raster plot for example RS cells in response to a drifting grating stimulus in controls (black) and mutants (cyan). Grey sinusoids represent the temporal period of the sinusoidal drifting grating. (B) Average rate modulation relative to inter-trial interval around stimulus onset for RS cells. Controls: 106 RS, 8 mice. Mutants: 92 RS, 7 mice. (C) Average rate modulation relative to inter-trial interval around stimulus onset for FS cells. Controls: 21 cells, 8 animals. Mutants: 28 cells, 7 animals. (D) Signal-to-noise ratio of visual responses for RS and FS cells. (E) Histogram of F1/F0 values for RS cells in control and mutants. (F) Left: Average orientation selectivity index (OSI) of all RS cells. Right: Radial plots of preferred orientations of all RS cells. Controls: 55 cells, 7 mice. Mutants: 61 cells, 8 mice. Panels A–F measured during quiescence. (G) Increase in stimulus rate modulation of RS cells during locomotion as compared to quiescence. Error bars and shading show s.e.m. p*<0.05, p***<0.001.
Figure 5
Figure 5. Developmental window for effects of VIP-IN disruption
(A) ErbB4 and tdTomato immunohistochemistry in V1 cortex of control (black) and mutant (cyan) mice during postnatal development. Left: Upon Cre recombination of the reporter line Ai9, VIP cells express tdTomato. Right: ErbB4 expression in VIP interneurons quantified as a fraction of cells double-labeled for ErbB4 and tdTomato over the total number of tdTomato labeled cells, in controls (black; n = 4 mice) and mutants (cyan; n = 4 mice). (B) Distribution of firing rates of RS cells across population for three ages (P15-18, P25-28, and Adult) in controls and mutants. (C) Average firing rate of RS cells during quiescence for each age group. Controls: 113 cells, 4 mice (P15-18); 70 cells, 3 mice (P25-P28); 153 cells, 8 mice (adult). Mutants: 89 cells, 7 mice (P15-18); 103 cells, 4 mice (P25-P28); 134 cells, 8 mice (adult). (D) Average rate modulation relative to inter-trial interval around visual stimulus onset for RS cells in P25-28 animals. Controls: 43 cells, 3 mice Mutants: 74 cells, 3 mice. (E) Signal-to-noise ratio of visual responses for RS cells in controls and mutants in each age group. Controls: 23 cells, 3 mice (P15-18); 43 cells, 3 mice (P25-P28); 106 cells, 8 mice (adult). Mutants: 20 cells, 3 mice (P15-18); 74 cells, 3 mice (P25-P28); 92 cells, 7 mice (adult). (F) Histogram of F1/F0 values for RS cells in P25-28 animals. Controls: 43 cells, 3 mice. Mutants: 74 cells, 3 mice. (G) Average orientation selectivity index (OSI) of all RS cells in each age group in controls and mutants. Controls: 5 cells, 2 mice (P15-18); 42 cells, 3 mice (P25-P28); 55 cells, 7 mice (adult). Mutants: 20 cells, 3 mice (P15-18); 69 cells, 3 mice (P25-P28); 61 cells, 8 mice (adult). (H) Radial plots of preferred orientations of all RS cells in the P25-28 age group. Error bars and shading show s.e.m., p*<0.05, p**<0.01, p***<0.001.
Figure 6
Figure 6. Complete rescue by cortical re-expression of ErbB4 in VIP interneurons
A) GFP and tdTomato immunohistochemistry in V1 cortex of mutant mice injected with AAV5-CAG-FLEX-GFP-T2A-ErbB4rc (Rescued Mutant, orange). Upper: Upon Cre recombination of the reporter line Ai9 and the viral vector, VIP cells express tdTomato and GFP. Lower, left: GFP expression in VIP interneurons quantified as a fraction of cells double labeled cells for GFP and tdTomato over the total number of tdTomato labeled cells. Lower, right: GFP expression in VIP interneurons quantified as a fraction of cells double labeled cells for GFP and tdTomato over the total number of GFP labeled cells in rescue mutants (n = 4 mice). (B) Distribution of RS firing rates across population in mutants with ErbB4 re-expression in cortical VIP-INs (orange) compared to controls (black). Controls: 153 cells, 8 mice (adults). Rescued Mutants: 63 RS cells, 5 mice. (C) Average firing rates for RS and FS cells during quiescence for each group. Controls: 153 RS, 15 FS cells, 8 mice. Rescued Mutants: 63 RS cells, 9 FS cells, 3 mice. (D) Firing rate modulation index (L−Q/L+Q) in early locomotion period (L; −0.5 to 0.5s around L-on) as compared to quiescence (Q) for each group. Controls: 85 RS cells, 5 mice. Rescued Mutants: 63 RS cells, 5 mice. (E) Average rate modulation relative to inter-trial interval around visual stimulus onset for RS cells in re-expression animals. (F) Signal-to-noise ratio of visual responses for RS cells in each group. Controls: 106 cells, 8 mice. Rescued Mutants: 42 cells, 5 mice. (G) Histogram of F1/F0 values for RS cells in re-expression animals. (H) Average orientation selectivity index (OSI) of all RS cells in each group. (I) Increase in stimulus rate modulation of RS cells during locomotion as compared to quiescence. Error bars and shading show s.e.m, There were no significant differences between controls and mutants.
Figure 7
Figure 7. VIP interneuron disruption causes impaired sensory learning
(A) Schematic of visual detection task. On each trial, either a grating appeared (GO) or there was no change (NOGO). Correct hits were rewarded with water, whereas incorrect hits were followed by a time-out. Controls: 4 mice (black). Mutants: 4 mice (cyan). (B) Control and mutant psychophysical performance curves for early (first 2 days) and late (last 2 days) of training sessions. (C) Average false alarm rates. (D) Average performance for low and high contrast stimuli. (E) Average performance at low contrast for early and late training days. Error bars and shading show s.e.m. p*<0.05, p***<0.001.

References

    1. Abe Y, Namba H, Kato T, Iwakura Y, Nawa H. Neuregulin-1 signals from the periphery regulate AMPA receptor sensitivity and expression in GABAergic interneurons in developing neocortex. The Journal of neuroscience: the official journal of the Society for Neuroscience. 2011;31:5699–5709. - PMC - PubMed
    1. Agim ZS, Esendal M, Briollais L, Uyan O, Meschian M, Martinez LA, Ding Y, Basak AN, Ozcelik H. Discovery, validation and characterization of Erbb4 and Nrg1 haplotypes using data from three genome-wide association studies of schizophrenia. PloS one. 2013;8:e53042. - PMC - PubMed
    1. Ahrens S, Jaramillo S, Yu K, Ghosh S, Hwang GR, Paik R, Lai C, He M, Huang ZJ, Li B. ErbB4 regulation of a thalamic reticular nucleus circuit for sensory selection. Nature neuroscience. 2015;18:104–111. - PMC - PubMed
    1. Allene C, Cattani A, Ackman JB, Bonifazi P, Aniksztejn L, Ben-Ari Y, Cossart R. Sequential generation of two distinct synapse-driven network patterns in developing neocortex. The Journal of neuroscience: the official journal of the Society for Neuroscience. 2008;28:12851–12863. - PMC - PubMed
    1. Anastasiades PG, Marques-Smith A, Lyngholm D, Lickiss T, Raffiq S, Katzel D, Miesenbock G, Butt SJ. GABAergic interneurons form transient layer-specific circuits in early postnatal neocortex. Nature communications. 2016;7:10584. - PMC - PubMed

Publication types

MeSH terms