. 2017 Aug 17;16(1):145.
doi: 10.1186/s12934-017-0760-3.

Development of a silicon limitation inducible expression system for recombinant protein production in the centric diatoms Thalassiosira pseudonana and Cyclotella cryptica

Affiliations

Development of a silicon limitation inducible expression system for recombinant protein production in the centric diatoms Thalassiosira pseudonana and Cyclotella cryptica

Roshan P Shrestha et al. Microb Cell Fact. .

Abstract

Background: An inducible promoter for recombinant protein expression provides substantial benefits because under induction conditions cellular energy and metabolic capability can be directed into protein synthesis. The most widely used inducible promoter for diatoms is for nitrate reductase, however, nitrogen metabolism is tied into diverse aspects of cellular function, and the induction response is not necessarily robust. Silicon limitation offers a means to eliminate energy and metabolic flux into cell division processes, with little other detrimental effect on cellular function, and a protein expression system that works under those conditions could be advantageous.

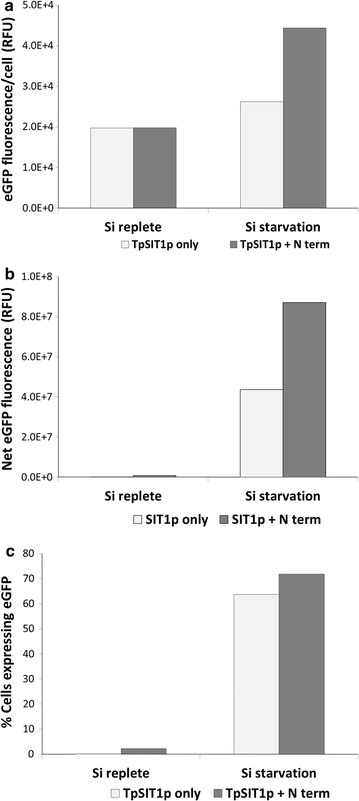
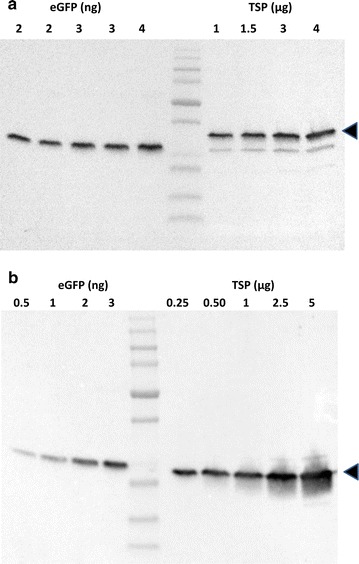
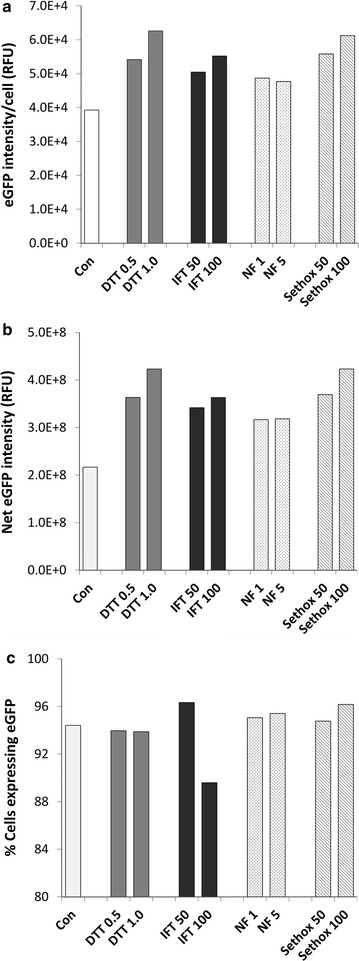
Results: In this study, we evaluate a number of promoters for recombinant protein expression induced by silicon limitation and repressed by the presence of silicon in the diatoms Thalassiosira pseudonana and Cyclotella cryptica. In addition to silicon limitation, we describe additional strategies to elevate recombinant protein expression level, including inclusion of the 5' fragment of the coding region of the native gene and reducing carbon flow into ancillary processes of pigment synthesis and formation of photosynthetic storage products. We achieved yields of eGFP to 1.8% of total soluble protein in C. cryptica, which is about 3.6-fold higher than that obtained with chloroplast expression and ninefold higher than nuclear expression in another well-established algal system.

Conclusions: Our studies demonstrate that the combination of inducible promoter and other strategies can result in robust expression of recombinant protein in a nuclear-based expression system in diatoms under silicon limited conditions, separating the protein expression regime from growth processes and improving overall recombinant protein yields.

Keywords: Cyclotella cryptica; Diatom; Fatty acid synthesis inhibition; Inducible promoter; Protein expression; Silicon transporter; Silicon-limitation; Thalassiosira pseudonana; Transformation.


Figures

Fig. 1
Fig. 1
Identification of T. pseudonana genes induced by silicon limitation and repressed by silicon presence. a Hierarchically clustered mRNA expression profile from Affymetrix microarrays after silicon starvation showing SIT1 and SIT2 clusters [39]. Columns correspond to log2ratio (fold change) of the time points (4, 8, 12, 18 and 24 h) relative to 0 h of silicon starvation. The intensities of the colors indicate the magnitude of up regulation (red) and down regulation (green). Black indicates no change. The TpSIT1 and TpSIT2 clusters are indicated by the red and blue bars, respectively. b Transcript abundance levels of genes in TpSIT1 and 2 clusters determined by RNAseq [39]. FPKM values are plotted, the time course of Si limitation (0–24 h) includes a time point at −2 h, which is Si replete conditions. c FPKM values of genes in Si replete medium at −2 and 8 h after Si starvation. d Fold induction of genes at 8 h relative to −2 h
Fig. 2
Fig. 2
Expression of eGFP under control of the Si-inducible promoters of T. pseudonana and C. cryptica after 24 h of Si starvation showing cytoplasmic localization. a TpSIT1 (Thaps3_268895); b TpSIT2 (Thaps3_41392); 9619, c (Thaps3_9619); and d CcSIT1, (g10780.t1). Scale bar 2 µM
Fig. 3
Fig. 3
Induction level of T. pseudonana and C. cryptica SSIPs in Si-replete media and after 24 h of Si starvation as determined by imaging flow cytometry. a Mean eGFP fluorescence per cell. b Net eGFP fluorescence calculated as product of eGFP intensity/cell and no. of cells expressing eGFP. c Percentage of cells expressing eGFP. eGFP was measured with a 488-nm laser with 50 mw power output without a blocking filter. Error bars represent standard errors of mean (SEM), n = 20,000. TpSIT1p, Thaps3_268895; TpSIT2p, Thaps3_41392; Tp9619p, Thaps3_9619; and CcSIT1p, g10780.t1
Fig. 4
Fig. 4
Comparison of eGFP expression driven by Si inducible and non Si inducible promoters in Si-replete media and after 24 h of Si starvation. The net eGFP fluorescence was calculated as product of eGFP intensity/cell and no. of cells expressing eGFP derived from imaging flow cytometry. To compensate for different levels of expression, eGFP was measured with a 488-nm laser with 100 mW power output without filter (TpNRp, TprpL41p, TpFcpp) and 30 mW power output after blocking saturation with neutral density filter 1.0 (TpSIT1p, TPSIT2p, Thaps3_9619p, and CcSITp). Error bars represent standard errors of mean (SEM), n = 20,000. NR nitrate reductase promoter, rpL41p ribosomal protein L41 promoter, Fcpp fucoxanthin chlorophyll a/c binding protein promoter
Fig. 5
Fig. 5
A time-course expression analysis of eGFP expression under control of TpSIT1 promoter in Thalassiosira pseudonana. Exponentially growing cells were transferred to silicon-deprived media (0 h) and expression of eGFP was followed by measuring eGFP fluorescence using an imaging flow cytometer (a 488-nm laser with 100 mW power output without a blocking filter). Error bars represent standard errors of mean (SEM), n = 20,000
Fig. 6
Fig. 6
Effect of N-terminus presence (TpSIT1P + N term) or absence (TpSIT1p only) coding sequence of SIT1 on expression of eGFP. eGFP was expressed under the transcriptional control of TpSIT1 promoter. A 96-nt long 5’ coding sequence was cloned between promoter and eGFP (TpSIT1p + N term). eGFP was measured with a 488-nm laser with 50 mw power output without a blocking filter. Net eGFP fluorescence (b) = eGFP fluorescence/cell (a) x No. of cells expressing eGFP, depicted as % in (c). Error bars represent standard errors of mean (SEM), n = 20,000
Fig. 7
Fig. 7
Quantification of eGFP expressed in transgenic T. pseudonana (a) and C. cryptica (b) by western blot. PVDF membrane containing transferred GFP standard and total soluble proteins were probed with anti-GFP monoclonal antibodies. BioRad’s ChemiDoc imaging system and Image Lab software were used to detect and quantify chemiluminescent signals from the blot. Numbers indicate ng of eGFP and µg of TSP loaded each well. Arrow heads indicate recombinant eGFP. The lower band is a native T. pseudonana protein with peroxidase activity. eGFP in a shift reflects the fused N-terminal SIT sequence
Fig. 8
Fig. 8
Effect of carotenoid and lipid synthesis inhibitors on recombinant protein expression, under control of SSIP1 promoter, in T. pseudonana after 24 h of Si starvation. Expression of eGFP was measured using an imaging flow cytometer (488 nM laser/100 mW with neutral density filter 0.6). Numbers under bars indicate concentrations of the inhibitors dithiothreitol (DTT): mM, isoxaflutole (IFT): µg/mL, norflurazon (NF): µM, sethoxydim (Sethox): µM. a eGFP intensity/cell; b Net eGFP intensity; c percentage of cells expressing eGFP. Error bars represent standard errors of mean (SEM), n = 20,000. Control sample was without any addition of inhibitors
Fig. 9
Fig. 9
Productivity of recombinant protein expressed in T. pseudonana (a) and C. cryptica (b). eGFP was expressed under respective SIT1 control elements and monitored eGFP production under Si starvation by imaging flowcytometry. eGFP was measured with a 488-nm laser with 50 mW power output (a) and 100 mW power output after blocking saturation with neutral density filter 1.0 (b). Error bars represent standard errors of mean (SEM), n = 20,000
Fig. 10
Fig. 10
Quantification of eGFP expressed in transgenic C. cryptica by ELISA. Total soluble proteins from sonication of cultures harvested on 3rd day of Si starvation were quantified against eGFP standard. Bars represent standard deviations (n = 3). Control sample was without any addition of inhibitors

References

    1. Specht E, Miyake-Stoner S, Mayfield S. Micro-algae come of age as a platform for recombinant protein production. Biotechnol Lett. 2010;32:1373–1383. doi: 10.1007/s10529-010-0326-5. - DOI - PMC - PubMed
    1. Rasala BA, Lee PA, Shen Z, Briggs SP, Mendez M, Mayfield SP. Robust expression and secretion of xylanase1 in Chlamydomonas reinhardtii by fusion to a selection gene and processing with the FMDV 2A peptide. PLoS ONE. 2012;7:e43349. doi: 10.1371/journal.pone.0043349. - DOI - PMC - PubMed
    1. Plucinak TM, Horken KM, Jiang W, Fostvedt J, Nguyen ST, Weeks DP. Improved and versatile viral 2A platforms for dependable and inducible high-level expression of dicistronic nuclear genes in Chlamydomonas reinhardtii. Plant J. 2015;82:717–729. doi: 10.1111/tpj.12844. - DOI - PubMed
    1. Kong F, Yamasaki T, Kurniasih SD, Hou L, Li X, Ivanova N, Okada S, Ohama T. Robust expression of heterologous genes by selection marker fusion system in improved Chlamydomonas strains. J Biosci Bioeng. 2015;120:239–245. doi: 10.1016/j.jbiosc.2015.01.005. - DOI - PubMed
    1. Sevastsyanovich YR, Leyton DL, Wells TJ, Wardius CA, Tveen-Jensen K, Morris FC, Knowles TJ, Cunningham AF, Cole JA, Henderson IR. A generalised module for the selective extracellular accumulation of recombinant proteins. Microb Cell Fact. 2012;11:69. doi: 10.1186/1475-2859-11-69. - DOI - PMC - PubMed

MeSH terms

LinkOut - more resources