. 2017 Aug 18;357(6352):661-667.
doi: 10.1126/science.aam8940.

Comprehensive single-cell transcriptional profiling of a multicellular organism

Affiliations

Comprehensive single-cell transcriptional profiling of a multicellular organism

Junyue Cao et al. Science. .

Abstract

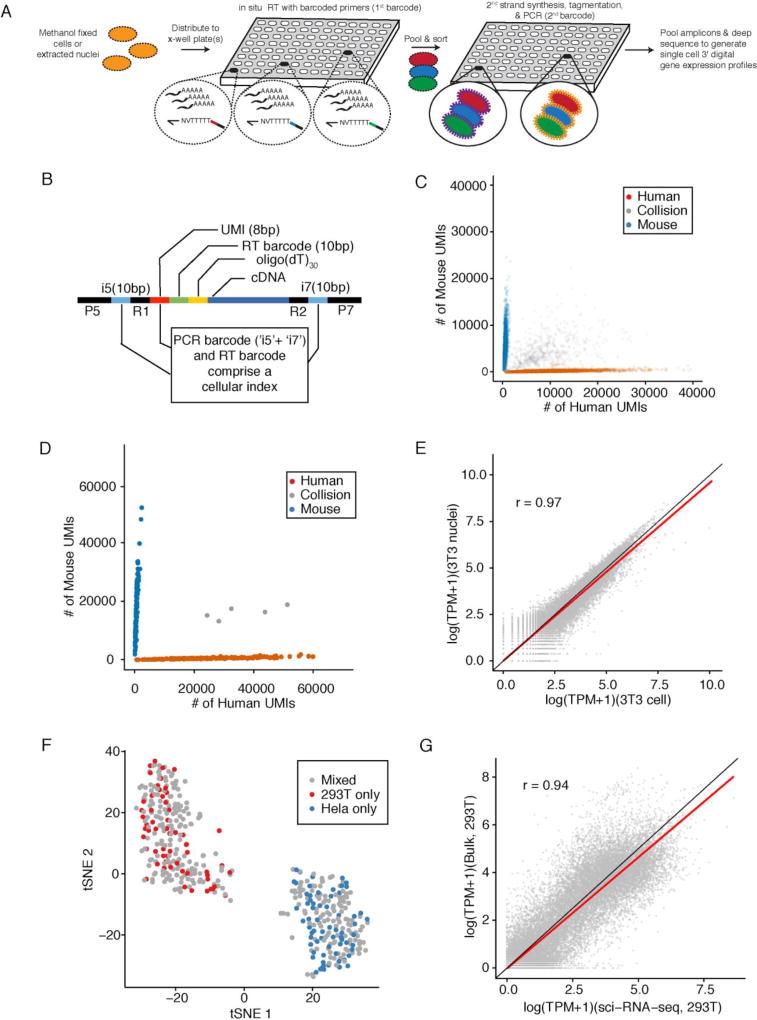
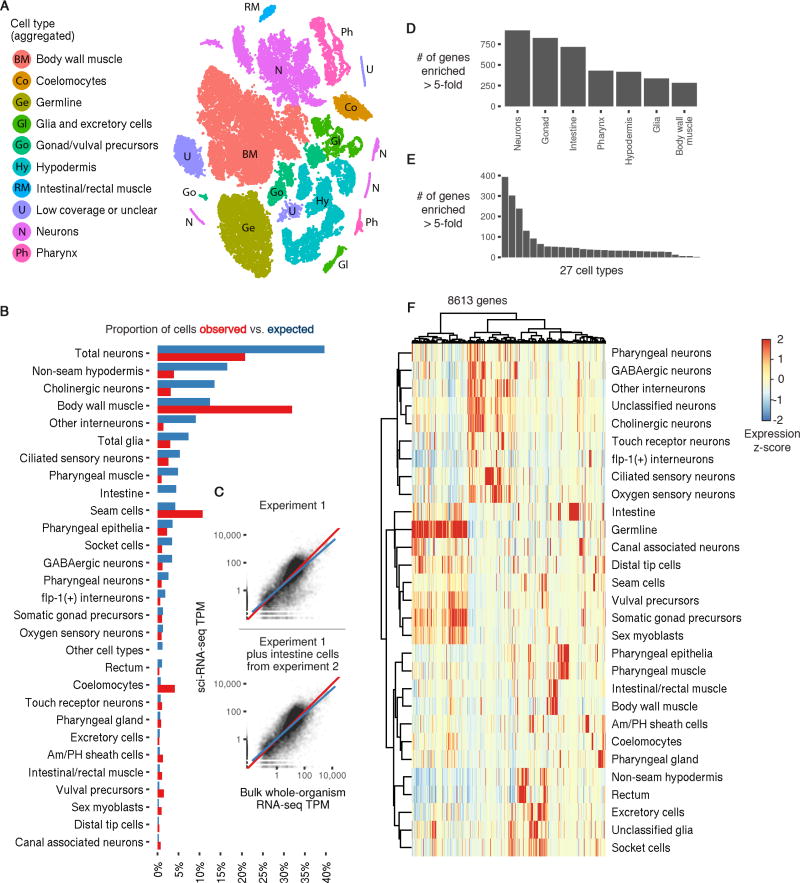
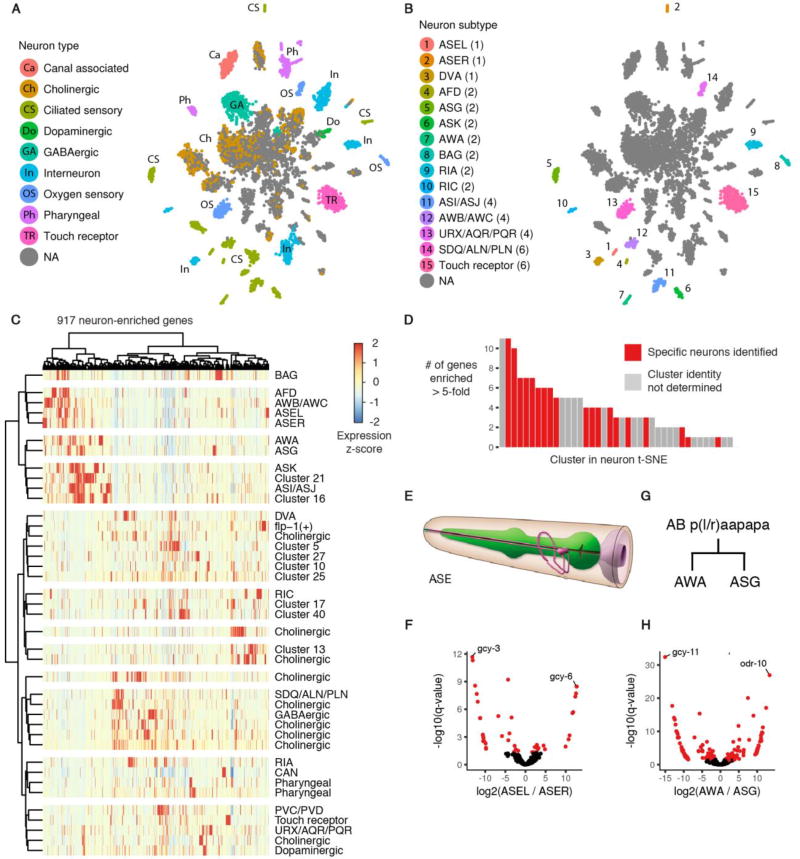
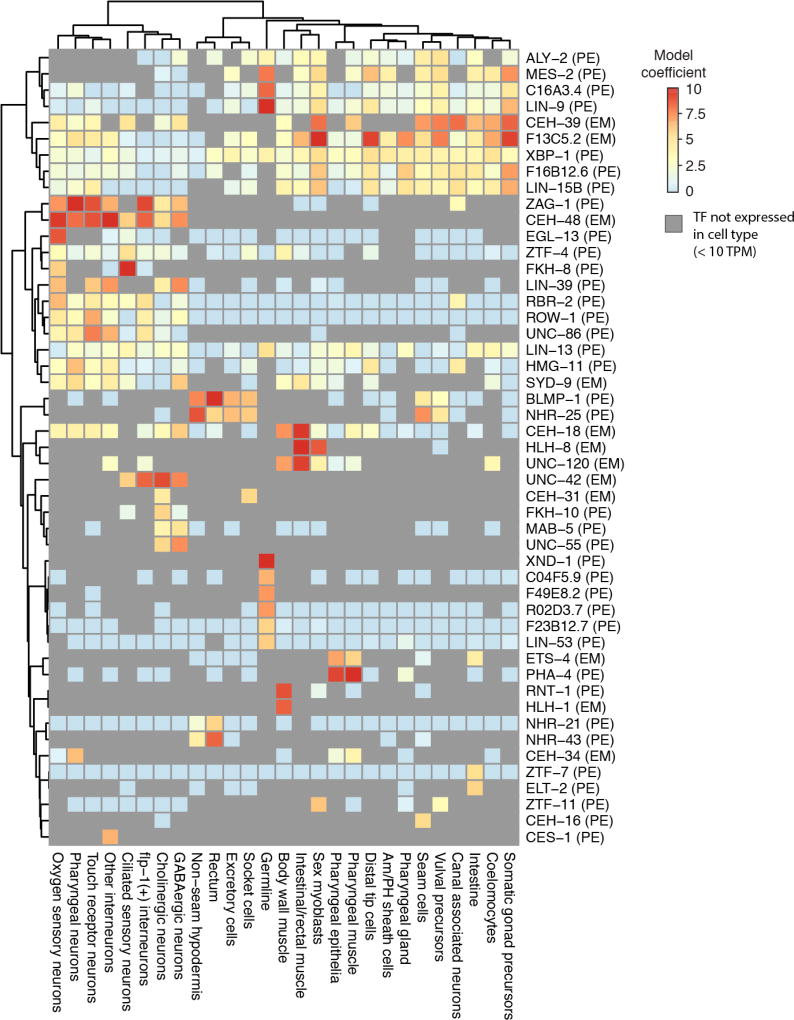
To resolve cellular heterogeneity, we developed a combinatorial indexing strategy to profile the transcriptomes of single cells or nuclei, termed sci-RNA-seq (single-cell combinatorial indexing RNA sequencing). We applied sci-RNA-seq to profile nearly 50,000 cells from the nematode Caenorhabditis elegans at the L2 larval stage, which provided >50-fold "shotgun" cellular coverage of its somatic cell composition. From these data, we defined consensus expression profiles for 27 cell types and recovered rare neuronal cell types corresponding to as few as one or two cells in the L2 worm. We integrated these profiles with whole-animal chromatin immunoprecipitation sequencing data to deconvolve the cell type-specific effects of transcription factors. The data generated by sci-RNA-seq constitute a powerful resource for nematode biology and foreshadow similar atlases for other organisms.


Figures

Fig. 1
Fig. 1. sci-RNA-seq enables multiplex single cell transcriptome profiling
(A) Schematic of sci-RNA-seq workflow. (B) Schematic of sci-RNA-seq library amplicons. Index2 and read1 covers the i5 index, UMI and RT barcode. Index1 and read2 covers the i7 index and cDNA fragment. (C) Scatter plot of unique human and mouse UMI counts from 384 × 384 sci-RNA-seq. Blue: inferred mouse cells (n = 5953). Red: inferred human cells (n = 3967). Grey: collisions (n = 884). (D) Scatter plot of unique human and mouse cell UMI counts from 96 × 96 sci-RNA-seq with optimized protocol. Blue: inferred mouse cells (n = 129). Red: inferred human cells (n = 160). Grey: collisions (n = 5). In (C) and (D), only cells originating from wells containing mixed human and mouse cells are shown. (E) Correlation between gene expression measurements in aggregated sci-RNA-seq profiles of NIH/3T3 cells (n = 238) vs. nuclei (n = 124). (F) tSNE plot of cells originating in wells containing HEK293T (red) (n = 60), HeLa S3 (blue) (n = 69) or a mixture (grey) (n = 321). (G) Correlation between gene expression measurements from aggregated sci-RNA-seq data vs. bulk RNA-seq data from a related protocol (33). (E) and (G) include linear regression (red) and y=x (black) lines.
Fig. 2
Fig. 2. sci-RNA-seq shows robust gene expression measurements
(A) Scatter plot of unique human and mouse UMI counts from a 16 × 84 sci-RNA-seq experiment on mixed HEK293T and NIH/3T3 cells (Table S1). Blue: inferred mouse cells (n = 109). Red: inferred human cells (n = 168). Grey: collisions (n = 19). (B) Boxplots showing number of UMIs detected per cell. (C) Correlation between gene expression measurements in aggregated sci-RNA-seq profiles from experiments performed two months apart on independently grown and fixed cells. (D) Correlation between gene expression measurements in aggregated sci-RNA-seq profiles of fixed-fresh vs. fixed-frozen cells. (C) and (D) include linear regression (red) and y=x (black) lines.
Fig. 3
Fig. 3. A single sci-RNA-seq experiment highlights the single cell transcriptomes comprising the C. elegans larva
(A) t-SNE visualization of the high-level cell types identified. (B) Bar plot showing the proportion of somatic cells profiled in the first sci-RNA-seq C. elegans experiment that could be identified as belonging to each cell type (red) compared to the proportion of cells from that type present in an L2 C. elegans individual (blue). (C) Scatter plots showing the log-scaled transcripts per million (TPM) of genes in the aggregation of all sci-RNA-seq reads (x axis) or in bulk RNA-seq (y axis; geometric mean of 3 experiments). Top plot includes only the first sci-RNA-seq experiment. Bottom plot also includes intestine cells from the second sci-RNA-seq experiment. (D) Number of genes that are enriched at least 5-fold in a specific tissue relative to the 2nd-highest-expressing tissue, excluding genes for which the differential expression between the 1st and 2nd-highest expressing tissues is not significant (q-value > 0.05). (E) Same as (D) except comparing cell types instead of tissues. (F) Heatmap showing the relative expression of genes in consensus transcriptomes for each cell type estimated by sci-RNA-seq. Genes are included if they have a size-factor-normalized mean expression of >0.05 in at least one cell type (8,613 genes in total). The raw expression data (UMI count matrix) is log-transformed, column centered and scaled (using the R function scale), and the resulting values are clamped to the interval [−2, 2].
Fig. 4
Fig. 4. sci-RNA-seq reveals the transcriptomes of fine-grained anatomical classes of C. elegans neurons
(A) t-SNE visualization of high-level neuronal subtypes. Cells identified as neurons from the t-SNE clustering shown in Fig. 3A were re-clustered with t-SNE. (B) Clusters in the neuron t-SNE that can be identified as corresponding to one, two, or four specific neurons in an individual C. elegans larva. The number of neurons of each type are shown in parentheses. (C) Heatmap showing the relative expression of neuron-enriched genes across 40 neuron clusters identified by t-SNE and density peak clustering. Genes are included if their expression in the aggregate transcriptome of all neurons in our data is >5-fold higher than their expression in any other tissue, excluding cases where the differential expression is not significant (q-value > 0.05). (D) Distribution for each neuron cluster of the number of genes that are expressed >5-fold higher in that cluster than in the 2nd-highest expressing neuron cluster (q-value for differential expression < 0.05). (E) Cartoon illustrating the position of the left and right ASE neurons (pink) relative to the pharynx (green); reproduced with permission from www.wormatlas.org (60). (F) Volcano plot showing differentially expressed genes between the left and right ASE neurons. Points in red correspond to genes that are differentially expressed (q-value < 0.05) with a > 3-fold difference between the higher- and lower-expressing neuron(s). (G) The left AWA and ASG neurons arise from the embryonic cell AB plaapapa; the right AWA and ASG neurons arise from AB praapapa. (H) Volcano plot showing differentially expressed genes between the AWA and ASG neurons.
Fig. 5
Fig. 5. Cell type specific expression profiles from sci-RNA-seq enable the deconvolution of whole-animal transcription factor ChIP-seq data
For each of 27 cell types, a regularized regression model was fit to predict log-transformed gene expression levels in that cell type on the basis of ChIP-seq peaks in gene promoters (31). The ChIP-seq data was generated by the modENCODE (61) and modERN consortia (46), profiling transcription factor binding in whole C. elegans animals. “EM” next to a TF label indicates the ChIP-seq data for the TF is from an embryonic stage, while “PE” indicates the data is from a post-embryonic stage. Colors in the heatmap show the extent to which having a ChIP-seq peak for a given TF in a gene promoter correlates with increased expression in a given cell type. Peaks in “HOT regions” (31) are excluded. Grey cells in the heatmap correspond to cases where a TF is not expressed in a cell type (< 10 TPM), in which case ChIP-seq data for that TF is not considered by the regression model.

Comment in

References

    1. Trapnell C. Defining cell types and states with single-cell genomics. Genome Res. 2015;25:1491–1498. - PMC - PubMed
    1. Ramsköld D, et al. Full-length mRNA-Seq from single-cell levels of RNA and individual circulating tumor cells. Nat. Biotechnol. 2012;30:777–782. - PMC - PubMed
    1. Shalek AK, et al. Single-cell transcriptomics reveals bimodality in expression and splicing in immune cells. Nature. 2013;498:236–240. - PMC - PubMed
    1. Wills QF, et al. Single-cell gene expression analysis reveals genetic associations masked in whole-tissue experiments. Nat. Biotechnol. 2013;31:748–752. - PubMed
    1. Zheng GXY, et al. Massively parallel digital transcriptional profiling of single cells. Nat. Commun. 2017;8:14049. - PMC - PubMed

Publication types