

Pseudoreference Regions for Glial Imaging with 11C-PBR28: Investigation in 2 Clinical Cohorts
- PMID: 28818984
- PMCID: PMC5750517
- DOI: 10.2967/jnumed.116.178335
Pseudoreference Regions for Glial Imaging with 11C-PBR28: Investigation in 2 Clinical Cohorts
Abstract
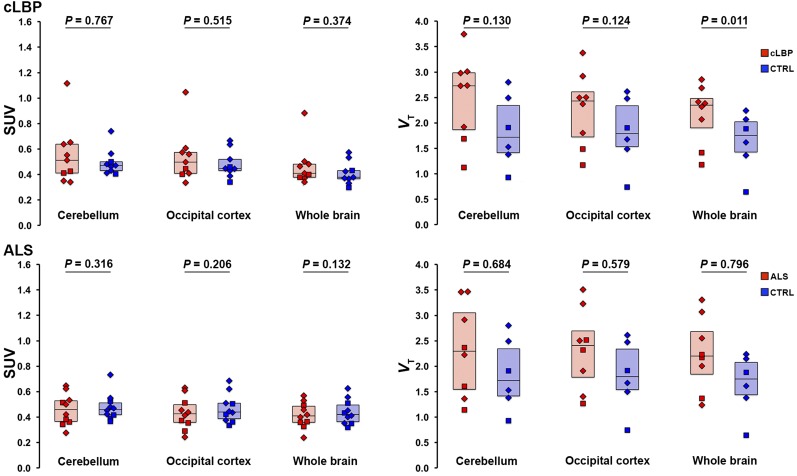
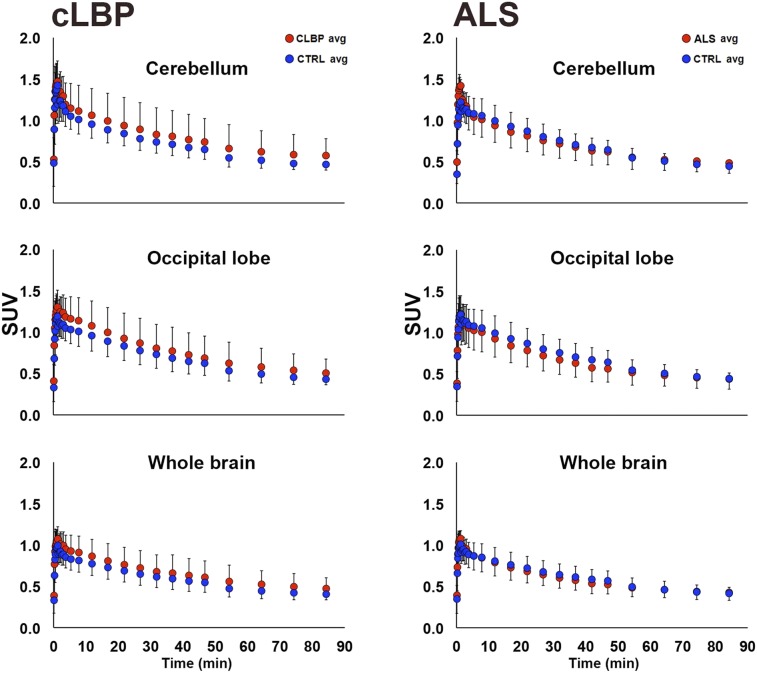
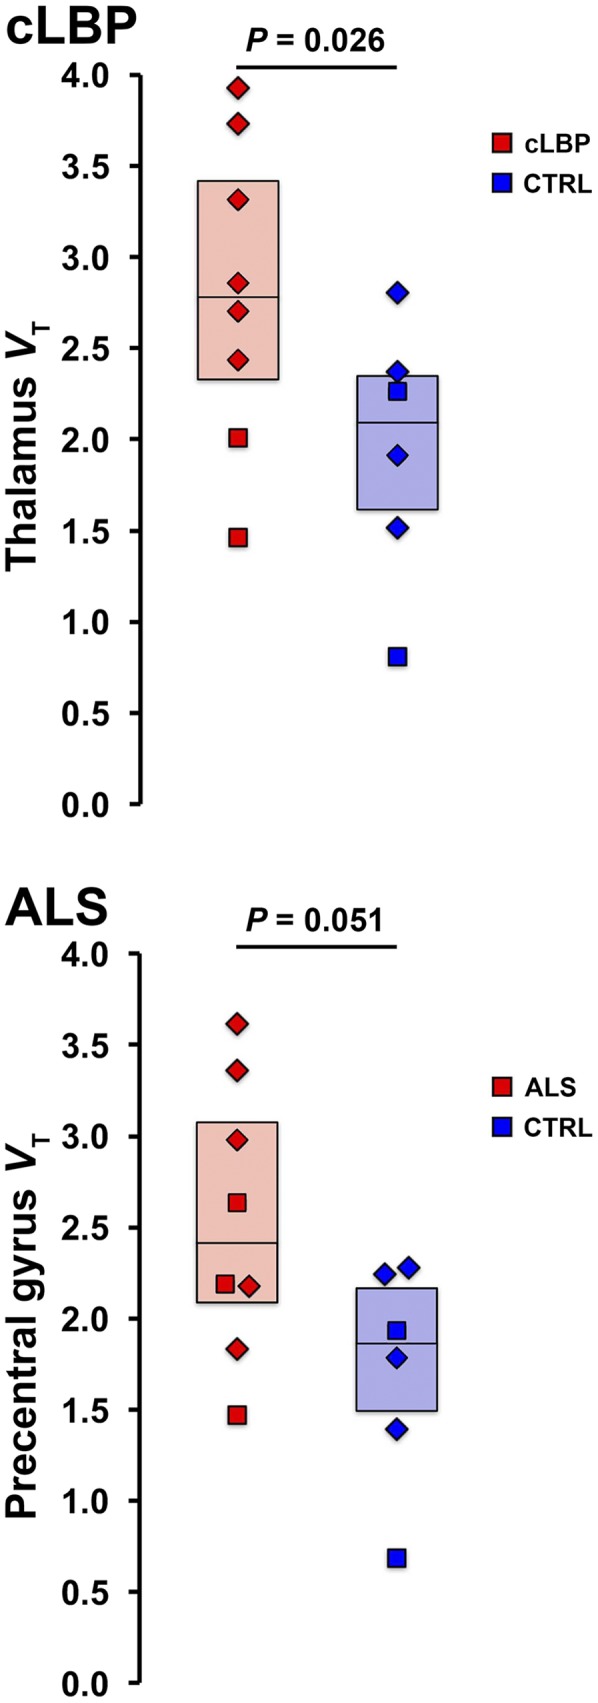
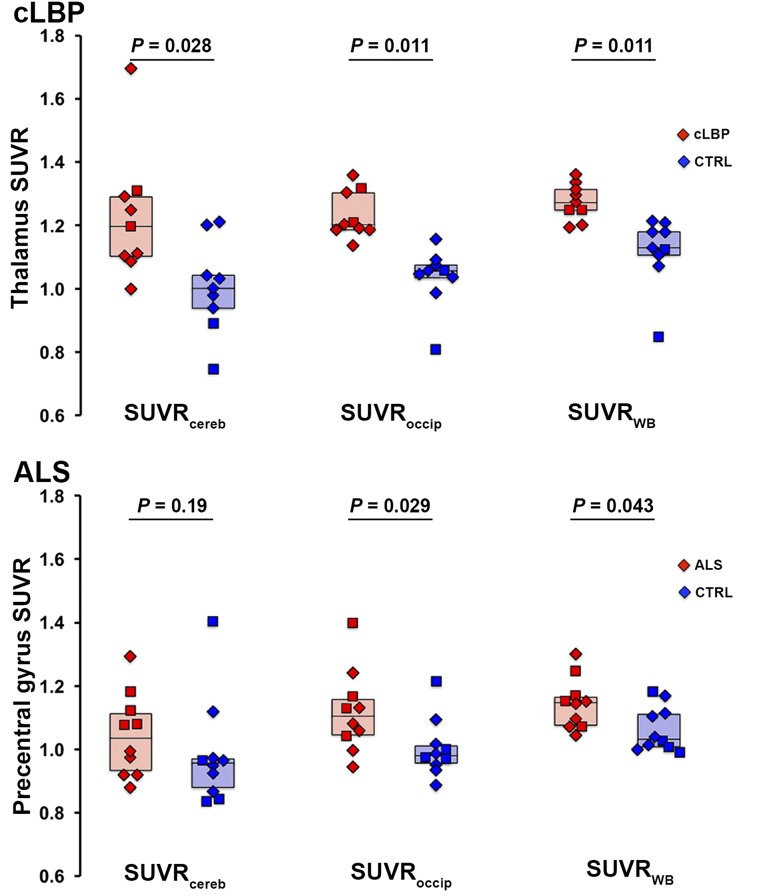
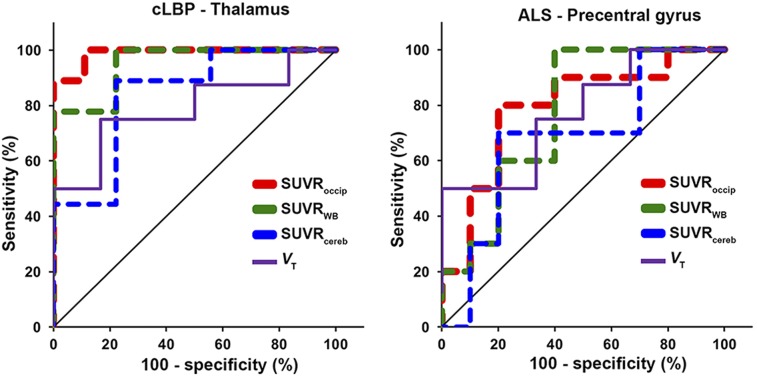
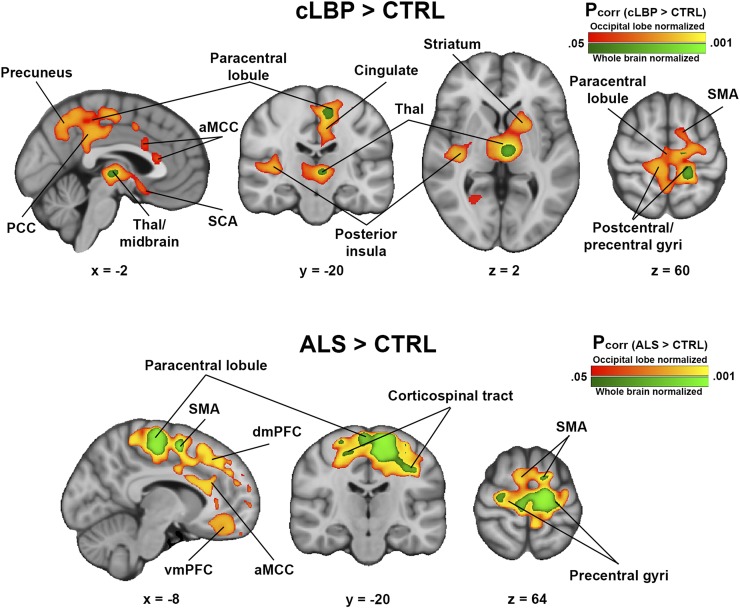
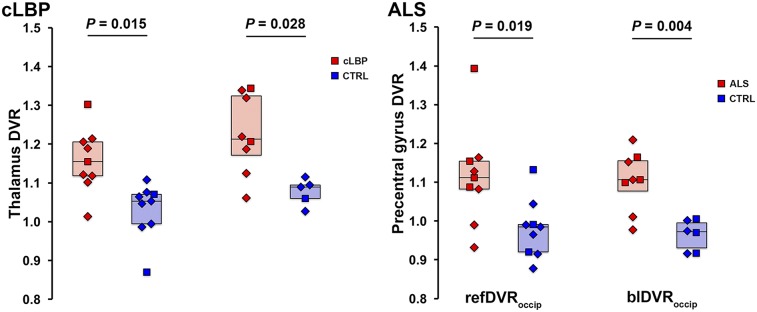
The translocator protein (TSPO) is a commonly used imaging target to investigate neuroinflammation. Although TSPO imaging demonstrates great promise, its signal exhibits substantial interindividual variability, which needs to be accounted for to uncover group effects that are truly reflective of neuroimmune activation. Recent evidence suggests that relative metrics computed using pseudoreference approaches can minimize within-group variability and increase sensitivity to detect physiologically meaningful group differences. Here, we evaluated various ratio approaches for TSPO imaging and compared them with standard kinetic modeling techniques, analyzing 2 different disease cohorts. Patients with chronic low back pain (cLBP) or amyotrophic lateral sclerosis (ALS) and matching healthy controls received 11C-PBR28 PET scans. The occipital cortex, cerebellum and whole brain were first evaluated as candidate pseudoreference regions by testing for the absence of group differences in SUV and distribution volume (VT) estimated with an arterial input function. The SUV from target regions (cLBP study, thalamus; ALS study, precentral gyrus) was normalized with the SUV from candidate pseudoreference regions (i.e., occipital cortex, cerebellum, and whole brain) to obtain SUVRoccip, SUVRcereb, and SUVRWB The sensitivity to detect group differences in target regions was compared using various SUVR approaches, as well as distribution volume ratio (DVR) estimated with (blDVR) or without arterial input function (refDVR), and VT Additional voxelwise SUVR group analyses were performed. We observed no significant group differences in pseudoreference VT or SUV, excepting whole-brain VT, which was higher in cLBP patients than controls. Target VT elevations in patients (P = 0.028 and 0.051 in cLBP and ALS, respectively) were similarly detected by SUVRoccip and SUVRWB, and by refDVR and blDVR (less reliably by SUVRcereb). In voxelwise analyses, SUVRoccip, but not SUVRcereb, identified regional group differences initially observed with SUVRWB, and in additional areas suspected to be affected in the pathology examined. All ratio metrics were highly cross-correlated, but generally were not associated with VT. Although important caveats need to be considered when using relative metrics, ratio analyses appear to be similarly sensitive to detect pathology-related group differences in 11C-PBR28 signal as classic kinetic modeling techniques. The occipital cortex may be a suitable pseudoreference region, at least for the populations evaluated, pending further validation in larger cohorts.
Keywords: astrocytes; human; microglia; neuroimmunology; neuroinflammation.
© 2018 by the Society of Nuclear Medicine and Molecular Imaging.
Figures
References
Publication types
MeSH terms
Substances
Grants and funding
LinkOut - more resources
Full Text Sources
Other Literature Sources
Miscellaneous