. 2017 Aug 17;8(1):275.
doi: 10.1038/s41467-017-00480-0.

Liquid-liquid phase separation of the microtubule-binding repeats of the Alzheimer-related protein Tau

Affiliations

Liquid-liquid phase separation of the microtubule-binding repeats of the Alzheimer-related protein Tau

Susmitha Ambadipudi et al. Nat Commun. .

Abstract

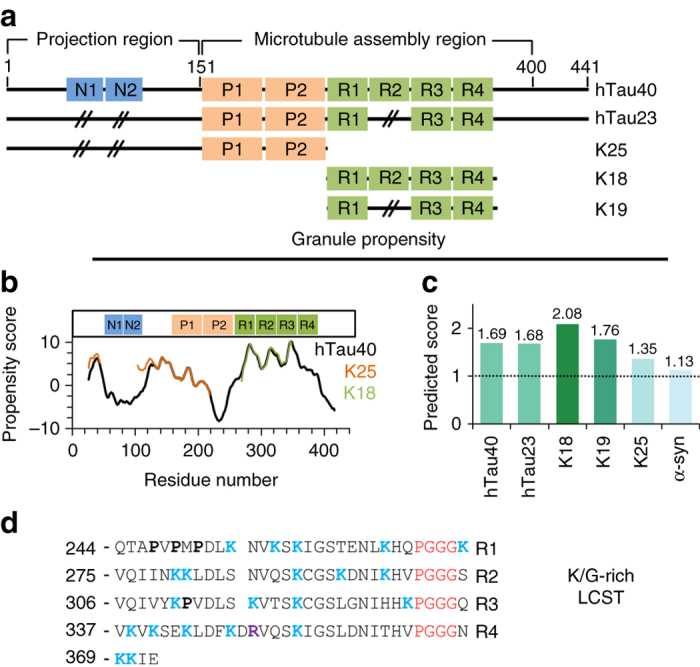
The protein Tau aggregates into tangles in the brain of patients with Alzheimer's disease. In solution, however, Tau is intrinsically disordered, highly soluble, and binds to microtubules. It is still unclear what initiates the conversion from an innocuous phase of high solubility and functionality to solid-like neurotoxic deposits. Here, we show that the microtubule-binding repeats of Tau, which are lysine-rich, undergo liquid-liquid phase separation in solution. Liquid-liquid demixing causes molecular crowding of amyloid-promoting elements of Tau and drives electrostatic coacervation. Furthermore, we demonstrate that three-repeat and four-repeat isoforms of Tau differ in their ability for demixing. Alternative splicing of Tau can thus regulate the formation of Tau-containing membrane-less compartments. In addition, phosphorylation of Tau repeats promotes liquid-liquid phase separation at cellular protein conditions. The combined data propose a mechanism in which liquid droplets formed by the positively charged microtubule-binding domain of Tau undergo coacervation with negatively charged molecules to promote amyloid formation.Tau forms aggregates in the brains of Alzheimer patients. Here, the authors identify conditions, where the microtubule-binding repeats of Tau undergo a phosphorylation-dependent liquid-liquid phase separation, leading to molecular crowding in the formed Tau liquid droplets and characterize them by NMR and other biophysical methods.


Conflict of interest statement

The authors declare no competing financial interests.

Figures

Fig. 1
Fig. 1
The Tau sequence encodes a strong propensity for lower-critical solution transition and granule formation. a Domain organization of the Alzheimer-related protein Tau. The longest Tau isoform (2N4R, htau40) in the human central nervous system contains four imperfect repeats (R1–R4) and two N-terminal inserts (N1, N2). htau23 (0N3R) is the shortest isoform and lacks the two N-terminal inserts as well as repeat R2. The Tau repeats form the core of NFTs. The protein K25 contains only the N-terminal half of Tau, which is called the projection region. b Residue-specific propensity score for granule formation predicted by catGranule for full-length 4R-Tau (hTau40), the repeat domain of 4R-Tau (K18), and K25. c Total catGranule-scores of different Tau proteins and α-synuclein (α-syn). d Amino-acid sequence of repeat domain of Tau. It contains 19 lysine residues (highlighted in blue) and four PGGG motifs (red)
Fig. 2
Fig. 2
The microtubule-binding domain of Tau undergoes LLPS. a Influence of protein concentration and pH on turbidity of a K18 solution (50 mM sodium phosphate) at 37 °C. Turbidity values are reported as average absorbance at 350 nm from triplicate measurements for each sample. Normalization was done with respect to A(max) at pH 8.8, 100 μM K18 concentration. Errors were propogated as normalized standard error of mean (SEM). Increasing pH values are colored from blue to red. Note that all experiments were done in the presence of 0.5 mM TCEP, to avoid oxidation of Tau’s native cysteine residues. b K18 (100 μM in 50 mM sodium phosphate) undergoes liquid–liquid demixing above a critical temperature (~15 °C), consistent with a LCST. Increasing pH values are colored from blue to red. c Differential interference microscopy reveals the time-dependent formation of liquid droplets in a 100 μM solution of K18 (50 mM sodium phosphate, pH 8.8) at 37 °C, in both the absence (top row) and presence (bottom) of the molecular crowding agent PEG (7.5%). Scale bars correspond to 10 μm. d ThT fluorescence intensities for the samples imaged in c (no PEG) by DIC microscopy. Average intensities from three independent measurements are shown. e Fluorescence microscopy demonstrates the presence of K18 in liquid droplets formed at 37 °C (100 μM K18 in 50 mM sodium phosphate, pH 8.8). At 5 °C, K18 LLPS did not occur (upper row). Alexa-488-labeled protein was mixed with unlabeled protein in a molar ratio of 1:20. Scale bars correspond to 10 μm. f Fusion of K18 liquid droplets. Droplets, which were undergoing fusion when imaged, are marked by black arrows. The sample was identical to the one used in c (72 h; with PEG). Scale bars correspond to 10 μm
Fig. 3
Fig. 3
Alternative RNA splicing influences liquid demixing of the microtubule-binding domain of Tau. a Temperature-dependent changes in turbidity (at 350 nm) of solutions containing K19 (repeat region of 3R-Tau; orange) and K18 (repeat region of 4R-Tau; blue). Both samples contained 100 μM protein in 50 mM sodium phosphate, pH 8.8 with 0.5 mM TCEP. Because of the presence of TCEP in the samples, C291/C322 (K18) and C322 (K19) were not oxidized, i.e., no intermolecular or intramolecular disulfide bonds were formed, which would differentially influence aggregation of 3R-Tau and 4R-Tau. The N-terminal half of Tau called projection region (K25; green; same sample conditions), which does not contain repeat sequences, did show at best very small changes in turbidity. b Liquid droplets observed for solutions of 10 μM K18 and 10 μM K19—both incubated at 37 °C—by DIC microscopy. Scale bars correspond to 10 μm. Buffer conditions were identical to a. Although DIC microscopy is not quantitative, multiple measurements on different samples consistently showed a larger number of droplets after 24 h of incubation at 37 °C in case of K18, i.e., the repeat region of 4R-Tau. No droplets were observed after 30 min. c Temperature-dependent changes in CD spectra of K18 (blue), K19 (orange), and K25 (green). Changes in β-structure were estimated from the ratio θ 197 nm/θ 218 nm. Smaller θ 197 nm/θ 218 nm values are indicative of an increase in β-structure. Error bars represent SEM of three independent measurements (10 scan averages)
Fig. 4
Fig. 4
K18 phase separation is reversible. CD spectroscopy (a) and DIC microscopy (b) of K18 at 5 °C (dispersed monomer) and 37 °C (LLPS), and after return to 5 °C. Scale bars correspond to 10 μm. In a, error bars represent SEM of five measurements
Fig. 5
Fig. 5
Liquid demixing causes molecular crowding of amyloid hot spots of Tau. a Two-dimensional 1H-15N HSQC spectra of the repeat domain of Tau (100 μM of K18 in 50 mM sodium phosphate, pH 8.8, and 0.5 mM TCEP) in the monomeric dispersed (blue; 5 °C) and liquid demixed (red; 37 °C) state. Due to increased solvent exchange, many 1H-15N cross-peaks of K18 are attenuated beyond detection at 37 °C. In addition, an overall shift of the backbone resonances was observed, which is caused by the temperature dependence of NMR chemical shifts. b Paramagnetic broadening in K18 (100 μM; sodium phosphate; pH 8.8), which was tagged with the nitroxide tag MTSL at the two native cysteine residues C291 and C322, was quantified in 2D 1H-13C HSQC spectra at 5 °C (left) and 37 °C (right). Paramagnetic and diamagnetic states are shown in gold and black, respectively. The Cα-Hα region of each spectrum is highlighted in the insets. c Selected region of the 1H-13C HSQC spectra shown in b, highlighting paramagnetic broadening of the four threonine residues in K18. d Quantification of paramagnetic broadening observed in 1H-13C HSQC spectra shown in b and c. Upon liquid demixing at 37 °C (100 μM protein concentration; also see Fig. 2), 1H-13C cross-peaks of T245, T263, T319, and T361 were strongly attenuated (1-I para/I dia). In contrast, at 5 °C where K18 is present as dispersed monomer (Fig. 2), only T319, which is in direct proximity to the MTSL-carrying C322, was broadened. Error bars are calculated based on the signal-to-noise in the NMR spectrum of diamagnetic K18. e Schematic representation of molecular crowding of Tau’s aggregation-prone hexapeptides (red) in the interior of liquid droplets. The sequence location of the two hexapeptides and Tau’s native cysteine residues (yellow; attachment sites of MTSL) is shown on the right. Threonine residues are highlighted in bold
Fig. 6
Fig. 6
LLPS of the repeat domain of Tau promotes fibrillization in presence of the polyanion heparin. a Addition of heparin to K18 droplets (100 μM of K18 in 50 mM sodium phosphate; 0.5 mM TCEP; pH 8.8; 37 °C; K18:heparin molar ratio of 4:1) results in formation of a phase-separated mesh. DIC micrographs show that the region, to which heparin was added (shown along dotted lines; +heparin), changes first. After 24 h, the mesh has dissolved and larger liquid droplets were observed. Scale bars correspond to 10 μm. b, d Influence of temperature on turbidity (b) and ThT fluorescence (d) of a K18 solution (100 μM K18 in 50 mM sodium phosphate, 0.5 mM TCEP, pH 8.8) in the absence of heparin. Prior to turbidity measurements, solutions were incubated at the specified temperature for 6 h. Error bars in bg represent SEM of three independent measurements. c, e Ionic strength dependence of turbidity (c) and ThT fluorescence (e) of heparin-free K18 solutions (100 μM K18 in sodium phosphate, 0.5 mM TCEP, pH 8.8). Prior to turbidity measurements, solutions were incubated at 37 °C for 24 h. f Temperature-dependence of amyloid formation of K18 (100 μM K18 in 50 mM sodium phosphate, pH 8.8) in the presence of heparin (K18:heparin molar ratio 4:1). Samples were incubated for 3 days at different temperatures (x-axis). At the end of the incubation period, amyloid formation was probed by ThT fluorescence measurements (y-axis). Because of the presence of 0.5 mM TCEP, K18 cysteine residues were not oxidized during the experiment. g Ionic strength dependence of K18 fibrillization in the presence of heparin (K18:heparin ratio 4:1; sodium phosphate, 0.5 mM TCEP, pH 8.8). Separate samples with increasing NaCl concentrations (x-axis) were prepared and incubated for 3 days at 37 °C. h Aggregation of K18 into amyloid fibrils in the presence of heparin after 3 days of incubation at 37 °C imaged by electron microscopy
Fig. 7
Fig. 7
Heparin binds to the dispersed K18 monomer at 5 °C. a 2D 1H-15N HSQC spectrum of K18 (100 μM) in the absence (black) and presence (green) of heparin (K18:heparin molar ratio of 4:1) recorded at 5 °C. b Residue-specific changes in NMR signal intensity demonstrate binding of heparin to K18; however, no fibrils were formed despite incubation for 3 days (Fig. 6f). Signal intensities in the absence (I 0) and presence of heparin (I) were taken from a. The green line shows the 3-residue average of I/I 0. Aggregation prone hexapeptide sequences in R2 and R3 are highlighted
Fig. 8
Fig. 8
MARK2-phosphorylation lowers the critical concentration of K18 LLPS. a 2D 1H-15N HSQC spectrum of K18 (100 μM protein in 50 mM sodium phosphate, pH 6.8) prior to (black) and after (red) phosphorylation by MARK2. NMR experiments were recorded at 5 °C. Cross-peaks of phosphorylated serine residues are labeled. b Residue-specific kinetics of phosphorylation of K18 by MARK2. Errors in “% phosphorylated” were calculated on the basis of the signal-to-noise ratio in the spectra and were below 3%. Because S293, S305, and S352 were only phosphorylated by about 10–20%, reliable analysis of their phosphorylation kinetics was not possible. For details on in vitro phosphorylation of K18, please see the experimental section. c Schematic representation of the serine residues of K18 that were phosphorylated in vitro by MARK2. S262, S324, and S356 were 100% phosphorylated (large dots), in agreement with previous results. d MARK2-phosphorylated K18 (50 mM sodium phosphate, pH 8.8, 0.5 mM TCEP) undergoes LLPS when incubated at a concentration of 2 μM at 37 °C (left panel), i.e., the concentration at which Tau is estimated to be present in neurons. Increasing the concentration of MARK2-phosphorylated K18 further enhanced LLPS. For example, after 24 h of incubation large droplets were present (right panel). Scale bars correspond to 10 μm. Because DIC micrographs are not quantitative, the most representative images of a large number of recorded micrographs are shown. e Non-phosphorylated K18 is located to liquid droplets, which are primarily formed by MARK2-phosphorylated K18. Non-phosphorylated K18 was labeled with Alexa-488, MARK2-phosphorylated K18 did not carry a fluorescent tag
Fig. 9
Fig. 9
Isoform-specific and phosphorylation-dependent LLPS of the microtubule-binding domain of Tau is important for amyloid formation. Schematic representation illustrating liquid–liquid demixing of Tau repeats as an important step in the cascade of aberrant Tau misfolding from monomeric dispersed protein in solution to insoluble tangles. Critical events in this process are alternative splicing, which determines the number of Tau repeats, and MARK2 phosphorylation that lowers the critical concentration of LLPS. In the interior of liquid droplets a supersaturated state is present, which recruits polyanions through electrostatic coacervation, thereby promoting amyloid formation under the reducing environment of a cell

References

    1. Williams DR. Tauopathies: classification and clinical update on neurodegenerative diseases associated with microtubule-associated protein tau. Intern. Med. J. 2006;36:652–660. doi: 10.1111/j.1445-5994.2006.01153.x. - DOI - PubMed
    1. Drubin D, Kirschner M. Tau protein function in living cells. J. Cell Biol. 1986;103:2739–2746. doi: 10.1083/jcb.103.6.2739. - DOI - PMC - PubMed
    1. Lee VM, Balin BJ, Otvos L, Jr., Trojanowski JQ. A68: a major subunit of paired helical filaments and derivatized forms of normal Tau. Science. 1991;251:675–678. doi: 10.1126/science.1899488. - DOI - PubMed
    1. Ballatore C, Lee VM, Trojanowski JQ. Tau-mediated neurodegeneration in Alzheimer’s disease and related disorders. Nat. Rev. Neurosci. 2007;8:663–672. doi: 10.1038/nrn2194. - DOI - PubMed
    1. Mucke L. Neuroscience: Alzheimer’s disease. Nature. 2009;461:895–897. doi: 10.1038/461895a. - DOI - PubMed

Publication types