. 2017 Aug 17;7(1):8564.
doi: 10.1038/s41598-017-08754-9.

Dissecting the genomic activity of a transcriptional regulator by the integrative analysis of omics data

Affiliations

Dissecting the genomic activity of a transcriptional regulator by the integrative analysis of omics data

Giulio Ferrero et al. Sci Rep. .

Abstract

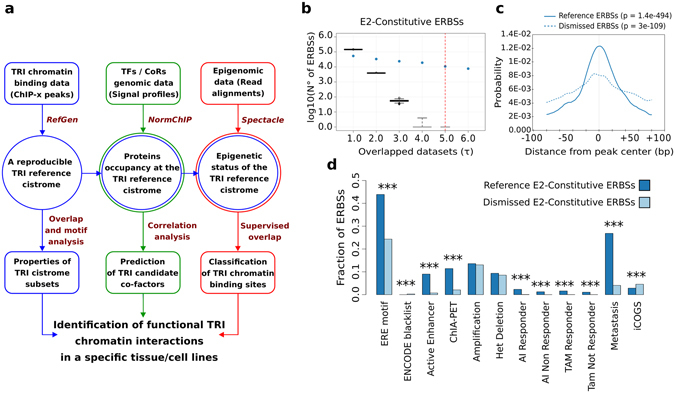
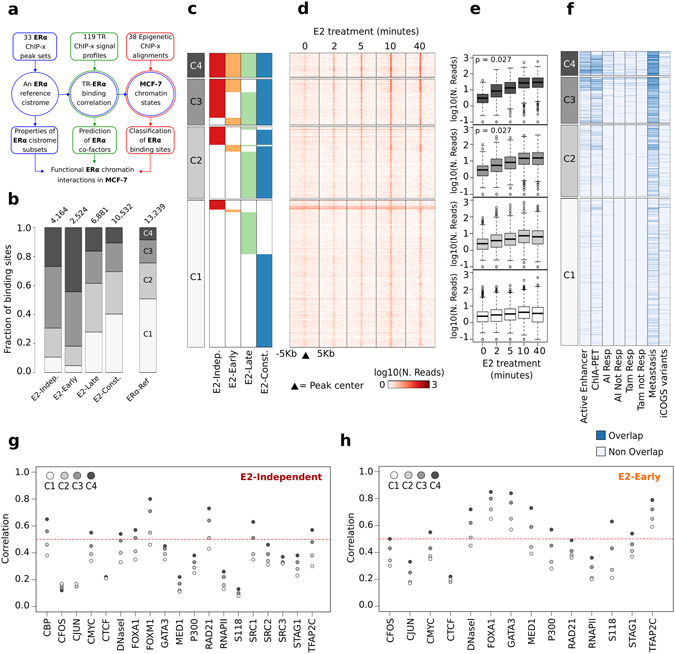
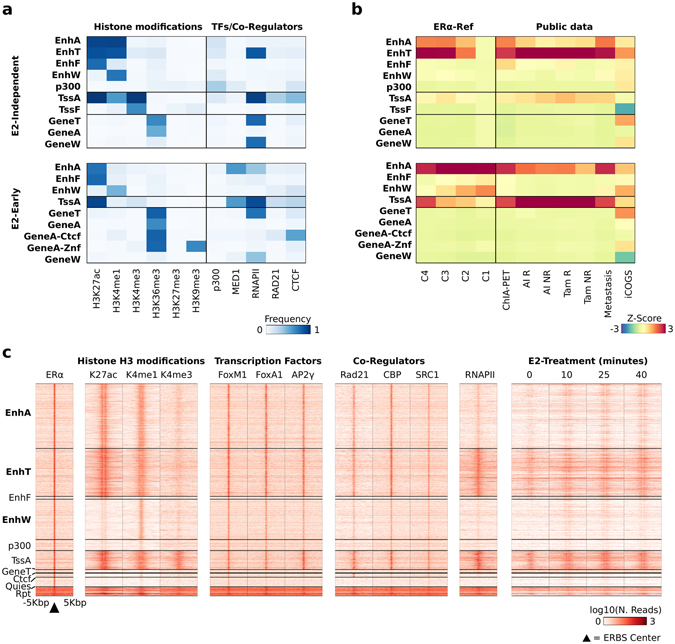
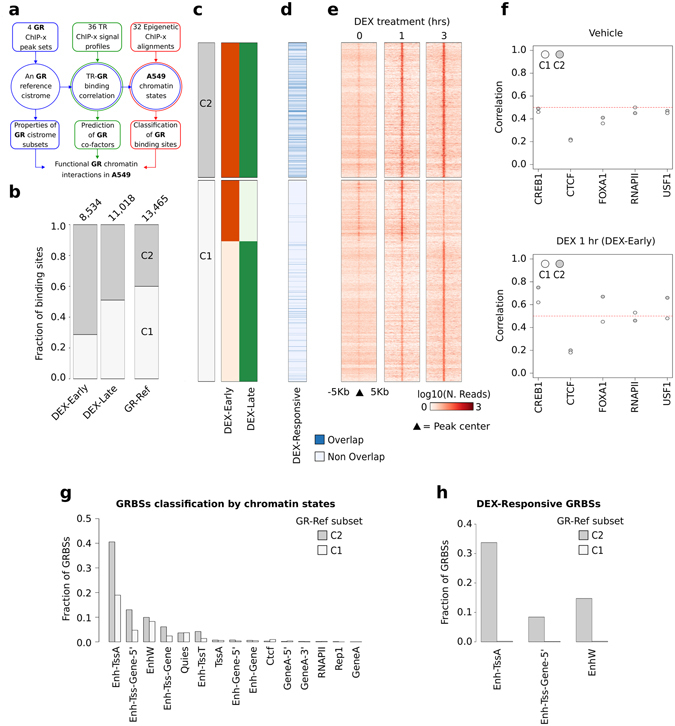
In the study of genomic regulation, strategies to integrate the data produced by Next Generation Sequencing (NGS)-based technologies in a meaningful ensemble are eagerly awaited and must continuously evolve. Here, we describe an integrative strategy for the analysis of data generated by chromatin immunoprecipitation followed by NGS which combines algorithms for data overlap, normalization and epigenetic state analysis. The performance of our strategy is illustrated by presenting the analysis of data relative to the transcriptional regulator Estrogen Receptor alpha (ERα) in MCF-7 breast cancer cells and of Glucocorticoid Receptor (GR) in A549 lung cancer cells. We went through the definition of reference cistromes for different experimental contexts, the integration of data relative to co-regulators and the overlay of chromatin states as defined by epigenetic marks in MCF-7 cells. With our strategy, we identified novel features of estrogen-independent ERα activity, including FoxM1 interaction, eRNAs transcription and a peculiar ontology of connected genes.


Conflict of interest statement

The authors declare that they have no competing interests.

Figures

Figure 1
Figure 1
An integrative strategy to analyze ChIP data. (a) Schematic representation of our integrative strategy applied in the analysis of the cistrome of a Transcriptional Regulator of Interested (TRI). Each column represents an analytical step designed to characterize the reference cistrome (left column, blue boxes), the TRI candidate cofactors (center column, green boxes), and the epigenetic classes of TRI binding sites (right column, red boxes). Rectangles indicate input and output data and the main analytical methods applied are reported. TF, Transcription Factor; CoR, Co-Regulator. (b) Box plot representing as blue dots the number of ERα Binding Sites (ERBSs) identified in at least a specified number of ERα ChIP studies performed in MCF-7 grown in estrogens-enriched medium (E2-Constitutive experimental context). Black box plots represent the number of random genomic regions with the same length that are overlapped using the same threshold (τ) selected for the ERBSs analysis. The red dashed bar indicates the threshold corresponding to the 75% of studies that we selected to define the ERα cistrome for the E2-Constitutive experimental context. (c) Line plot representing the probability of the Estrogen Response Element (ERE) motif within a window of +/−100 bp centered on E2-Constitutive ERBSs belonging to the E2-Constitutive cistrome (Reference ERBSs) or that were filtered-out by our analysis (Dismissed ERBSs). At top, the p-value from the motif analysis is reported. (d) Fraction of E2-Constitutive ERBSs overlapping independent genomic features including: ERE motif, ENCODE blacklisted genomic regions, ERα bound active enhancers previously identified in MCF-7 (Active Enhancer), genomic regions of ERα-mediated long-range chromatin interactions (ChIA-PET), genomic regions amplified or heterozygous deleted in MCF-7, ERBSs identified in breast cancer tissue from patients before receiving Aromatase Inhibitor (AI) or Tamoxifen (Tam) and that responded (R) or not (NR) to treatment, ERBSs identified in distal breast cancer metastases, and the list of variants from the iCOGS project.
Figure 2
Figure 2
The ERα reference cistrome (ERα-Ref) for MCF-7 cells. (a) Schematic representation of our strategy applied in the analysis of the ERα cistrome. (b) Bar plot reporting the ERα-Ref as divided by the experimental contexts or as a whole (fifth bar) and divided in co-occurrence subsets, i.e. ERBSs are classified in four subsets depending on whether they occur in a single context (C1), in two (C2), in three (C3) or in all the experimental contexts (C4) (increasing grey scale). At top of each bar, the number of ERBSs in each cistrome is reported. (c) Distribution of each context-specific cistrome (colors) into the C1–C4 subsets, inside each subset, ERBSs are ranked simply by their genomic coordinates. Red: E2-Independent; Orange: E2-Early; Green: E2-Late; Blue: E2-Constitutive; White: no binding detected. (d) Intensity heat map of a time-course ERα ChIP-Seq experiment performed in untreated or E2-treated MCF-7. (e) Box plot reporting for each time point, the distribution of average ERα ChIP-Seq read counts computed in a window of ±200 bp around ERBSs center. P-value from Mann-Kendall test considering the mean and the variance of each distribution. (f) Heat map reporting in blue the ERBSs overlapped with independent genomic features including: ERα bound active enhancers previously identified in MCF-7 (Active Enhancer), genomic regions of ERα-mediated long-range chromatin interactions (ChIA-PET), ERBSs identified in primary tumors from breast cancer patients who responded (R) or not (NR) to adjuvant treatment with Aromatase Inhibitor (AI) or Tamoxifen (Tam); ERBSs identified in distal breast cancer metastases; and the list of variants from iCOGS project. (g–h) Dot plot reporting, the average Pearson correlation coefficient computed between ERα ChIP signal and the signal of different TRs, chromatin accessibility signals measured by DNase-Seq experiment, and ChIP-Seq against ERα phosphorylation at Serine 118 (S118). The result for each ERα-Ref subset is reported.
Figure 3
Figure 3
Epigenetic-based classification of the ERα-Ref. (a) Heat maps reporting the frequency of significant ChIP signal of epigenetic modifications, TFs, and co-regulators overlapping the MCF-7 chromatin states predicted for the E2-Independent (top) and E2-Early (bottom) experimental contexts. (b) Heat map reporting the enrichment of the overlap between chromatin states and genomic annotations for the two experimental contexts considered. These annotations include: coordinates of regions involved in long-range chromatin interactions (ChIA-PET), ERBSs identified in tumors from breast cancer patients before receiving Aromatase Inhibitor (AI) or Tamoxifen (Tam) and that responded (R) or not (NR) to treatment, and list of variants from iCOGS project. (c) Intensity heat map reporting the normalized signal of different ChIP-Seq experiments measured in a window of ±5 kbp centered on each E2-Independent ERBS. The signal of ERα and H3K27ac, H3K4me1 and H3K4me3 histone modifications is reported on the left. The signal of the three ERα-correlated TFs and co-regulators is reported in the center. The signal of a RNAPII ChIP-Seq and a GRO-Seq experiment of E2-treated MCF-7 is reported on the right.
Figure 4
Figure 4
Integrative analysis of GR cistrome in A549 cell lines. (a) Schematic representation of our strategy applied in the analysis of the GR cistrome in A549 cells. (b) Bar plot reporting the GR-Ref as divided by the experimental contexts or as a whole (third bar) and divided in co-occurrence subsets, i.e. GRBSs are classified in two subsets depending on whether they occur in a single context (C1), or in the two experimental contexts considered (C2) (increasing grey scale). At top of each bar, the number of GRBSs in each cistrome is reported. (c) Representation of the distribution of GRBSs belonging to the two subsets in each context-specific cistrome is reported. GRBSs are organized by co-occurrence in different experimental contexts and then ranked by genomic coordinates. (d) Heat map reporting in blue the GRBSs overlapping experimentally validated DEX-Responsive GRBSs. (e) Intensity heat map of GR ChIP-Seq experiment performed in untreated or DEX-treated A549 cells. (f) Dot plot reporting, the average Pearson correlation coefficient computed between GR ChIP-Seq signal and the signal of different TRs. The result for each GR-Ref subset is reported. (g) Fraction of GR-Ref subsets classified in a specific chromatin state using the Spectacle algorithm.

References

    1. Dunham I, et al. An integrated encyclopedia of DNA elements in the human genome. Nature. 2012;489:57–74. doi: 10.1038/nature11247. - DOI - PMC - PubMed
    1. Li W, Notani D, Rosenfeld MG. Enhancers as non-coding RNA transcription units: recent insights and future perspectives. Nat. Rev. Genet. 2016;17:207–23. doi: 10.1038/nrg.2016.4. - DOI - PubMed
    1. Deplancke B, Alpern D, Gardeux V. The Genetics of Transcription Factor DNA Binding Variation. Cell. 2016;166:538–54. doi: 10.1016/j.cell.2016.07.012. - DOI - PubMed
    1. Swinstead EE, et al. Steroid Receptors Reprogram FoxA1 Occupancy through Dynamic Chromatin Transitions. Cell. 2016;165:593–605. doi: 10.1016/j.cell.2016.02.067. - DOI - PMC - PubMed
    1. Mathelier A, Shi W, Wasserman WW. Identification of altered cis-regulatory elements in human disease. Trends Genet. 2015;31:67–76. doi: 10.1016/j.tig.2014.12.003. - DOI - PubMed

Publication types

MeSH terms