. 2017 Aug 17;7(1):8499.
doi: 10.1038/s41598-017-08979-8.

Fast wide-volume functional imaging of engineered in vitro brain tissues

Affiliations

Fast wide-volume functional imaging of engineered in vitro brain tissues

G Palazzolo et al. Sci Rep. .

Abstract

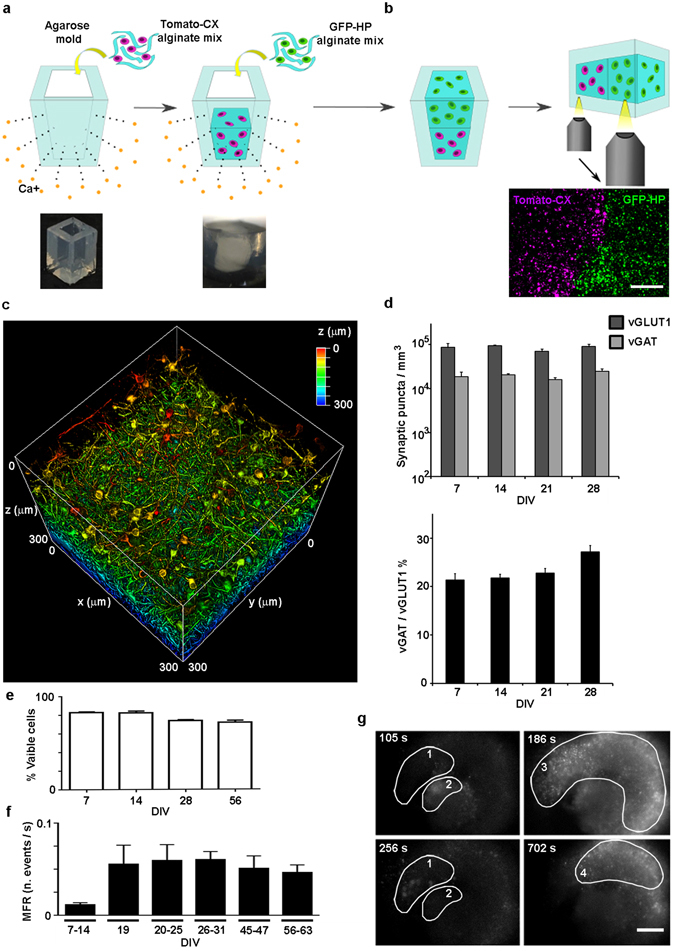
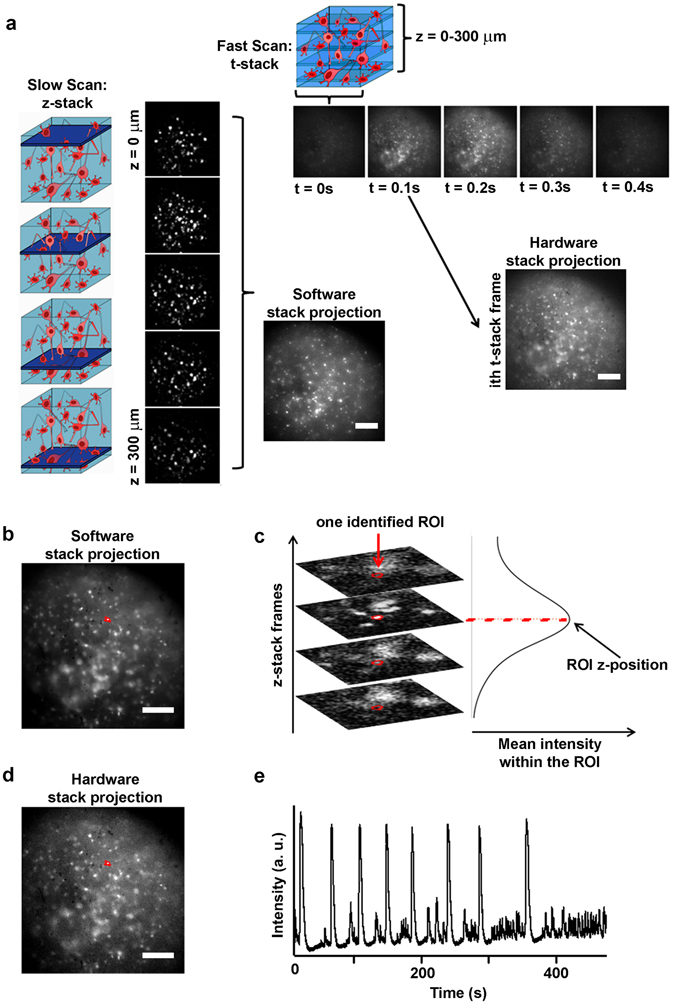
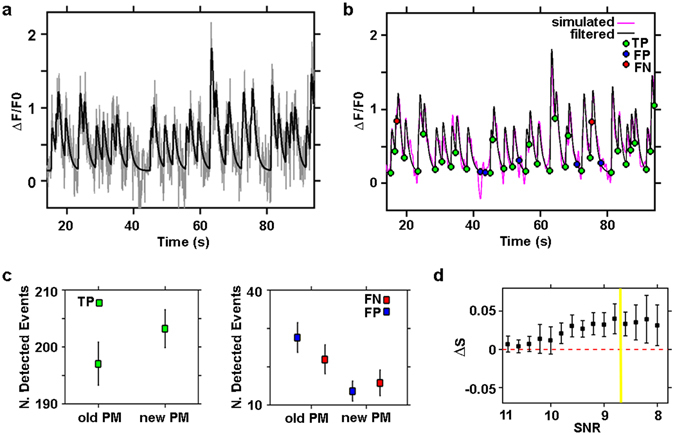
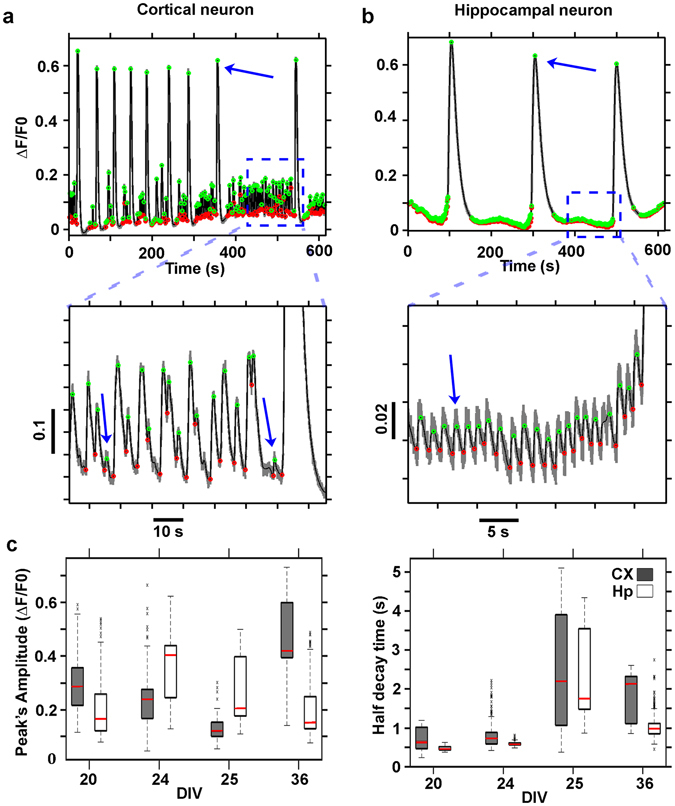
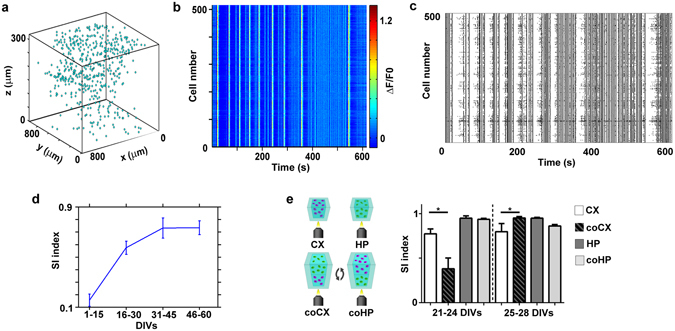
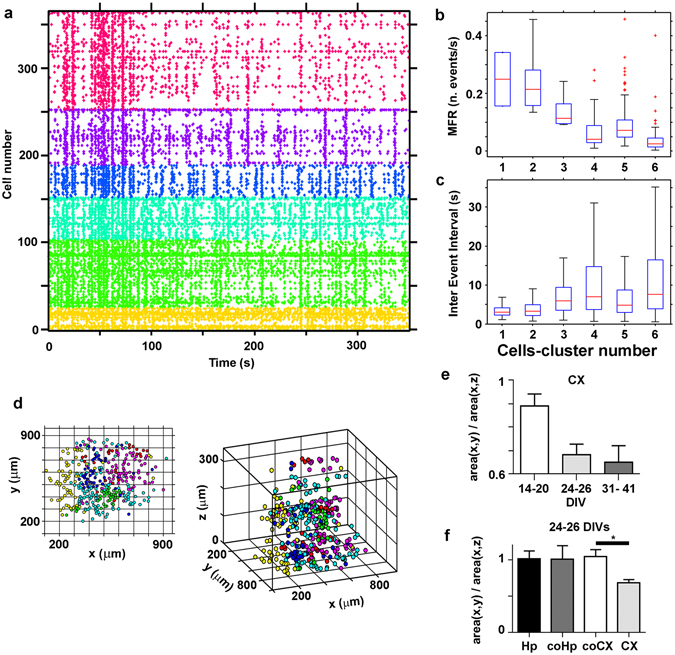
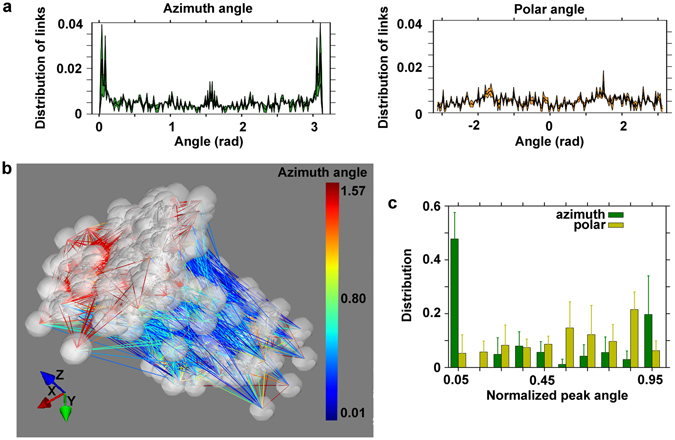
The need for in vitro models that mimic the human brain to replace animal testing and allow high-throughput screening has driven scientists to develop new tools that reproduce tissue-like features on a chip. Three-dimensional (3D) in vitro cultures are emerging as an unmatched platform that preserves the complexity of cell-to-cell connections within a tissue, improves cell survival, and boosts neuronal differentiation. In this context, new and flexible imaging approaches are required to monitor the functional states of 3D networks. Herein, we propose an experimental model based on 3D neuronal networks in an alginate hydrogel, a tunable wide-volume imaging approach, and an efficient denoising algorithm to resolve, down to single cell resolution, the 3D activity of hundreds of neurons expressing the calcium sensor GCaMP6s. Furthermore, we implemented a 3D co-culture system mimicking the contiguous interfaces of distinct brain tissues such as the cortical-hippocampal interface. The analysis of the network activity of single and layered neuronal co-cultures revealed cell-type-specific activities and an organization of neuronal subpopulations that changed in the two culture configurations. Overall, our experimental platform represents a simple, powerful and cost-effective platform for developing and monitoring living 3D layered brain tissue on chip structures with high resolution and high throughput.


Conflict of interest statement

The authors G. P., M. M., A. S., and F. D. declare conflict of interests having filed the Italian priority patent application IT 102016000097811 (UA2016A006940) on September 29, 2016.

Figures

Figure 1
Figure 1
Engineering the 3D neural network and characterizing the synaptic markers and the long-term calcium activity. (a) Scheme of the procedure to build, within an agarose rectangular parallelepiped, a 3D culture of primary neurons embedded in an alginate hydrogel. Gelation occurred due to the flux of calcium ions through the matrix. Below from left to right, the photographs of the agarose mold and of the alginate hydrogel - obtained with the BLIPS MacroLens - are shown; (b) the same gelling procedure, repeated in two steps, allowed to obtain a 3D layered co-culture of td-Tomato-expressing cortical neurons and GFP-expressing hippocampal neurons. By horizontally flipping the mold, it was possible to image both the layers and the interface. Below, the maximum intensity projection of 160 μm thick z-stack of a layered co-culture at 4 DIVs, acquired with an inverted Leica SP5 confocal microscope (5x air Olympus objective), is shown; magenta: cortical neurons, green: hippocampal neurons. Bar is 500 µm (c) 3D reconstruction of 300 μm z-stack of a cortical culture at 53 DIVs (25x, NA1, water immersion Olympus objective) with depth color code is shown (supplementary Video S1); (d) Bar plots showing the numbers (bottom) of the excitatory (vGLUT1) and inhibitory (vGAT) synaptic puncta per mm3t (top), and the vGAT/vGLUT1% ratio (bottom) We quantified the number of vGAT and vGLUT1 synaptic puncta per mm3 on three different confocal z-stacks (volume 310 × 310 × 20 µm) acquired on each of the three distinct hydrogels (n = 3) analyzed for each group of DIVs reported; data are shown as mean values + standard errors; (e) Bar plot of the percent of viable cells of 3D cortical cultures over time. We count an average value of about 140 ± 36 cells nuclei on a total of 36 confocal z-stacks with a volume of 310 × 310 × 40 µm. In details, we analyzed three distinct z-stacks for 3 distinct hydrogels, in each reported condition; (f) Bar plot showing the mean firing rate (MFR), expressed as number of events per second, of 3D cortical cultures over time; data shown are the mean values + standard errors, (n = 6) for each DIVs interval; (g) Four frames of fluorescence calcium imaging acquired on a GCaMP6s-expressing 3D cortical culture at 26 DIVs. The frames are extracted from a time lapse movie acquired with a wide field microscope equipped with a 4x air Olympus objective (supplementary video S2). Frame rate 20 Hz, FOV 2.4 × 1.8 mm. The images illustrate four distinct spatial patterns of activity, which are highlighted with numbered white circles. On the upper left corner, it is reported the time of the events. Bar is 350 µm.
Figure 2
Figure 2
Scheme of the wide volume imaging protocol. (a) On the left, a cartoon illustrates the slow axial scanning imaging condition, and the corresponding images constituting the acquired z-stack. The z-stack is then projected on a single image by software, in order to produce an extended depth of field image. On the top, a cartoon illustrates the fast axial scanning imaging condition, and the corresponding images constituting the acquired t-stack. Each image (ith image) of the t-stack represents an extended depth of field image of the same sample portion scanned and acquired in the slow scan condition; (b) Cell somata are identified on the software projection of the z-stack as ROIs (a ROI is highlighted in red). The images were acquired on a cortical culture at 24 DIVs; (c) Identification of the z position of the highlighted ROI. The mean intensity within the ROI is computed in each frame of the z-stack. The computed mean intensity versus image frames reaches a maximum value when the cell is in focus; (d) The same ROIs detected in the software projection image are over imposed on the hardware aided projection of the cortical culture of panel b (the ROI is also highlighted in panel b); (e) The mean intensity of the ROI is computed in each frame of the t-stack, in order to obtain the plot of fluorescence intensity versus time, representing the cell detected calcium activity. Bars are 150 µm.
Figure 3
Figure 3
Detection efficiency of the novel Perona-Malik filter. (a) Simulated neuronal calcium trace (black line) with added noise (gray line), SNR = 9; (b) Simulated neuronal calcium trace (black line) shown in (a), with superimposed filtered trace (magenta line) obtained from the trace with added noise (gray line) shown in panel (a). The green, blue and red circles indicate the onset time of true (TP) and false (FP) detected events, and the onset time of non-detected events (FN) respectively, through the novel Perona-Malik filter; (c) quantification of the classical Perona-Malik filter (old PM) and novel Perona-Malik filter (new PM) performance in detecting true calcium events (TP) on left panel. On the right panel, comparison of the two filters in missing true events (FN) and detecting false events (FP). The quantification of the performance of the filters was done on 30 simulated traces with SNR = 9. Data are shown as mean ± std (n = 30 simulated traces); (d) Comparison of the two filter sensitivity, quantified as sensitivity difference (ΔS), with respect to decreasing levels of signal to noise ratio (SNR). The sensitivity S of the filters was computed as the ratio between the number of detected true events (TP) divided by the total number of events within the traces (TP + FN). Data are shown as mean ± std (n = 30 simulated traces for each SNR value).
Figure 4
Figure 4
Calcium trace denoising and event detection. ΔF/F0 trace of a cortical neuron of a cortical 3D network at 24 DIVs (a) and of a hippocampal neuron of a hippocampal 3D network at 36 DIVs (b). The denoised traces are shown in black while the onset and offset of the events are marked, respectively, in green and red. The insets, below the graphs, show the small amplitude events which were detected; In (c) Box plots illustrating the distribution, at distinct DIVs, of peak amplitudes (left panel) and the half decay times (right panel) of the detected fluorescence fluctuation events of cortical (CX) and hippocampal neurons (Hp) traces. The value distributions in the box plots have been computed on all the detected traces (691 ÷ 1495 distinct cell traces) of n = 6, 7, 8, 4 cortical and n = 4, 3, 6, 6 hippocampal distinct hydrogels at respectively 20, 24, 25, 36 DIVs.
Figure 5
Figure 5
Structural and functional reconstruction of a representative 3D cortical network. (a) 3D representation of the cell somata positions, within the acquired volume portion of the 3D cortical neuronal network at 24 DIVs; (b) ΔF/F pseudo-color plot of the identified cells of the network shown in a). (c) raster plot of the same network as in a) and b) constructed after the automated calcium event detection analysis. (d) Plot showing the synchronicity index (SI) of 3D cortical cultures over time; data shown are the mean values ± standard errors (n = 17 for each group of DIVs); (e) On the left, a scheme of the optical monitoring layout of the compared conditions is shown (CX = cortical network analyzed in single cultures, HP = hippocampal network analyzed in single cultures, coCX = cortical network analyzed in layered co-cultures, coHP = hippocampal network analyzed in layered co-cultures). On the right, bar plot showing the synchronicity index (SI) of single and layered co-cultures at early and late DIVs; data shown are the mean values + standard errors (n = 7 for each group at 21–24 DIVs, and n = 13 for each group at 25–28 DIVs). Note that the data were grouped differently than in Fig. 4 to facilitate the comparison among different preparations (e.g. we managed to record only one co-culture at 36 DIVs).
Figure 6
Figure 6
Clustering of spike pattern activities. (a) Raster plot of a 3D cortical network at 26 DIVs, with cells ranked according to the functional clustering. Cells are divided into 6 classes according to their activity profiles over time; (b) Comparison of the distribution of the Mean Firing Rate (MFR) among the 6 detected clusters of the network of panel a); (c) Comparison of the distribution of the Inter Events Intervals (IEIs) among the 6 detected clusters of the network of panel a). Boxplots in (b and c) show the median and the interquartile range. Outliers are considered all those values whose distance from the first (or third) quartile is larger than 1.5 times the interquartile range. The results in (b and c) show that the calcium activity is significantly different between each pair of the identified clusters (Mann-Whitney U-test, p < 0.05, two-tailed); (d) Spatial distribution of the cell somata colored according to the clustering (x-y view on the left, x-y-z view on the right) of the network of panel a. The x-y view suggests that clusters are spatially localized. The 3D view, instead, suggests that they are well distributed along the third dimension; (e) Quantification of the ratio of average area covered by each cluster (divided by the number of cells belonging to the cluster) in the transversal view and in the coronal-sagittal view of 3D cortical cultures (indicated as CX in the figure panel). The covered area differs significantly between the two views at DIVs > 14 (Mann-Whitney U-test, n = 13, 14, 9 total number of clusters identified in three distinct experiments of the groups of 14–20 DIVs, 24–26 DIVs and 31–41 DIVs respectively, p = 0.7869, p = 0.0085 and p = 0.0117 respectively, two-tailed) for cortical neuronal networks in panel e). Data are shown as mean + standard errors. (f) The same quantification reported in panel e), for single hippocampal (Hp) cortical (CX) culture, and cortical (coCX) or hippocampal networks (coHp) analyzed in layered co-cultures at 24–26 DIVs. (Mann-Whitney U-test, n = 13, 8, 9, 14 total number of clusters identified in three distinct experiments of the groups Hp, coHp, coCX and CX respectively, p = 0.0317, two-tailed).
Figure 7
Figure 7
Properties of the functional graph. (a) The azimuth (left panel) angle of the detected functional links of a cortical neuronal network (32 DIVs) has a peak at 0, π (i.e. along the z-axis, the vertical axis) and at π/2 radian. The corresponding polar (right panel) angle fluctuates around the value 0.005. (b) Illustrative plot of the 3D cell culture at 32 DIVs of panel a), showing the predominance of vertical links (blue) with the coexistence of horizontal links (red). The vertical links (blue) correspond to the peaks of the azimuth angle at 0 and π radians. The horizontal links (red) correspond to the peak at π/2 radians. Note that the dimensions of the plot are not to scale and have been stretched to evidence the orientation of the links in the network, and all the recorded cells of the network on the entire volume view of the optical system (800 × 800 × 300 µm) are reported. (c) The vertical orientation is a general feature of the studied 3D cortical single-cultures. Population summary histogram of the distribution of normalized polar and azimuth orientation angles of the detected neuronal links. Data shown are the mean values + standard errors (the groups consisted of 20, 22 24 and 13 cell cultures, respectively).

References

    1. Bonifazi P, et al. In vitro large-scale experimental and theoretical studies for the realization of bi-directional brain-prostheses. Front. Neural Circuits. 2013;7 doi: 10.3389/fncir.2013.00040. - DOI - PMC - PubMed
    1. Terrasso AP, et al. Novel scalable 3D cell based model for in vitro neurotoxicity testing: Combining human differentiated neurospheres with gene expression and functional endpoints. J. Biotechnol. 2015;205:82–92. doi: 10.1016/j.jbiotec.2014.12.011. - DOI - PubMed
    1. Aebersold MJ, et al. ‘Brains on a chip’: Towards engineered neural networks. TrAC - Trends in Analytical Chemistry. 2016;78:60–69. doi: 10.1016/j.trac.2016.01.025. - DOI
    1. Soloperto A, et al. Modulation of Neural Network Activity through Single Cell Ablation: An in Vitro Model of Minimally Invasive Neurosurgery. Molecules. 2016;21 doi: 10.3390/molecules21081018. - DOI - PMC - PubMed
    1. Ribeiro A, Vargo S, Powell EM, Leach JB. Substrate Three-Dimensionality Induces Elemental Morphological Transformation of Sensory Neurons on a Physiologic Timescale. Tissue Eng. Part A. 2012;18:93–102. doi: 10.1089/ten.tea.2011.0221. - DOI - PMC - PubMed

Publication types

MeSH terms

Substances