Comparative Study
. 2017 Aug 17;7(1):8523.
doi: 10.1038/s41598-017-07885-3.

The saliva microbiome profiles are minimally affected by collection method or DNA extraction protocols

Affiliations
Comparative Study

The saliva microbiome profiles are minimally affected by collection method or DNA extraction protocols

Yenkai Lim et al. Sci Rep. .

Abstract

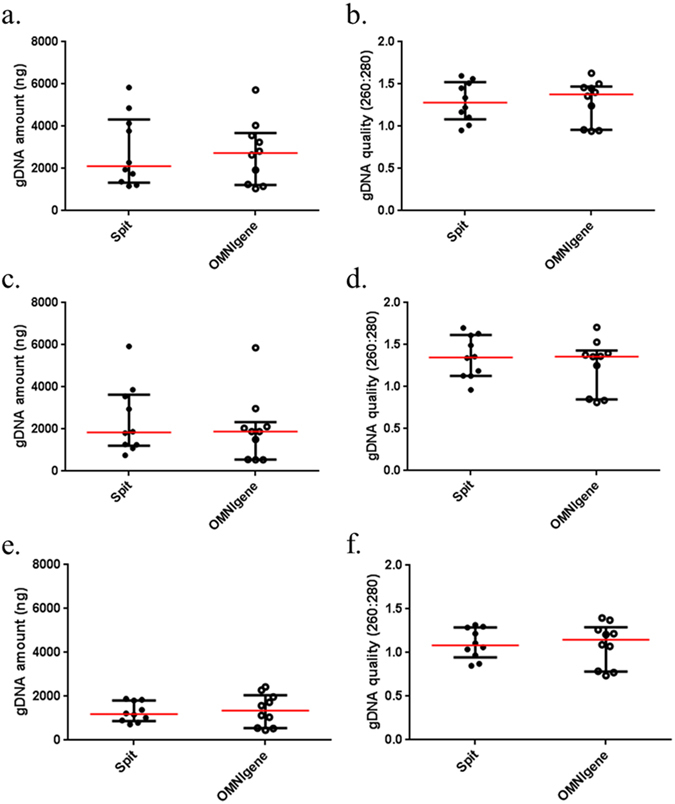
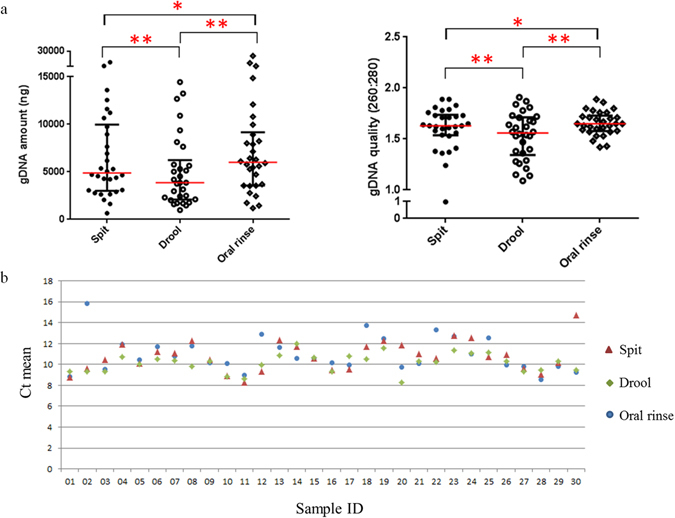
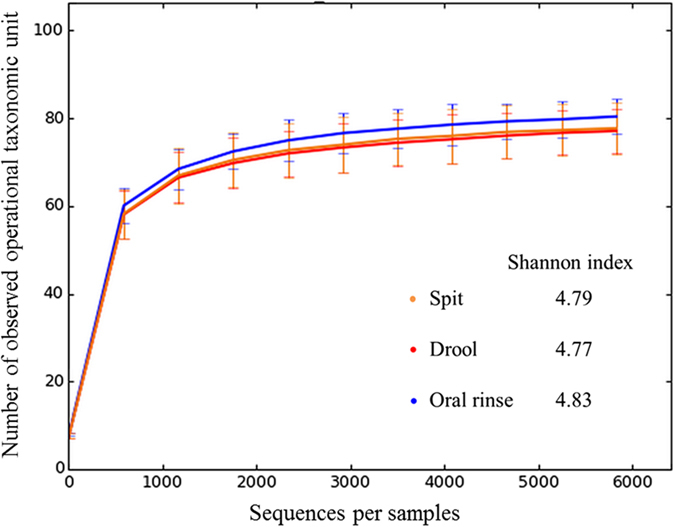
Saliva has attracted attention as a diagnostic fluid due to the association of oral microbiota with systemic diseases. However, the lack of standardised methods for saliva collection has led to the slow uptake of saliva in microbiome research. The aim of this study was to systematically evaluate the potential effects on salivary microbiome profiles using different methods of saliva collection, storage and gDNA extraction. Three types of saliva fractions were collected from healthy individuals with or without the gDNA stabilising buffer. Subsequently, three types of gDNA extraction methods were evaluated to determine the gDNA extraction efficiencies from saliva samples. The purity of total bacterial gDNA was evaluated using the ratio of human β-globin to bacterial 16S rRNA PCR while 16S rRNA gene amplicon sequencing was carried out to identify the bacterial profiles present in these samples. The quantity and quality of extracted gDNA were similar among all three gDNA extraction methods and there were no statistically significant differences in the bacterial profiles among different saliva fractions at the genus-level of taxonomic classification. In conclusion, saliva sampling, processing and gDNA preparation do not have major influence on microbiome profiles.


Conflict of interest statement

The authors declare that they have no competing interests.

Figures

Figure 1
Figure 1
Study design overview. From Fig. 1a, Maxwell® 16 LEV Blood Kit was found to be the most efficient bacterial gDNA extraction method when spit samples were collected in 50 mL sterile Falcon tube. Hence, OMNIgene and other salivary bacterial gDNA extraction methods were excluded from the second part of the study (Fig. 1b).
Figure 2
Figure 2
Extracted salivary gDNA from different saliva collection methods. Scatter plots for the average quantity and quality of the extracted gDNA triplicates from each collection and extraction method (a., b. Maxwell® 16 LEV blood DNA kit; c., d. in-house phenol-chloroform extraction and e., f. QIAamp DNA Microbiome Kit).
Figure 3
Figure 3
Extracted salivary gDNA from different bacterial gDNA extraction methods. Scatter plots for the average quantity and quality of the extracted gDNA triplicates from each collection (a., b. spit from 50 mL Falcon tube and c., d. OMNIgene) and extraction (MW represents Maxwell® 16 LEV blood DNA kit; PC represents in-house phenol-chloroform extraction and QM represents QIAamp DNA Microbiome Kit) method. Significant differences are denoted with *=p < 0.05, **p = < 0.01, ***=p < 0.001, ****=p < 0.0001 respectively.
Figure 4
Figure 4
Extracted salivary gDNA from different saliva fractions. (a) Scatter plots for the quantity and quality of the extracted bacterial gDNA from each saliva fraction. Significant differences are denoted with *=p < 0.05, **=p < 0.01, ***=p < 0.001, ****=p < 0.0001 respectively. (b) Bacterial 16S rRNA and human β-globin qPCR Ct means distribution trend for the extracted gDNA from spit, drool and oral rinse.
Figure 5
Figure 5
Rarefaction curve for observed operational taxonomic units against sequences per sample for spit, drool and oral rinse.
Figure 6
Figure 6
Beta-diversity of salivary microbiome. Weighted (a) and unweighted (b) PCoA plot for spit, drool and oral rinse samples with respective adjacent plots emphasizing on the subjects in different representing colours.
Figure 7
Figure 7
Salivary microbiome genera redundancy analysis on different (a) saliva fractions and (b) subjects.

References

    1. na Head and Neck Cancer Biomarkers Detected in Saliva. Cancer Biol Ther4, 6–12 (2005).
    1. Pepe MS, et al. Phases of Biomarker Development for Early Detection of Cancer. J Natl Cancer Inst. 2001;93:1054–1061. doi: 10.1093/jnci/93.14.1054. - DOI - PubMed
    1. Lucs AV, Saltman B, Chung CH, Steinberg BM, Schwartz DL. Opportunities and challenges facing biomarker development for personalized head and neck cancer treatment. Head Neck. 2013;35:294–306. doi: 10.1002/hed.21975. - DOI - PMC - PubMed
    1. Bandhakavi S, Stone MD, Onsongo G, Van Riper SK, Griffin TJ. A dynamic range compression and three-dimensional peptide fractionation analysis platform expands proteome coverage and the diagnostic potential of whole saliva. J. Proteome Res. 2009;8:5590–5600. doi: 10.1021/pr900675w. - DOI - PMC - PubMed
    1. Iorgulescu G. Saliva between normal and pathological. Important factors in determining systemic and oral health. J Med Life. 2009;2:303–307. - PMC - PubMed

Publication types

MeSH terms

LinkOut - more resources