. 2017 Aug 17;7(1):8590.
doi: 10.1038/s41598-017-08713-4.

Distinct carbon sources affect structural and functional maturation of cardiomyocytes derived from human pluripotent stem cells

Affiliations

Distinct carbon sources affect structural and functional maturation of cardiomyocytes derived from human pluripotent stem cells

Cláudia Correia et al. Sci Rep. .

Abstract

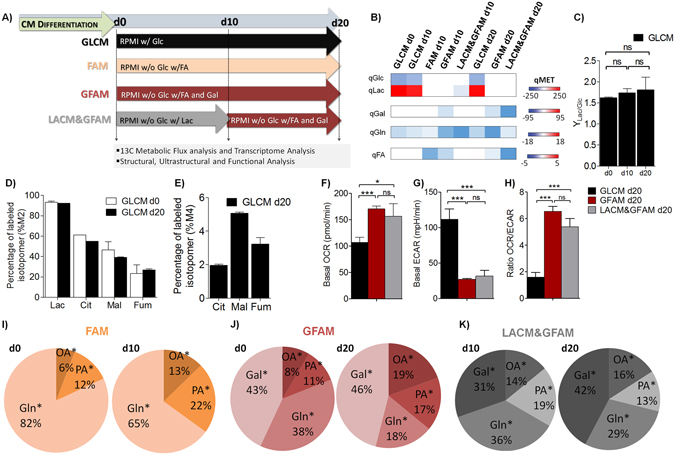
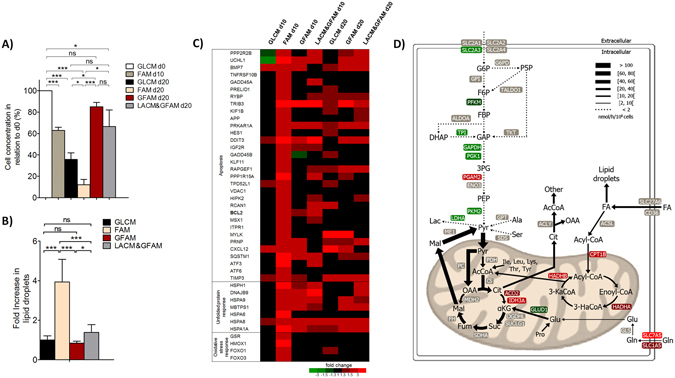
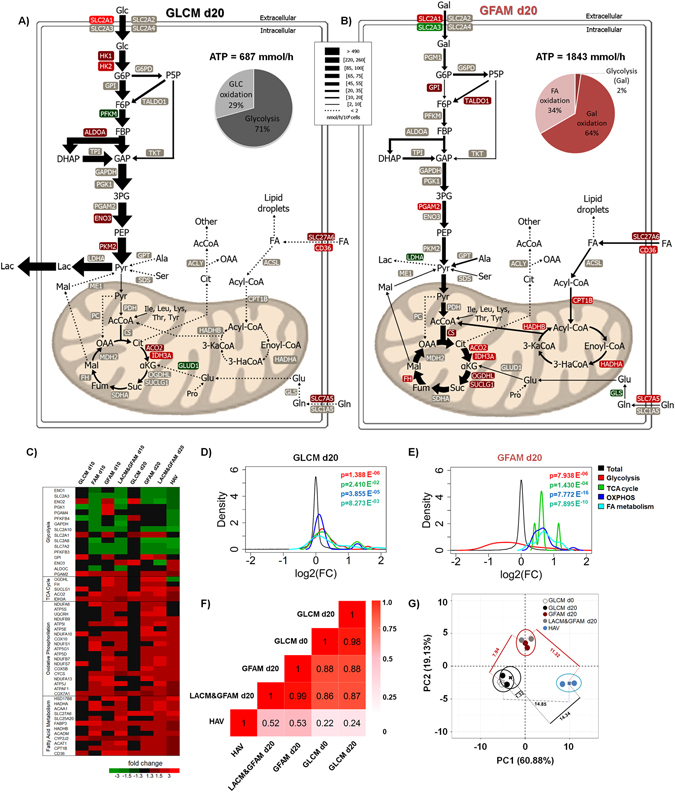
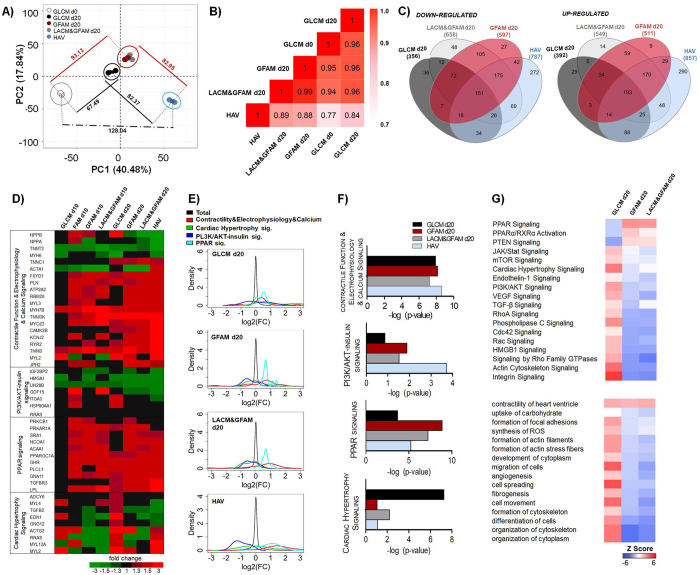
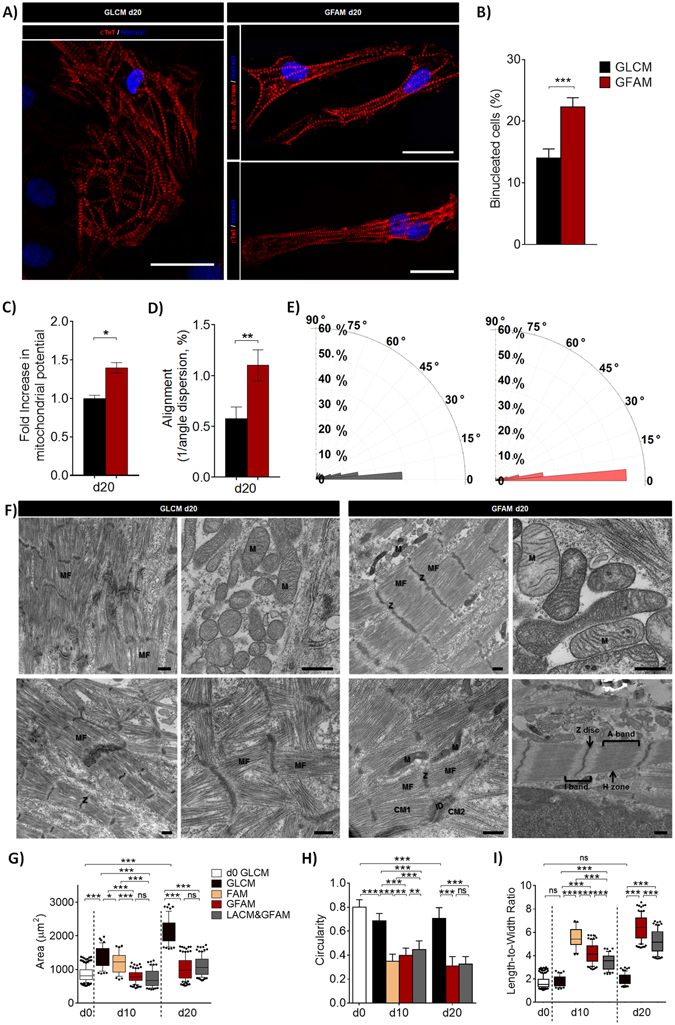
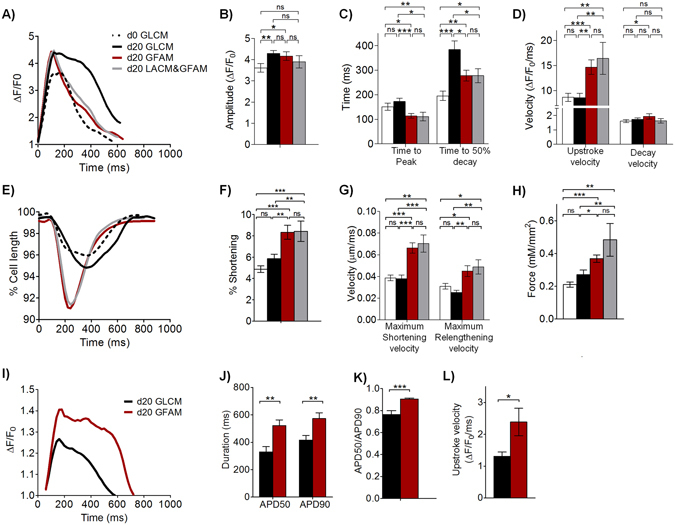
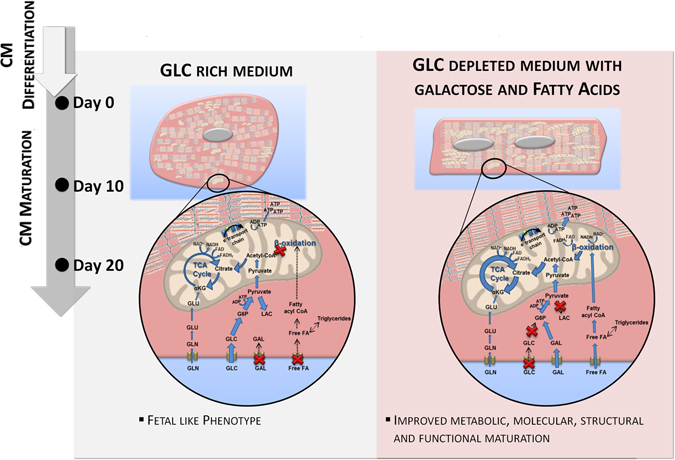
The immature phenotype of human pluripotent stem cell derived cardiomyocytes (hPSC-CMs) constrains their potential in cell therapy and drug testing. In this study, we report that shifting hPSC-CMs from glucose-containing to galactose- and fatty acid-containing medium promotes their fast maturation into adult-like CMs with higher oxidative metabolism, transcriptional signatures closer to those of adult ventricular tissue, higher myofibril density and alignment, improved calcium handling, enhanced contractility, and more physiological action potential kinetics. Integrated "-Omics" analyses showed that addition of galactose to culture medium improves total oxidative capacity of the cells and ameliorates fatty acid oxidation avoiding the lipotoxicity that results from cell exposure to high fatty acid levels. This study provides an important link between substrate utilization and functional maturation of hPSC-CMs facilitating the application of this promising cell type in clinical and preclinical applications.


Conflict of interest statement

The authors declare that they have no competing interests.

Figures

Figure 1
Figure 1
Effect of culture medium composition on central carbon metabolism of hiPSC-CMs. (A) Representative scheme illustrating the experimental set-up. The metabolome of hiPSC-CMs was evaluated before (d0) and after 10 (d10) and 20 days (d20) of culture in different media: GLCM (black), FAM (Orange), GFAM (Red) and LACM&GFAM (Grey). (B) Heatmap image of metabolome data illustrating specific consumption (blue) and production (red) rates of metabolites (qMET; nmol/(106cell.h)). (C) Ratio of Lac production to Glc consumption (YLac/Glc) in GLCM through culture time. (D) Percentage of labelled M2 isotopomers from [1,2-13C]Glc in Lac and in TCA intermediates (Cit, Fum, Mal). (E) Percentage of labelled M4 isotopomers from [U-13C]Gln in TCA intermediates. M2 and M4, reflect the first round of TCA cycling of [1,2-13C]Glc and [U-13C]Gln, respectively. (F) Basal oxygen consumption rate (OCR). (G) Extracellular acidification rate (ECAR). (H) OCR/ECAR ratio reflecting the relative contribution of OXPHOS over glycolysis for energy generation. (IK) Pie charts indicating the contribution of the main substrates of each media, for TCA cycle pools. The percentages were determined based on the incorporation of each labelled substrate in Cit, Fum and Mal. OA: Oleic Acid and PA: Palmitic acid. Data are represented as mean ± SD of 12–24 wells, n ≥ 3 separate experiments. *p < 0.05; ***p < 0.001; ns, not significant.
Figure 2
Figure 2
In the absence of a sugar source, fatty acid rich medium induces lipotoxicity in hiPSC-CMs. (A) Percentage of cell concentration, in all conditions tested, in relation to day 0 (d0), assessed using the Trypan Blue Exclusion Method. (B) Analysis of lipid droplet content using a lipid droplet-specific fluorescent dye (Nile Red) of hiPSC-CMs at day 15. Fluorescence values were normalized for the values obtained in cells cultivated in GLCM. Data are represented as mean ± SD. *p < 0.05; ***p < 0.001; ns, not significant. n ≥ 10 separate experiments. (C) Heat map of differentially expressed genes closely related with apoptosis, unfolded protein and oxidative stress responses in hiPSC-CMs cultivated in different culture media. Genes were considered up- or down-regulated based on a fold change in expression FC ≥ |1.3| compared to d0. Heatmap shows averaged values from n = 2. (D) Metabolic flux map of the central carbon metabolism of hiPSC-CMs cultivated for 10 days in FAM. The flux map was determined using non-stationary 13C-MFA. Arrow thickness reflects flux values (see Table S1 for exact flux values).
Figure 3
Figure 3
Effect of culture media composition on the fluxome and metabolic transcriptome of hiPSC-CMs. Metabolic flux maps highlighting central carbon metabolism of hiPSC-CMs cultured in GLCM (A) and GFAM (B). The contribution of each metabolic pathway for ATP production is specified in the pie chart and the total amount of ATP produced is indicated above the pie chart. Up-regulated and down-regulated genes encoding metabolic enzymes are demarked in red and green, respectively. (C) Heat map of differentially expressed genes associated with metabolic processes/pathways. A complete list of the genes and respective FC can be found in Table S2. Heatmap shows averaged values from n = 2. (DE) Density plots generated with fold change expression of genes from the four metabolic processes showed in (C), for hiPSC-CMs in GLCM (D) and GFAM (E) at day 20. X axis indicates log2 fold change in gene expression. Black line indicates expression of all genes. Colored lines toward the left and right side of the black line indicate down-regulation and up-regulation of pathways, respectively. Kolmogorov-Smirnov test was used to calculate p-values. (F) Pairwise Pearson correlation coefficients using expression data for the metabolic processes showed in (C). The highest and the lowest coefficients are colored in a red to white gradient. (G) 2D principal component analysis using expression data for the metabolic processes showed in (C). Euclidean distances between PCA centroids of each condition, calculated considering the first (PC1) and second (PC2) components, are also highlighted.
Figure 4
Figure 4
Effect of culture medium composition on hiPSC-CM transcriptional profiling. (A) 2D principal component analysis of all genes significantly enriched (p < 0.01) in hiPSC-CM cultures at day 0, after 20 days of culture in GLCM, GFAM and LACM&GFAM and HAV tissue samples. Euclidean distances between PCA centroids of each condition, calculated considering PC1 and PC2, are also highlighted. (B) Pairwise Pearson correlation coefficients using expression data of all enriched genes (p < 0.01). (C) Venn diagrams of overlapping differentially-expressed genes (p < 0.01 and FC ≥ |1.3|) among GLCM, GFAM, LACM&GFAM cultures at day 20 and HAV tissue. (D) Heatmap depicting changes in the expression of genes involved in biological processes/pathways closely associated with CM development and function. (EF) Density plots generated with fold change expression of genes from the four cardiac-related categories shown in (D), for day 20 cultures (GLCM, GFAM and LACM&GFAM). Black line indicates expression of all genes. Colored lines toward the left and right side of the black line indicate down-regulation and up-regulation of pathways, respectively. Kolmogorov-Smirnov test was used to calculate p-values. (G) Heatmaps highlighting the activation status of canonical pathways (upper panel) and biological functions (lower panel) predicted by IPA. Functions/pathways were considered significantly activated (or inhibited) with an overlap p-value ≤ 0.05 and an IPA activation Z-score ≥ |2.0|. Red indicates positive Z-score (activated function) and blue indicates negative Z-score (inhibited function).
Figure 5
Figure 5
Structural and ultrastructural analyses of hiPSC-CMs after culture in different media. (A) Representative images of hPSC-CMs immunostained for cardiac troponin-T (cTnT) and α-sarcomeric actinin (red). Nuclei (blue) were stained with Hoechst 33342. Scale bars = 30 μm. (B) Percentage of binucleated hiPSC-CMs in GLCM and GFAM (n > 20 per condition). C) Fold increase in mitochondria potential assessed by the mitochondria specific dye Mitoview. Fluorescence values were normalized for the values obtained in cells cultivated in GLCM. (D-E) Sarcomere alignment in hiPSC-CMs cultured for 20 days in GLCM and GFAM: (D) Inverse of the magnitude of sarcomere angle dispersion and (E) Rose plot histogram of sarcomere orientation. n > 30 sarcomeres per condition. (F) TEM images of hiPSC-CMs. Myofibrils (MF), Z-disks (Z), sarcomeric bands: A- and I-bands with a H-zone, intercalated disks (ID) connecting adjacent CMs and Mitochondria (M) are highlighted. Scale bars = 500 nm. (GI) Cell structure characterization in terms of cell area (G), circularity index (H), length-to-width ratio (I). n > 70 cells per condition from at least 5 separate experiments. Data are represented as mean ± SD. *p < 0.05; **p < 0.01; ***p < 0.001; ns, not significant.
Figure 6
Figure 6
Impact of metabolic manipulation on hiPSC-CM functionality. hiPSC-CMs were analyzed in terms of calcium transients (AD), contractile performance (EH) and action potential (AP) kinetics (IL), before (d0) and after 20 days (d20) of culture in different media. Calcium transient kinetics (AD) evaluated with the intracellular calcium indicator Fluo-4 AM: (A) Representative calcium transient; (B) Calcium transient amplitude (F/F0); (C) Time to peak and time to 50% decay; (D) Average upstroke and decay velocities. n = 28–35 cells per condition from 3 separate experiments. (E) Representative contraction curves, reflecting changes in the percentage of cell length. (F) Percentage of shortening; (G) Maximum shortening and relengthening velocities. n = 20–35 cells per condition. (H) Maximum contractile force generated by hiPSC-CMs in each culture condition. n = 8–17 cells per condition from 3 separate experiments. AP kinetics (I–L) were determined with a voltage-sensitive dye (FluoVolt). (I) Changes in the fluorescence intensity of the FluoVolt AP indicator over time. (J) AP duration at 50% (APD50) and 90% repolarization (APD90). (K) APD50/APD90. (L) AP upstroke velocity. n = 24–26 cells per condition from 3 separate experiments. Data are represented as mean ± SEM. *p < 0.05; **p < 0.01; ***p < 0.001; ns, not significant.
Figure 7
Figure 7
Summary of major findings in this study. The main differences in terms of cell phenotype and metabolism after 20 days of culture in GLCM and GFAM are highlighted.

References

    1. Denning C, et al. Cardiomyocytes from human pluripotent stem cells: From laboratory curiosity to industrial biomedical platform. Biochim. Biophys. Acta - Mol. Cell Res. 2015;1863:1728–1748. doi: 10.1016/j.bbamcr.2015.10.014. - DOI - PMC - PubMed
    1. Feric NT, Radisic M. Maturing human pluripotent stem cell-derived cardiomyocytes in human engineered cardiac tissues. Adv. Drug Deliv. Rev. 2016;96:110–134. doi: 10.1016/j.addr.2015.04.019. - DOI - PMC - PubMed
    1. Yang X, Pabon L, Murry CE. Engineering adolescence: Maturation of human pluripotent stem cell-derived cardiomyocytes. Circulation Research. 2014;114:511–523. doi: 10.1161/CIRCRESAHA.114.300558. - DOI - PMC - PubMed
    1. Lundy SD, Zhu W-Z, Regnier M, Laflamme M. Structural and Functional Maturation of Cardiomyocytes Derived From Human Pluripotent Stem Cells. Stem Cells Dev. 2013;22:1991–2002. doi: 10.1089/scd.2012.0490. - DOI - PMC - PubMed
    1. Chan Y-C, et al. Electrical stimulation promotes maturation of cardiomyocytes derived from human embryonic stem cells. J. Cardiovasc. Transl. Res. 2013;6:989–99. doi: 10.1007/s12265-013-9510-z. - DOI - PubMed

Publication types

MeSH terms