. 2017 Aug 17;7(1):8526.
doi: 10.1038/s41598-017-08581-y.

Novel STAT binding elements mediate IL-6 regulation of MMP-1 and MMP-3

Affiliations

Novel STAT binding elements mediate IL-6 regulation of MMP-1 and MMP-3

Samuel J Cutler et al. Sci Rep. .

Abstract

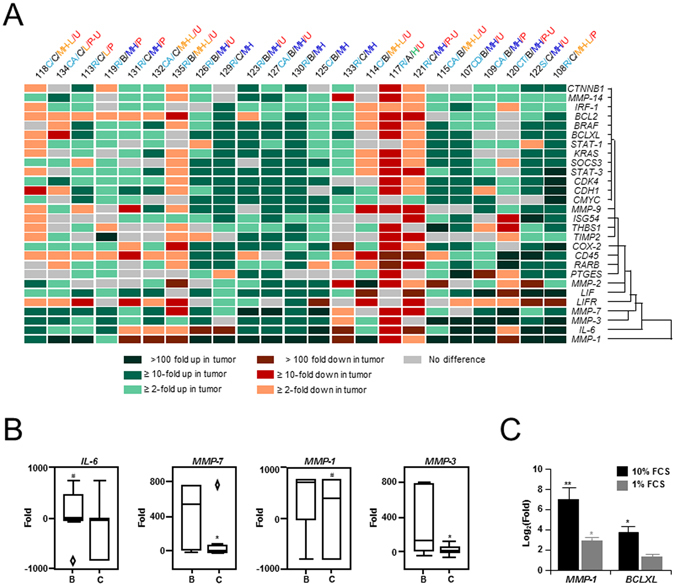
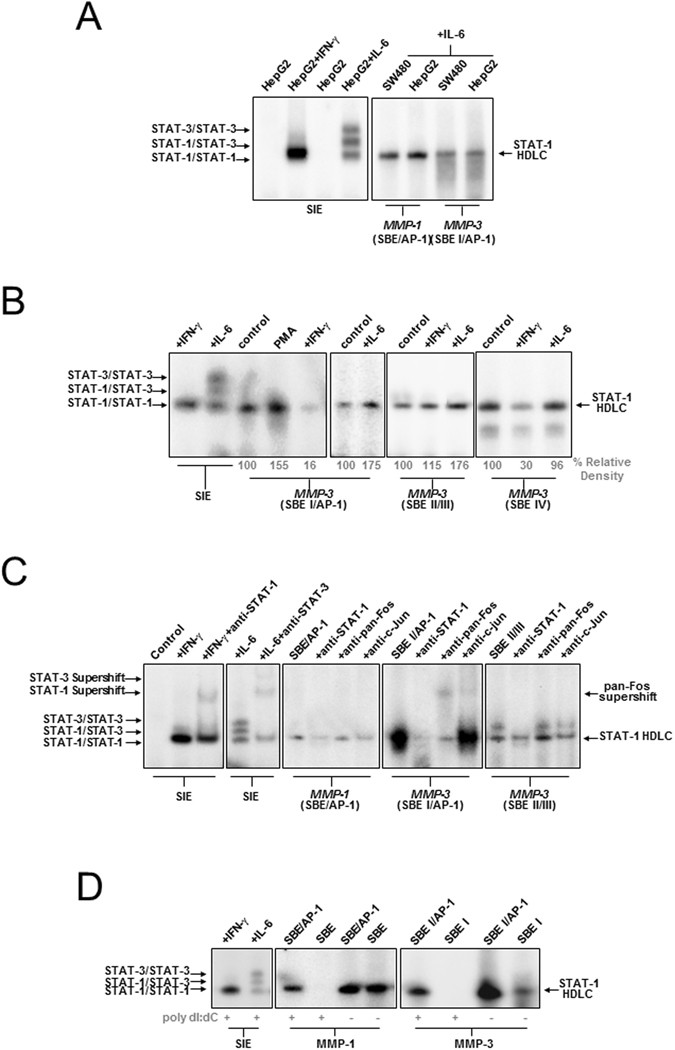
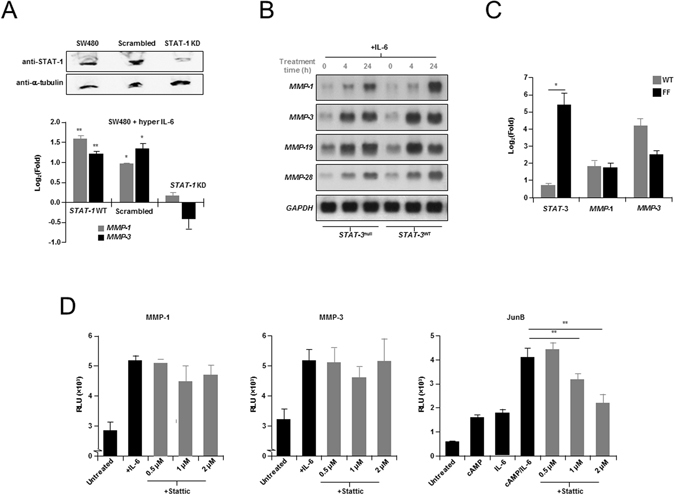
Dynamic remodelling of the extracellular matrix (ECM) is a key feature of cancer progression. Enzymes that modify the ECM, such as matrix metalloproteinases (MMPs), have long been recognised as important targets of anticancer therapy. Inflammatory cytokines are known to play a key role in regulating protease expression in cancer. Here we describe the identification of gamma-activated site (GAS)-like, signal transducer and activator of transcription (STAT) binding elements (SBEs) within the proximal promoters of the MMP-1 and MMP-3 genes, which in association with AP-1 components (c-Fos or Jun), bind STAT-1 in a homodimer like complex (HDLC). We further demonstrate that MMP expression and binding of this complex to SBEs can either be enhanced by interleukin (IL)-6, or reduced by interferon gamma (IFN-γ), and that IL-6 regulation of MMPs is not STAT-3 dependent. Collectively, this data adds to existing understanding of the mechanism underlying cytokine regulation of MMP expression via STAT-1, and increases our understanding of the links between inflammation and malignancy in colon cancer.


Conflict of interest statement

The authors declare that they have no competing interests.

Figures

Figure 1
Figure 1
Comparative expression analysis. (A) Heat map showing relative fold differences in gene expression between tumor-tissue and patient matched normal mucosa. Clustering was based on nearest neighbor hierarchy analysis. Where expression was below the level of sensitivity for detection in either the normal mucosa or tumor, values were assigned numerically reflecting the upper and lower bounds of the data set (no expression in control, 800; no expression in tumor, −800). Data was analyzed by Spearman’s ρ correlation analysis (α = 0.05). Abbreviations for anatomical location: Cecum [C]; Colon Ascending [CA]; Colon Transverse [CT]; Colon Descending [CD]; and Sigmoid Colon [S]; for Dukes’ staging [B & C]; for differentiation: Low [L]; Medium High to Low [MH-L]; Medium High [MH]; and High [H]; for ulceration: Ulcerous [U]; Polypous [P]; Mixed Polypous-Ulcerous [P-U]. (B) Results of Q-PCR analysis showing differences in mRNA levels for MMP-1MMP-3MMP-7 and IL-6 between Dukes’ B and Dukes’ C tumors. Data is represented as box plots with median (thick line), first and third quartiles (boxed), upper and lower values (whiskers) and outliers (◊), and was analyzed by Mann Whitney U (α = 0.05, *P < 0.05). (C) Results of Q-PCR analysis following IL-6 treatment of SW480 colorectal cancer cells, showing significant up-regulation of MMP-1 mRNA. Notably, induction was enhanced under high (10%) serum conditions (Left), compared with low serum (1%) (Right). Similar results were obtained in other cell lines, including LS174T (not shown). Also shown, the effects of IL-6 on the known IL-6 target gene, BCLXL. Similar results were obtained for BCL-2 and STAT-3 (not shown). Each experiment was repeated showing similar results, and data represented as mean Log2(Fold) ± SEM, and was analyzed by Independent t test (α = 0.05, **P < 0.01).
Figure 2
Figure 2
Reporter analysis of human MMP SBEs. (A) Schematic representation of the SBE/AP-1 region from the MMP-1 promoter inserted into the pGL3-basic luciferase reporter vector (Left). Also shown, results of reporter activity in SW480 cells, transfected with the MMP-1 promoter (549 bp) reporter following treatment with either Interleukin (IL)-6 alone, or IL-6 plus phorbol myristyl acetate (PMA); as well as results of reporter activation in cytokine responsive liver cancer (HepG2) cells, treated with IL-6 alone or IL-6 plus PMA (5 mM). Data is represented as mean relative luminescence Units (RLU) ±SEM. (B) Left, Schematic of human MMP-3 promoter constructs used for dual reporter analysis, including the positions of SBEs and AP-1 binding elements. ‘*’Indicates mutations created in the SBEI and SBEII sites. Right, IL-6 induced promoter activity in HepG2 cells for each construct. Data is represented as mean fold induction ± SEM. (C) SW480 and HepG2 cells transfected with the proximal MMP-3 promoter were treated with: (i) IL-6 and soluble IL-6 receptor (IL-6R) (both 10 ng/ml, 18 h); (ii) IFN-γ (1000 U/ml, 18 h) alone; or (iii) with IFN-γ, 2 h before adding IL-6 and sIL-6R. Data is represented as mean RLU ± SEM. (D) Luciferase activity in HepG2 cells produced from the full length 607 bp proximal region (Left), and the shortest SBE I/II/AP-1 (Right) MMP-3 gene promoter construct. Shown, the cumulative effect of PMA (5 nM) plus IL-6 (10 ng/ml), versus IL-6 alone. Data is represented as mean RLU ± SEM. For (AD), experiments were repeated showing similar results and data was analyzed by Independent t test (α = 0.05; *P < 0.05, **P < 0.01).
Figure 3
Figure 3
Identification of a HDLC binding non-canonical SBEs in MMP-1 and MMP-3 promoters. (A) Extracts from SW480 or HepG2 cells treated with IL-6 (50 ng/ml, 5 min) or IFN-γ (1000 U/ml, 1 h) were probed with the sis-inducible element (SIE) oligonucleotide. Arrows indicate the STAT-3 homodimer, the STAT-1/STAT-3 heterodimer and the STAT-1 homodimer. Also shown is binding of a novel STAT-1 HDLC constitutively to the MMP-1 SBE/AP-1 and MMP-3 SBE I/AP-1 probes. (B) EMSA showing a similar STAT-1 HDLC constitutively binding to the MMP-3 SBE II/III and MMP-3 SBE IV probes using extracts from HepG2 cells treated with PMA (100 nM, 90 min), IL-6 (50 ng/ml, 5 min) and IFN-γ (1000 U/ml, 60 min). (C) EMSA in the presence of anti-STAT-1, anti-pan-Fos and anti-c-Jun antibodies, respectively, as indicated. (D) EMSA of MMP1 (SBE) and (SBE/AP-1), MMP-3 (SBEI) and (SBE I/AP-1) probes using HepG2 cell extracts in the presence and absence of 1 μg poly-dI:dC showing dependence of STAT-1 HDLC binding on the AP-1 site. For (A–D), experiments were repeated showing similar results.
Figure 4
Figure 4
STAT-1 is required for maximal IL-6 induction of MMPs. (A) Analysis of IL-6-induced MMP gene expression in STAT-1 knockdown (KD) human colon cancer cells. Upper, Western blot analysis of SW480 STAT-1 KD cells compared with controls, and probed with anti-STAT-1 and anti-α-tubulin antibodies. Lower, Wild-type SW480 and SW480 STAT-1 short hairpin shRNA KD cells treated with hyper-IL-6 (20 ng/ml, 18 h) a fusion protein comprising IL-6 and the soluble IL-6 receptor α chain, under conditions of low serum (1.5%). STAT-1 KD has a significantly negative effect on IL-6 induction of MMP-1 and MMP-3. Data is represented as mean Log2(Fold) ± S.E.M., for the difference in mRNA levels between treated and untreated cells (ΔCTuntreated−ΔCTtreated), analyzed by independent t test (α = 0.05; **P < 0.01, *P < 0.02).’ (B) Northern Blot analyses of human MMP gene expression in response to IL-6 in the DLD1 derived STAT-3 null A4 colon cancer cell line versus STAT-3 reconstituted A4 cells. Human colon cancer cells were treated with IL-6 (200 ng/ml), and soluble IL-6R (250 ng/ml) for up to 24 h. Shown, parallel induction of MMP mRNA in response to IL-6, in both A4 cells reconstituted with STAT-3 and STAT-3 null A4 cells. (C) No enhanced induction of MMP-1, or MMP-3 mRNA levels was observed in STAT hyper-activated gp130Y757F/Y757F (FF) animals following injection of IL-6 (after 90 min), compared with wild-type control animals (n = 5). Also shown, up-regulation of STAT-3 mRNA, as well as decreased levels of MMP-3 mRNA following IL-6 treatment in FF animals compared with controls. Data represented as Log2(Fold) ± S.E.M. and analyzed by independent t test (α = 0.05, *P < 0.05). (D) Results of dual-luciferase reporter analysis showing no significant effect on IL-6 (50 ng/ml) and cpt-cAMP (300 μM) induction of MMP-1 and MMP-3 full-length promoter constructs pre-treated (1 h) with the STAT-3 inhibitor, Stattic®, compared with c-Jun control construct. Constructs were transduced into HepG2 cells and treatment conducted in the presence of 1% serum. Data is represented as mean relative luminescence units (RLU) ± SEM. and analyzed by independent t test (α = 0.05, **P < 0.01). For (AD), experiments were repeated showing similar results.
Figure 5
Figure 5
Proposed model for the regulation of MMPs by IL-6/PMA and IFN-γ. Fos/Jun and non-phosphorylated STAT-1 bind constitutively to AP-1 and SBEs elements in the MMP-1 and MMP-3 proximal promoters, maintaining a basal level of gene expression (A). In the presence of IL-6 or PMA, MMP expression is enhanced (green arrow) (B). In response to IFN-γ, STAT-1 is phosphorylated, increasing its affinity for binding to GAS elements in the promoters of IFN-γ responsive genes, displacing STAT-1 from the HDLCs in the MMP gene promoters, resulting in a reduction in expression of these genes (C).

References

    1. Gao D, et al. Endothelial progenitor cells control the angiogenic switch in mouse lung metastasis. Science. 2008;319:195–198. doi: 10.1126/science.1150224. - DOI - PubMed
    1. Sax MJ, et al. Cancer cell CCL5 mediates bone marrow independent angiogenesis in breast cancer. Oncotarget. 2016;7:85347–49. - PMC - PubMed
    1. Zeisberg M, Kalluri R. Cellular mechanisms of tissue fibrosis. 1. Common and organ-specific mechanisms associated with tissue fibrosis. Am J Physiol Cell Physiol. 2013;304:C216–25. doi: 10.1152/ajpcell.00328.2012. - DOI - PMC - PubMed
    1. Quail DF, Joyce JA. Microenvironmental regulation of tumor progression and metastasis. Nat Med. 2013;19:1423–37. doi: 10.1038/nm.3394. - DOI - PMC - PubMed
    1. Ricciardi M, et al. Epithelial-to-mesenchymal transition (EMT) induced by inflammatory priming elicits mesenchymal stromal cell-like immune-modulatory properties in cancer cells. Br J Cancer. 2015;112:1067–75. doi: 10.1038/bjc.2015.29. - DOI - PMC - PubMed

Publication types

MeSH terms