Review
. 2017 Aug;9(4):345-352.
doi: 10.1007/s12551-017-0287-1. Epub 2017 Aug 17.

Dynamic imaging of mitochondrial membrane proteins in specific sub-organelle membrane locations

Affiliations
Review

Dynamic imaging of mitochondrial membrane proteins in specific sub-organelle membrane locations

Timo Appelhans et al. Biophys Rev. 2017 Aug.

Abstract

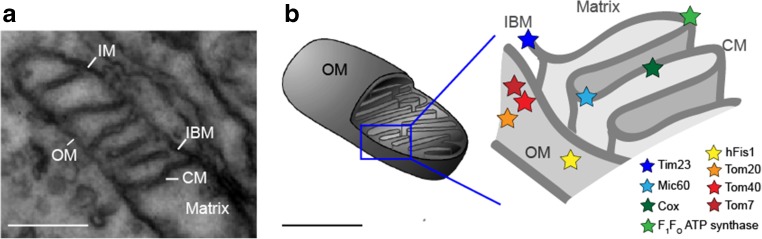
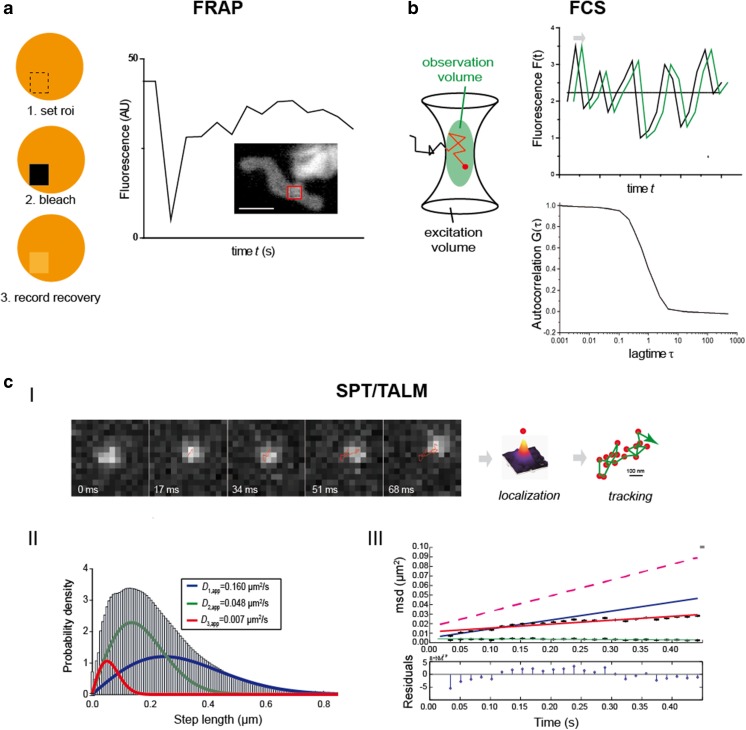
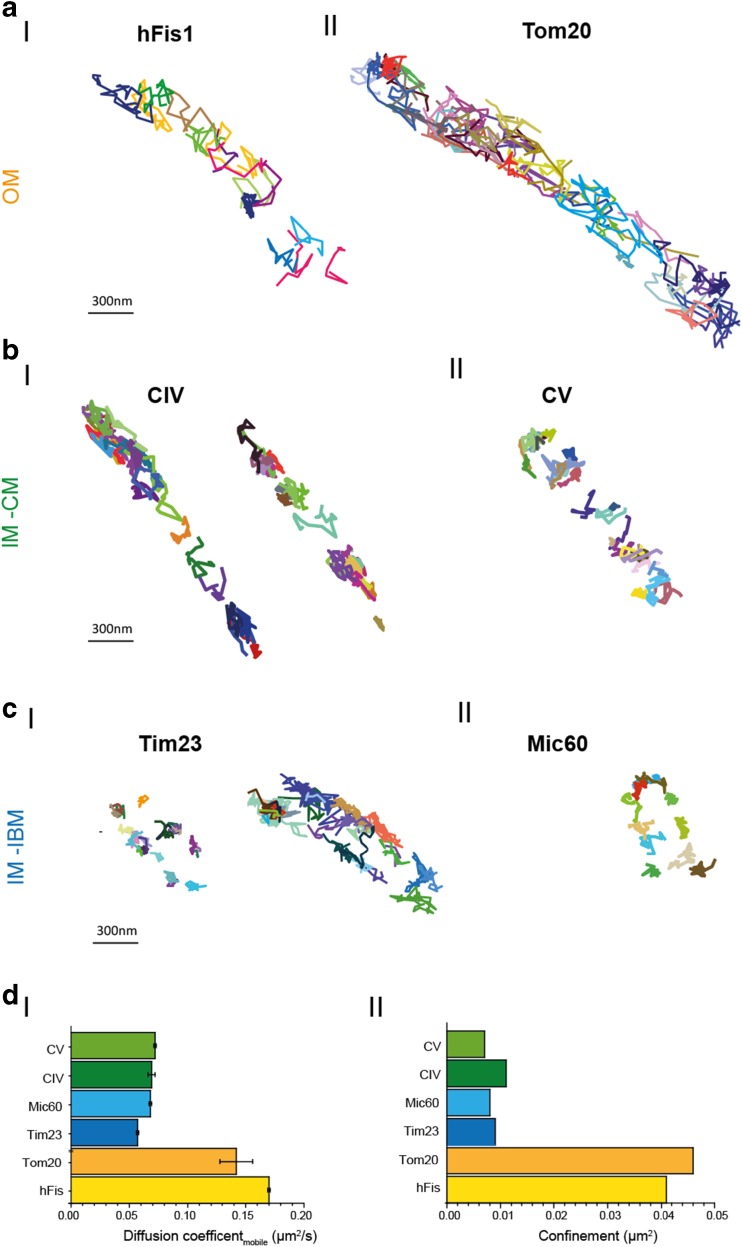
Mitochondria are cellular organelles with multifaceted tasks and thus composed of different sub-compartments. The inner mitochondrial membrane especially has a complex nano-architecture with cristae protruding into the matrix. Related to their function, the localization of mitochondrial membrane proteins is more or less restricted to specific sub-compartments. In contrast, it can be assumed that membrane proteins per se diffuse unimpeded through continuous membranes. Fluorescence recovery after photobleaching is a versatile technology used in mobility analyses to determine the mobile fraction of proteins, but it cannot provide data on subpopulations or on confined diffusion behavior. Fluorescence correlation spectroscopy is used to analyze single molecule diffusion, but no trajectory maps are obtained. Single particle tracking (SPT) technologies in live cells, such as tracking and localization microscopy (TALM), do provide nanotopic localization and mobility maps of mitochondrial proteins in situ. Molecules can be localized with a precision of between 10 and 20 nm, and single trajectories can be recorded and analyzed; this is sufficient to reveal significant differences in the spatio-temporal behavior of diverse mitochondrial proteins. Here, we compare diffusion coefficients obtained by these different technologies and discuss trajectory maps of diverse mitochondrial membrane proteins obtained by SPT/TALM. We show that membrane proteins in the outer membrane generally display unhindered diffusion, while the mobility of inner membrane proteins is restricted by the inner membrane architecture, resulting in significantly lower diffusion coefficients. Moreover, tracking analysis could discern proteins in the inner boundary membrane from proteins preferentially diffusing in cristae membranes, two sub-compartments of the inner mitochondrial membrane. Thus, by evaluating trajectory maps it is possible to assign proteins to different sub-compartments of the same membrane.

Keywords: Cox; F1FO ATP synthase; FCS; FRAP; Membrane sub-compartments; Mitochondrial membrane proteins; Mitofilin/Mic60; Mobility analyses; SPT technologies; Single molecule localization and diffusion; TIM; TOM; hFis.


Conflict of interest statement

Conflict of interest

Timo Appelhans declares that he has no conflicts of interest. Karin B. Busch declares that she has no conflicts of interest.

Ethical approval

This article does not contain any studies with human participants or animals performed by any of the authors.

Figures

Fig. 1
Fig. 1
Ultrastructure of mitochondria and respective localization of important proteins. a Electron microscopy image showing part of a mitochondrion, with the membranes appearing black: OM outer membrane, IM inner membrane [which is partitioned into the inner boundary membrane (IBM) and the cristae membranes (CM)]. The matrix is an aqueous compartment. b Scheme showing the localization of the proteins that have been studied in terms of mobility and localization. Tom40 Core subunit of the translocase of the outer membrane (TOM) complex, Tom20 receptor subunit of TOM, Tom7 subunit of TOM (Shiota et al. 2015), hFis human fission factor in the OM (Yu et al. 2005), Mic60 mitofilin, part of the MICOS complex in the IBM (Ding et al. 2015), Tim23 part of the inner membrane translocase (TIM) in the IBM (Demishtein-Zohary and Azem 2017), Cox cytochrome c oxidase, a complex of the oxidative phosphorylation (OXPHOS) system in the CM, F 1 F O ATP synthase, a further OXPHOS complex
Fig. 2
Fig. 2
Technological methods to determine the mobility of mitochondrial proteins. a Fluorescence recovery after photobleaching (FRAP). Usually, proteins of interest are fused to a fluorescent protein and from a certain region of interest (roi) the pre-bleach fluorescence is recorded. Then, the fluorescence in the roi is bleached down and immediately after the recovery of fluorescence is monitored. The recovery curve is fitted and the percentage of mobile and immobile molecules and the diffusion coefficient of the mobile fraction can be determined. Here, a FRAP curve for Tom7, a subunit of the TOM complex, fused to green fluorescent protein is shown. The fluorescence was bleached in the indicated roi (red frame) (Sukhorukov et al. 2010). b Fluorescence correlation spectroscopy (FCS) reveals protein diffusion, such as in the mitochondrial matrix (Koopman et al. 2007). Fluorescence intensity fluctuations from the confocal volume are recorded and an autocorrelation function is generated from which the mean diffusion constant can be calculated. c-I Localization and tracking of single molecules in different mitochondrial compartments by tracking and localization microscopy (TALM) (Appelhans et al. 2012), a single particle tracking (SPT) technique. A single molecule is observed for multiple frames until bleached. The fine localization of single molecules is obtained by two-dimensional Gaussian fitting of the diffracted signal in a deflation process, following which a trajectory map is generated using a multi-target tracing algorithm (Sergé et al. 2008). c-II Step length diagrams are generated, and from the cumulated distribution function (CDF) diffusion coefficients are extracted by fitting until the least root mean square error is minimized. Usually, several subpopulations characterized by different mobilities (mobile, less mobile and confined mobile) are obtained. c-III Mean square displacement (msd) plots are analyzed to obtain the confinement for short (2-5 steps, blue line) and long-range diffusion (2–20 steps, red line) (Schütz et al. 1997). The relation between msd and the diffusion coefficient D is: msd = 4tα + 4ε2 where ε2 is the square error (localization precision) and α is the non-linearity coefficient. Scale bar 100 nm (a)
Fig. 3
Fig. 3
Motility analysis of mitochondrial membrane proteins by SPT/TALM. a Trajectory maps of OM proteins hFis (a-I) and Tom20 (a-II). b-I Trajectory maps of Tim32 preferentially found in the IBM. b-II Map of Mic60, which is part of the MICOS complex, at cristae junctions (Zerbes et al. 2012). c-I Trajectory maps of Cox labeled at its subunit CoxVIIIa in two mitochondria. c-II Trajectory map of F1FO ATP synthase labeled at subunit ɣ. For fluorescence labeling of these different protein species, C-terminal HaloTag®-fusion (Los et al. 2008) proteins were generated and posttranslationally labeled by membrane-permeable tetramethylrhodamine functionalized with the HaloTag®-Ligand (TMRHTL). TMRHTL in the specific mitochondrial environment turned out to be a photostable and bright emitter (Appelhans et al. 2012). The labeling was done with substoichiometric concentrations of TMRHTL (0.5–1 nM) to obtain single molecule signals that can be distinguished and localized. The dye was excited with a diode pumped solid-state laser (excitation 561 nm, 200 mW; Cobolt Jive 561 nm, Cobolt), and single molecule signals were recorded with a back-illuminated electron multiplying charged coupled device EMCCD camera (model iXON 897, pixel size 16 μm2; Andor Technology Ltd., Belfast, UK). The mitochondrial localization of the constructs was tested by co-staining with MitoTracker®DeepRed (not shown). The signal of a single particle was recorded over time until bleaching and analysed by the multi-target tracer algorithm (Sergé et al. 2008), generating a trajectory of the respective molecule. The magnification is the same for all trajectory maps. d-I Apparent diffusion coefficients D app for mobile fraction of OM and IM proteins. d-II Confinement for OM and IM proteins

References

    1. Appelhans T, Busch K. Single molecule tracking and localization of mitochondrial protein complexes in live cells. Methods Mol Biol. 2017;1567:273–291. doi: 10.1007/978-1-4939-6824-4_17. - DOI - PubMed
    1. Appelhans T, Richter C, Wilkens V, et al. Nanoscale organization of mitochondrial microcompartments revealed by combining tracking and localization microscopy. Nano Lett. 2012;12:610–616. doi: 10.1021/nl203343a. - DOI - PubMed
    1. Bacia K, Kim SA, Schwille P. Fluorescence cross-correlation spectroscopy in living cells. Nat Methods. 2006;3:83–89. doi: 10.1038/nmeth822. - DOI - PubMed
    1. Beinlich F, Drees C, Piehler J, Busch K. Shuttling of PINK1 between mitochondrial microcompartments resolved by triple-color Superresolution microscopy. ACS Chem Biol. 2015;10:1970–1976. doi: 10.1021/acschembio.5b00295. - DOI - PubMed
    1. Demishtein-Zohary K, Azem A. The TIM23 mitochondrial protein import complex: function and dysfunction. Cell Tissue Res. 2017;367:33–41. doi: 10.1007/s00441-016-2486-7. - DOI - PubMed

Grants and funding

LinkOut - more resources