. 2017 Aug 1;58(10):4078-4088.
doi: 10.1167/iovs.17-22242.

Oxidative Stress-Related Molecular Biomarker Candidates for Glaucoma

Affiliations

Oxidative Stress-Related Molecular Biomarker Candidates for Glaucoma

Gözde Hondur et al. Invest Ophthalmol Vis Sci. .

Abstract

Purpose: Glaucoma-related molecular biomarkers can improve clinical testing to diagnose the disease early, predict its prognosis, and monitor treatment responses. Based on the evidence of increased oxidative stress in glaucomatous tissues, this study analyzed oxidative stress-related biomarker candidates in blood and aqueous humor samples with or without glaucoma.

Methods: The blood and aqueous humor samples collected from carefully selected groups of 96 patients with glaucoma and 64 healthy subjects without glaucoma were included in the study. The samples were analyzed for protein carbonyls and advanced glycation end products (AGEs) through ELISA-based quantification assays. To allow proper comparisons, the Goldmann-Witmer coefficient that reflects the ratio of aqueous humor to blood values corrected to total protein concentration in individual samples was calculated.

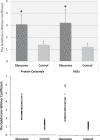
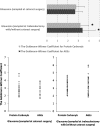
Results: Blood and aqueous humor levels of protein carbonyls and AGEs were found significantly higher in glaucomatous samples compared with age-matched nonglaucomatous controls (P < 0.001). The glaucoma-related increase in protein carbonyls and AGEs was more prominent in aqueous humor samples than blood samples (2.6-fold versus 1.9-fold for protein carbonyls, and 3.1-fold versus 1.9-fold for AGEs; P < 0.001). Comparison of the Goldmann-Witmer coefficients indicated greater values for protein carbonyls (1.37 ± 0.3 vs. 3.07 ± 0.8) and AGEs (1.2 ± 0.3 vs. 3.2 ± 1.1) in the glaucoma group (P < 0.001).

Conclusions: Findings of this study encourage further validation studies of oxidative stress-related biomarkers in glaucoma. Analysis of protein carbonyls and AGEs in longitudinal studies of larger and heterogeneous patient cohorts should better assess the value of these promising candidates as molecular biomarkers of glaucoma for clinical predictions.


Figures

Figure 1
Figure 1
Oxidative stress–related biomarker candidates in glaucoma. Protein carbonyls (top) and AGEs (bottom) were analyzed in samples of the blood serum and aqueous humor collected from patients with glaucoma (n = 96) and age-matched nonglaucomatous controls (n = 64) by specific ELISAs. Data are presented as mean ± SD in bar graphs and univariate scatterplots present data distribution. Compared with controls, glaucomatous samples exhibited significantly higher titers of these oxidative stress–related biomarker candidates (*Statistical significance; the Kruskal-Wallis 1-way ANOVA on ranks, P < 0.001).
Figure 2
Figure 2
Oxidative stress–related biomarker candidates in glaucoma. Based on the data presented in Figure 1, the glaucoma-related increase in ELISA titers of protein carbonyls and AGEs was more prominent in aqueous humor samples than blood serum.
Figure 3
Figure 3
Oxidative stress–related biomarker candidates in glaucoma. To allow proper comparison of blood and aqueous humor levels of protein carbonyls and AGEs between study groups, the GWC was calculated for each sample, which is defined as GWC = X/Y, where X is the aqueous humor concentration divided by the total protein concentration in aqueous humor, and Y is the blood serum concentration divided by the total protein concentration in blood serum. Data are presented as mean ± SD in bar graphs and univariate scatterplots present data distribution. Group comparison of the GWCs indicated significantly higher values in the glaucoma group than controls (*Statistical significance; the Kruskal-Wallis 1-way ANOVA on ranks, P < 0.001).
Figure 4
Figure 4
Relationship between the blood and aqueous humor levels of oxidative stress–related biomarker candidates in glaucoma. Scatterplots show blood serum and aqueous humor levels of protein carbonyls, and AGEs in glaucomatous samples. No significant relationship was detected between the blood and aqueous humor levels of protein carbonyls in the glaucoma group (linear regression analysis, R = 0.07, P > 0.05). However, blood and aqueous humor levels of AGEs exhibited a positive correlation among glaucoma patients (linear regression analysis, R = 0.28, P = 0.02).
Figure 5
Figure 5
Oxidative stress–related biomarker candidates in glaucoma. The GWCs for protein carbonyls and AGEs were significantly higher in samples collected from glaucoma patients who underwent trabeculectomy (alone or combined with cataract surgery, n = 66) compared with glaucoma patients who underwent only cataract surgery (n = 30). Data are presented as mean ± SD in bar graphs, and univariate scatterplots present data distribution. *Statistical significance; the Kruskal-Wallis 1-way ANOVA on ranks, P = 0.015 and P = 0.03 for protein carbonyls and AGEs, respectively.
Figure 6
Figure 6
Working scheme toward protein/peptide biomarkers of glaucoma. The clinical validation phase after discovery of biomarker candidates aims to eliminate false positivity and calculate the biomarker sensitivity and specificity through the targeted analysis of candidate molecules in large and heterogeneous populations. This challenging process requires the collaborative efforts of basic scientists, physicians, and funding organizations. Due to etiologic complexity of glaucoma and significant variability among patients, instead of a single molecule, a panel of biomarkers including those derived from different approaches, such as analysis of blood samples for targeted molecules, analysis of oxidative stress–related biomarkers, analysis of isolated IgGs and T cells (perhaps also including the genetic/epigenetic markers), should provide integrating and complementary information for clinical predictions.

References

    1. De Moraes CG, Liebmann JM, Levin LA. . Detection and measurement of clinically meaningful visual field progression in clinical trials for glaucoma. Prog Retin Eye Res. 2017; 56: 107– 147. - PMC - PubMed
    1. Tezel G, Thornton IL, Tong MG,et al. . Immunoproteomic analysis of potential serum biomarker candidates in human glaucoma. Invest Ophthalmol Vis Sci. 2012; 53: 8222– 8231. - PMC - PubMed
    1. Tezel G. . A proteomics view of the molecular mechanisms and biomarkers of glaucomatous neurodegeneration. Prog Retin Eye Res. 2013; 35: 18– 43. - PMC - PubMed
    1. Tezel G. . A decade of proteomics studies of glaucomatous neurodegeneration. Invest Ophthalmol Vis Sci. 2014; 8: 154– 167. - PMC - PubMed
    1. Tezel G, Yang X, Cai J. . Proteomic identification of oxidatively modified retinal proteins in a chronic pressure-induced rat model of glaucoma. Invest Ophthalmol Vis Sci. 2005; 46: 3177– 3187. - PMC - PubMed

Substances

LinkOut - more resources