. 2017 Aug 17;67(4):711-723.e7.
doi: 10.1016/j.molcel.2017.07.019.

Systematic Identification of MCU Modulators by Orthogonal Interspecies Chemical Screening

Affiliations

Systematic Identification of MCU Modulators by Orthogonal Interspecies Chemical Screening

Daniela M Arduino et al. Mol Cell. .

Abstract

The mitochondrial calcium uniporter complex is essential for calcium (Ca2+) uptake into mitochondria of all mammalian tissues, where it regulates bioenergetics, cell death, and Ca2+ signal transduction. Despite its involvement in several human diseases, we currently lack pharmacological agents for targeting uniporter activity. Here we introduce a high-throughput assay that selects for human MCU-specific small-molecule modulators in primary drug screens. Using isolated yeast mitochondria, reconstituted with human MCU, its essential regulator EMRE, and aequorin, and exploiting a D-lactate- and mannitol/sucrose-based bioenergetic shunt that greatly minimizes false-positive hits, we identify mitoxantrone out of more than 600 clinically approved drugs as a direct selective inhibitor of human MCU. We validate mitoxantrone in orthogonal mammalian cell-based assays, demonstrating that our screening approach is an effective and robust tool for MCU-specific drug discovery and, more generally, for the identification of compounds that target mitochondrial functions.

Keywords: MCU; bioenergetics; calcium; calcium signaling; drug discovery; drug screening; high-throughput screening; mitochondria; mitochondrial calcium uniporter.


Figures

Figure 1
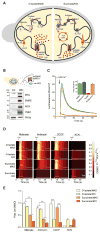
Figure 1. A Yeast Bioenergetic Shunt to Reduce False-Positive Hits in MCU-Targeted Drug Discovery Screens
(A) Schematic representation of yeast mitochondrial energy production pathways in media with either mannitol/sucrose (MAS) and D-lactate or KCl and succinate. II, succinate dehydrogenase; III, coenzyme Q:cytochrome c-oxidoreductase; Q, coenzyme Q; DLD, D-lactate:cytochrome c oxidore-ductase; Cytc, cytochrome c; IV, cytochrome c oxidase. (B) Immunoblot analysis of cytoplasmic (Cyt) and mitochondrial (Mito) fractions isolated from yeast cells expressing human MCU, EMRE, and mt-AEQ. YME1, mitochondrial i-AAA protease; PKGa, protein kinase G alpha. (C) Representative traces of Ca2+-dependent, AEQ-based light kinetics in yeast mitochondria treated with either 0.1% DMSO or 10 μM Ru360 in the presence or absence of 15 μM ETH129 (ETH). RLU, relative luminescence units. Mean ± SEM; n = 4. (D) Effect of respiratory chain inhibitors (malonate, 10 mM; antimycin A, 1 μM; and KCN, 6 mM) and CCCP (6 μM) on Ca2+ uptake kinetics in yeast mitochondria energized with either succinate or D-lactate (10 mM) in MAS or KCl-based media. Averaged light kinetics (n = 3, brown) are quantified as ratio of light signal (Ldrug) over maximal peak luminescence (Lmaxdrug), normalized to DMSO (0.1%). (E) Quantification of Ca2+-dependent, AEQ-based light kinetics shown in (D). Mean ± SEM; n = 3; ***p < 0.001, one-way ANOVA.
Figure 2
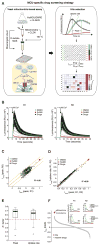
Figure 2. Drug Discovery Screen in Reconstituted Yeast Mito-chondria
(A) General workflow of the yeast mitochondria-based drug discovery screen. CLZN, native coelenterazine; Idrug, inhibition score. (B) Drug screen in biological replicates (R1 and R2). Ca2+-dependent, AEQ-based light kinetics from reconstituted yeast mitochondria are shown for each compound, whereas averaged light kinetics are shown for positive (Ru360, n = 160) and negative (DMSO, n = 160) controls. (C) Reproducibility of the drug screen. Linear regression (solid orange line) is fitted to the inhibition score (Idrug) of each compound (dot). Idrug scores that deviate from the linear regression (gray dots) by two root mean square errors (dotted orange lines) are considered outliers. The correlation coefficient (R2) refers to data points upon the removal of outliers. (D) Correlation of Idrug scores for peak and uptake rate. (E) Performance of the screen based on Z′-factors. Highest and lowest values indicate third and first quartiles, while the thick line represents the median. Z′-factors that do not replicate between biological duplicates are shown as small circles. Median values > 0.5 indicate screening assays suitable for HTS. (F) Ranking of compounds based on Idrug scores.
Figure 3
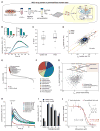
Figure 3. Orthogonal Drug Screens in Permeabilized HeLa Cells and Reconstituted Yeast Mitochondria Validate Mitoxantrone as a Specific MCU Inhibitor
(A) General workflow of the permeabilized HeLa cell-based assay. CLZ n, coelenterazine derivative n; EC, extracellular-like solution; Tg, thapsigargin; Dig, digitonin; PM, plasma membrane; PMCCs, plasma membrane Ca2+ channels; SERCA, sarco/endoplasmic reticulum Ca2+-ATPase; IP3R, inositol trisphosphate receptor. See also Figures S1A–S1C. (B) Ca2+-dependent, AEQ-based light kinetics in digitonin-permeabilized HeLa cells upon the addition of Ca2+ in the presence and absence of Ru360 (5 μM), CGP-37157 (20 μM), or DMSO (0.2%). Mean ± SEM; n = 8. See also Figures S1D and S1E. (C) Performance of the drug screen based on Z′-factors. (D) Reproducibility of the drug screen. (E) Ranking of compounds based on Idrug scores. (F) Distribution of candidate drugs in therapeutic classes. (G) Validation of true-positive hits by orthogonal, inter-species screens. ETCIs, electron transport chain inhibitors. See also Figure S2. (H) Ca2+-dependent, AEQ-based light kinetics in yeast mitochondria treated with amiodarone. Mean ± SEM; n = 3. (I) Effect of amiodarone on Ca2+-dependent, AEQ-based light kinetics in yeast mitochondria pre-treated with either Ru360 or DMSO. Mean ± SEM; n = 3. (J) Dose response of mitoxantrone on Ca2+ uptake relative to DMSO and fitted with a Hill equation (continuous lines) to extract Michaelis constant (k0.5) and Hill coefficient (nH). Inset: mitoxantrone hydrochloride chemical structure. Mean ± SEM; n = 4. See also Figure S3.
Figure 4
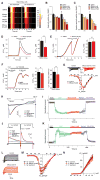
Figure 4. MCU-Mediated Ca2+ Currents and Mitochondrial Bioenergetics in Response to Mitoxantrone
(A) Representative recordings of MCU current densities (I/Cm) in HEK293T cell mitoplasts in various bath [Ca2+]. (B) Representative time course of MCU current during exposure to and washout of 10 μM mitoxantrone in bath solution. Each point represents the amplitude of MCU current at −160 mV, sampled every 5 s. RuR, ruthenium red (200 nM). (C) Quantification of MCU Ca2+ current density (pA/pF) in 1 mM bath Ca2+ before (n = 5) and after (n = 4) the addition of 10 μM mitoxantrone. Mean ± SEM. (D) Quantification of time constant for inhibition (τon; n = 4) and recovery (τoff; n = 3) of MCU Ca2+ current. Mean ± SEM. (E) Oxygen consumption rate (OCR) upon acute treatment of crude mouse liver mitochondria with either mitoxantrone or CCCP and then antimycin A. Mean ± SEM; n = 3. (F) Respiratory control ratio (RCR) of crude mouse liver mitochondria energized with succinate/rotenone (10 mM; 2 μM) and treated with DMSO (n = 4), mitoxantrone (n = 5), or oligomycin A (n = 3). ADP (4 mM), AntA, Antimycin A (4 μM). Mean ± SEM. (G) Effect of mitoxantrone on maximal respiration and spare respiratory capacity of permeabilized HeLa cells. Mean ± SEM; n = 3.
Figure 5
Figure 5. Effect of Mitoxantrone on Intracellular and Plasma Membrane Ion Channels
(A) Ca2+-dependent, AEQ-based light kinetics upon stimulation of intact HeLa cells with 100 μM histamine and after treatment with either vehicle (DMSO 0.2%) or different concentrations of mitoxantrone for 1 or 2 hr. (B and C) Quantification of peak luminescence (B) and rate of light emission (uptake rate) (C) for light kinetics in (A) after normalization to number of viable cells. Mean ± SEM; *p < 0.05, **p < 0.01, and ***p < 0.001, one-way ANOVA; n = 12. See also Figure S4. (D) Representative traces and quantification of mt-Ca2+ concentrations in HeLa cells stimulated with histamine (100 μM) in response to mitoxantrone (20 μM) or DMSO (0.2%) treatment for 2 hr. Mean ± SEM; n = 4; **p < 0.01, t test. Light emission was calibrated using the constant values previously published (Montero et al., 2000). (E) Representative traces and quantification of ER-Ca2+ concentrations in HeLa cells stimulated with histamine (100 μM) in the presence of 1 mM CaCl2 and pre-treated with either 20 μM mitoxantrone (n = 4) or 0.2% DMSO (n = 3) for 2 hr. Mean ± SEM. (F) Representative traces and quantification of the amplitude and rate of released ER-Ca2+ upon stimulation of digitonin-permeabilized HeLa cells with IP3 (0.2 μM) after mitoxantrone (20 μM) or DMSO (0.2%) treatment. Mean ± SEM; n = 3. (G) Effect of mitoxantrone on voltage-activated Ca2+ currents in non-differentiated SH-SY5Y cells. Mean ± SEM; n = 3. (H) Representative traces of store-operated Ca2+currents in Xenopus oocytes treated with mitoxantrone. (I) Time course of peak inward Ca2+ currents shown in (H) at −120 mV, normalized to maximum value. Mean ± SEM; n = 3. (J) Representative traces of Ca2+-activated Cl currents in Xenopus oocytes treated with mitoxantrone. (K) Time course of normalized peak Ca2+-activated Cl currents shown in (J). Mean ± SEM; n = 3. (L) Effect of mitoxantrone on voltage-activated Na+ and K+ currents in single mouse type II taste cells. (M) I–V relations of inward Na+ currents before (control), during exposure, and washout of the drug (Mitoxa, 10 μM). Mean ± SEM; n = 3. (N) I–V relations of outward K+ currents before (control), during (Mitoxa, 10 μM), and after exposure to mitoxantrone. Mean ± SEM; n = 3.
Figure 6
Figure 6. Structure-Activity Relationship Analysis of Mitoxantrone
Dose-response curves for anthracyclines (top) and structural analogs of mitoxantrone (bottom) in yeast mitochondria. The mt-Ca2+ uptake rates (μM.s−1) relative to DMSO are fitted with a Hill equation (continuous lines) to extract the Michaelis constant (k0.5). The quinizarin core is highlighted in blue. Mean ± SEM; n = 4. See also Figures S5 and S6.
Figure 7
Figure 7. Validation of Mitoxantrone-MCU Direct Interaction
(A) Representative recordings of MCU Ca2+ current densities (I/Cm) in HEK293T cell mitoplasts treated with 10 μM mitoxantrone in the pipette (matrix) solution. (B) Representative time course of MCU Ca2+ currents in the presence of mitoxantrone in the matrix and upon its addition to the bath solution. (C) Quantification of MCU current densities (pA/pF) in 1 mM bath Ca2+ after the addition of 10 μM mitoxantrone to the matrix (pipette; n = 6) and to the bath solution (n = 3). Mean ± SEM. (D) Average time constants for the inhibition (τon) of MCU current densities by the addition of mitoxantrone in the bath (n = 5) in the presence or absence of mitoxantrone in the matrix (pipette) (n = 4). (E) Flexible molecular docking analysis of C. elegans MCU pore domain and mitoxantrone. (F) Magnification of (E). (G) Prediction of molecular interactions between mitoxantrone and the MCU selectivity filter. (H–J) Dose-response curves for yeast mitochondria reconstituted with either wild-type human MCU or a D261A mutant and treated with RuR (H), mitoxantrone (I), or pixantrone (J). The mt-Ca2+ peak values (μM) relative to DMSO are fitted with a Hill equation (continuous lines) to extract the Michaelis constant (k0.5). Mean ± SEM; n = 4. See also Figure S7.

References

    1. Alonso MT, Navas-Navarro P, García-Sancho J. A microplate-based bioluminescence assay of mitochondrial calcium uptake. Methods Mol Biol. 2017;1567:245–253. - PubMed
    1. Attene-Ramos MS, Huang R, Michael S, Witt KL, Richard A, Tice RR, Simeonov A, Austin CP, Xia M. Profiling of the Tox21 chemical collection for mitochondrial function to identify compounds that acutely decrease mitochondrial membrane potential. Environ Health Perspect. 2015;123:49–56. - PMC - PubMed
    1. Baughman JM, Perocchi F, Girgis HS, Plovanich M, Belcher-Timme CA, Sancak Y, Bao XR, Strittmatter L, Goldberger O, Bogorad RL, et al. Integrative genomics identifies MCU as an essential component of the mitochondrial calcium uniporter. Nature. 2011;476:341–345. - PMC - PubMed
    1. Bell DH. Characterization of the fluorescence of the antitumor agent, mitoxantrone. Biochim Biophys Acta. 1988;949:132–137. - PubMed
    1. Bonora M, Giorgi C, Bononi A, Marchi S, Patergnani S, Rimessi A, Rizzuto R, Pinton P. Subcellular calcium measurements in mammalian cells using jellyfish photoprotein aequorin-based probes. Nat Protoc. 2013;8:2105–2118. - PubMed

MeSH terms