. 2017 Aug 18;14(1):162.
doi: 10.1186/s12974-017-0936-0.

Inflammatory demyelination alters subcortical visual circuits

Affiliations

Inflammatory demyelination alters subcortical visual circuits

Sheila Espírito Santo Araújo et al. J Neuroinflammation. .

Abstract

Background: Multiple sclerosis (MS) is an inflammatory demyelinating disease classically associated with axonal damage and loss; more recently, however, synaptic changes have been recognized as additional contributing factors. An anatomical area commonly affected in MS is the visual pathway; yet, changes other than those associated with inflammatory demyelination of the optic nerve, i.e., optic neuritis, have not been described in detail.

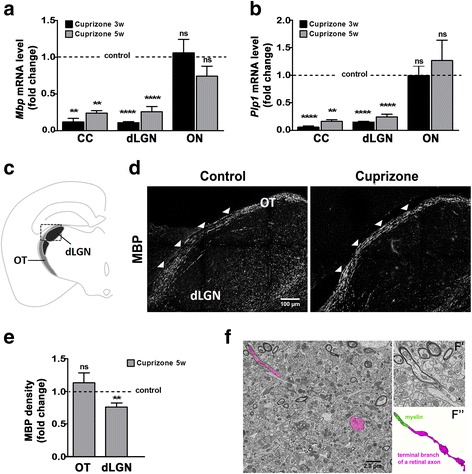
Methods: Adult mice were subjected to a diet containing cuprizone to mimic certain aspects of inflammatory demyelination as seen in MS. Demyelination and inflammation were assessed by real-time polymerase chain reaction and immunohistochemistry. Synaptic changes associated with inflammatory demyelination in the dorsal lateral geniculate nucleus (dLGN) were determined by immunohistochemistry, Western blot analysis, and electrophysiological field potential recordings.

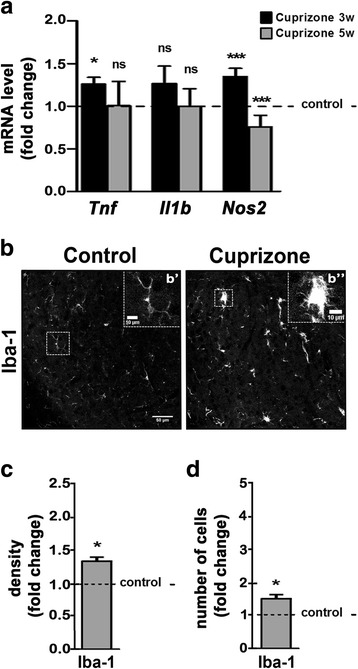
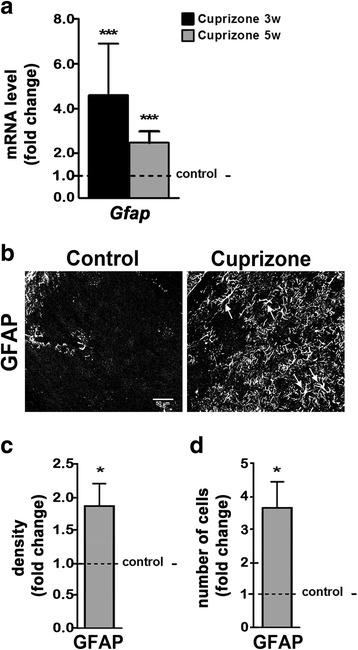
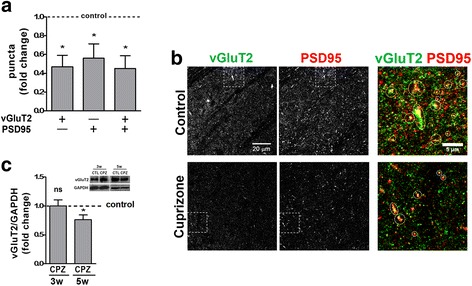
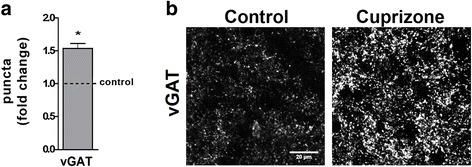
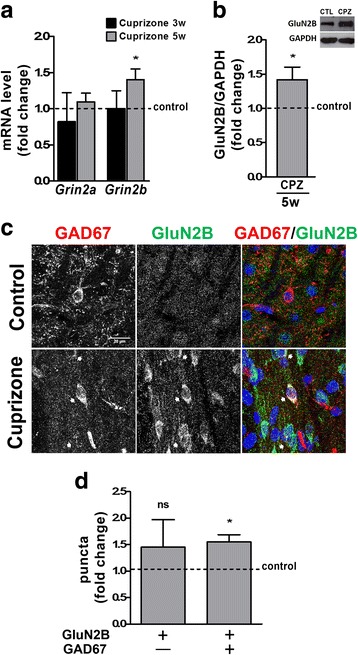
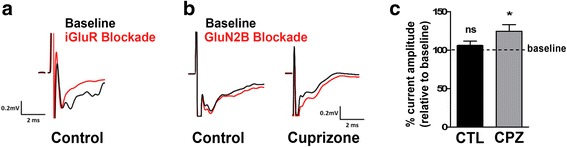
Results: In the cuprizone model, demyelination was observed in retinorecipient regions of the subcortical visual system, in particular the dLGN, where it was found accompanied by microglia activation and astrogliosis. In contrast, anterior parts of the pathway, i.e., the optic nerve and tract, appeared largely unaffected. Under the inflammatory demyelinating conditions, as seen in the dLGN of cuprizone-treated mice, there was an overall decrease in excitatory synaptic inputs from retinal ganglion cells. At the same time, the number of synaptic complexes arising from gamma-aminobutyric acid (GABA)-generating inhibitory neurons was found increased, as were the synapses that contain the N-methyl-D-aspartate receptor (NMDAR) subunit GluN2B and converge onto inhibitory neurons. These synaptic changes were functionally found associated with a shift toward an overall increase in network inhibition.

Conclusions: Using the cuprizone model of inflammatory demyelination, our data reveal a novel form of synaptic (mal)adaption in the CNS that is characterized by a shift of the excitation/inhibition balance toward inhibitory network activity associated with an increase in GABAergic inhibitory synapses and a possible increase in excitatory input onto inhibitory interneurons. In addition, our data recognize the cuprizone model as a suitable tool in which to assess the effects of inflammatory demyelination on subcortical retinorecipient regions of the visual system, such as the dLGN, in the absence of overt optic neuritis.

Keywords: Cuprizone; Demyelination; Dorsal lateral geniculate nucleus (dLGN); Glia; Inflammation; Multiple sclerosis; Synaptopathy; Visual system.


Conflict of interest statement

Ethics approval

All animal studies were approved by the Institutional Animal Care and Use Committee at the Virginia Commonwealth University. They are compliant with the Animal Welfare Act and Regulations (Animal Welfare Assurance Number: A3281-01) and the Office of Laboratory Animal Welfare Policies and Laws (OLAW). VCU’s Institutional Animal Care and Use Committee is accredited by the Association for Assessment and Accreditation of Laboratory Animal Care (AAALAC).

Consent for publication

Not applicable.

Competing interests

The authors declare that they have no competing interests.

Publisher’s Note

Springer Nature remains neutral with regard to jurisdictional claims in published maps and institutional affiliations.

Figures

Fig. 1
Fig. 1
Cuprizone treatment leads to demyelination in the corpus callosum (CC) and dorsal lateral geniculate nucleus (dLGN), but not the retinogeniculate pathway, i.e., optic nerve (ON) and optic tract (OT). a, b Bar graphs depicting mRNA levels for myelin basic protein (Mbp; A) and proteolipid protein (Plp1; B) at 3 (3w) and 5 (5w) weeks of cuprizone treatment as determined by RT-qPCR analysis. n = 3: CC control and cuprizone 3w, CC and dLGN control and cuprizone 5w; n = 4: dLGN control and cuprizone 3w; n = 7: ON control and cuprizone 5w, n = 12: ON control and cuprizone 3w. c Scheme of a coronal mouse brain section showing OT and dLGN. The square marks the area shown in D. d Representative confocal images of MBP immunostained mouse brain sections at 5 weeks of cuprizone treatment (right panel) or under control conditions (left panel). Scale bar: 100 μm. e Bar graph depicting the density of MBP immunostaining over the area of the OT and dLGN. Two fields per slice and two slices per animal (n = 3: OT and dLGN control; n = 4: OT and dLGN cuprizone) were analyzed. f SBFSEM images and 3D reconstruction of a myelinated terminal branch of a retinal ganglion cell (RGC) axon within the mouse dLGN under control conditions. An RGC axon with three presynaptic boutons is pseudocolored in magenta; the last internode of myelin ensheathing this axon is pseudocolored in green. F′ shows a high magnification, unlabeled image of this axon and myelin. F″ shows a 3D reconstruction of the terminal branch of this axon and its last myelin internode. Scale bar: 1.3 μm. All bar graphs depict means ± SEMs: *p < 0.05, **p < 0.01, ***p < 0.001, not significant (ns) p ≥ 0.05 (one-sample t test; compared to set control value = 1)
Fig. 2
Fig. 2
Cuprizone treatment leads to inflammatory responses within the dorsal lateral geniculate nucleus (dLGN). a Bar graph depicting mRNA levels for TNF-α (Tnf), IL-1-β (Il1b), and iNOS (Nos2). n = 3: Tnf, Il1b, Nos2 control and cuprizone 5w; n = 4: Nos2 control and cuprizone 3w; n = 6: Tnf control and cuprizone 3w; n = 8: Il1b control and cuprizone 3w. b Representative confocal images of the dLGN within mouse brain sections immunostained for the microglia/macrophage-specific calcium-binding protein Iba-1 at 5 weeks of cuprizone treatment (right panel) or under control conditions (left panel). The insets in b’ and b” show the areas marked by the dashed white squares. Note the higher number of surveillant microglia (discrete cell bodies with thin processes, b’ under control conditions compared to the higher number of activated microglia (enlarged cell bodies with thick processes, b” upon cuprizone treatment. Scale bars: 50 and 10 μm (insets). c, d Bar graphs depicting the density of mmunostained areas (c) and the number of immuno-positive cells (d) at 5 weeks of cuprizone treatment compared to control conditions (dotted line). Two fields per slice and two slices per animal (n = 3: control and cuprizone) were analyzed. All bar graphs depict means ± SEMs. *p < 0.05, **p < 0.01, ***p < 0.001, not significant (ns) p ≥ 0.05 (one-sample t test; compared to set control value = 1)
Fig. 3
Fig. 3
Cuprizone treatment leads to reactive gliosis within the dorsal lateral geniculate nucleus (dLGN). a Bar graph depicting mRNA levels of glial fibrillary acidic protein (Gfap) in the dLGN at 3 (3w) and 5 (5w) weeks of cuprizone treatment. n = 4: Gfap control and cuprizone 3w; n = 3: Gfap control and cuprizone 5w. b Representative confocal images of the dLGN within mouse brain sections immunostained for GFAP at 5 weeks of cuprizone treatment (right panel) or under control conditions (left panel). Note the presence of GFAP-positive astrocytes with hypertrophic morphology (arrows in the right panel). Scale bar: 50 μm. c, d Bar graphs depicting the density of immunostained areas (c) and the number of immuno-positive cells (d) at 5 weeks of cuprizone treatment compared to control conditions (dotted line). Two fields per slice and two slices per animal (n = 4: control; n = 5: cuprizone) were analyzed. All bar graphs depict means ± SEMs. *p < 0.05, **p < 0.01, ***p < 0.001, not significant (ns) p ≥ 0.05 (one-sample t test; compared to set control value = 1)
Fig. 4
Fig. 4
Cuprizone treatment leads to excitatory synaptic changes in the lateral geniculate nucleus. a Bar graph depicting the number of puncta immuno-positive for vesicular glutamate transporter 2 (vGluT2; pre-synaptic, excitatory) and postsynaptic density protein 95 (PSD95; postsynaptic) in the dLGN at 5 weeks of cuprizone treatment. Control levels were set to 1.0 (dotted line). Two fields per slice and two slices per animal (n = 4: control; n = 5: cuprizone) were analyzed. b Representative confocal images showing the distribution of vGluT2- and PSD95-positive synaptic densities at 5 weeks of cuprizone treatment (lower panels) or under control conditions (upper panels). The outer right panels depict the areas marked by the dotted squares; dotted circles mark vGluT2/PSD95 double-positive densities. Scale bars: 20 and 5 μm (outer right panels). c Bar graph depicting vGluT2 protein levels at 3 (3w) and 5 (5w) weeks of cuprizone treatment. Glyceraldehyde 3-phosphate dehydrogenase (GAPDH) protein levels were used for normalization. n = 4: control and cuprizone 3w; n = 7: control and cuprizone 5w. A representative Western blot is shown in the inset (upper right). All bar graphs depict means ± SEMs. *p < 0.05, **p < 0.01, ***p < 0.001, not significant (ns) p ≥ 0.05 (one-sample t test; compared to set control value = 1)
Fig. 5
Fig. 5
Cuprizone treatment leads to inhibitory synaptic changes in the lateral geniculate nucleus. a Bar graph depicting the number of puncta immuno-positive for the vesicular GABA transporter vGAT (pre-synaptic, inhibitory) in the dLGN at 5 weeks of cuprizone treatment. Control levels were set to 1.0 (dotted line). Two fields per slice and two slices per animal (n = 3: control and cuprizone) were analyzed. b Representative images showing the distribution of vGAT-positive synaptic densities at 5 weeks of cuprizone treatment (right panel) or under control conditions (left panel). Scale bar: 20 μm. The bar graph depicts mean ± SEMs. *p < 0.05, **p < 0.01, ***p < 0.001, not significant (ns) p ≥ 0.05 (one-sample t test; compared to set control value = 1)
Fig. 6
Fig. 6
Cuprizone treatment leads to an increase in the NMDAR subunit GluN2B within the dorsal lateral geniculate nucleus (dLGN). a Bar graph depicting mRNA levels for NMDAR subunits GluN2A (Grin2a) and GluN2B (Grin2b) as determined by RT-qPCR analysis at 3 (3w) and 5 (5w) weeks of cuprizone treatment. n = 6: Grin2a control and cuprizone 3w and 5w; n = 7: Grin2b control and cuprizone 3w and 5w. b Bar graph illustrating protein levels for the NMDAR subunits GluN2B at 5 weeks of cuprizone treatment. GAPDH protein levels were used for normalization. A representative Western blot is shown in the inset (upper right). n = 5: Control (CTL) and Cuprizone (CPZ). c Representative confocal images depicting immunostaining for the NMDA receptor subunit GluN2B (middle panels) and glutamic acid decarboxylase 67 (GAD67) as a marker for inhibitory neurons (left panels) in the dLGN at 5 weeks of cuprizone treatment (lower panels) or under control conditions (upper panels). Arrows in the lower panels indicate cells labeling positive for both GAD67 and GluN2B. Scale bar: 20 μm. d Bar graph illustrating the number of GluN2B-positive puncta co-localizing with GAD67 at 5 weeks of cuprizone treatment. 2 fields per slice and 2 slices per animal (n = 4: Control; n = 5: Cuprizone) were analyzed. All bar graphs depict means ± SEMs. *p < 0.05, **p < 0.01, ***p < 0.001, not significant (ns) p ≥ 0.05 (one-sample t test; compared to set control value = 1)
Fig. 7
Fig. 7
Cuprizone treatment (5 weeks) leads to a decrease in retinogeniculate network activity. a Representative example of traces obtained in the presence (red; iGluR blockade) or absence (black; baseline) of the glutamate receptor antagonists APV (NMDA receptor-selective) and DNQX (AMPA/kainate receptor-selective). Note that only the second peak of the traces is glutamate receptor inhibition-sensitive. b, c Representative example (b) and bar graph depicting the current amplitude (c) of traces obtained in the presence (red; GluN2B blockade) or absence (black; baseline) of Ro 25-6981, a selective blocker of NMDA receptors containing the GluN2B subunit. n = 5: cuprizone; n = 8: control. The bar graph depicts means ± SEMs. *p < 0.05, **p < 0.01, ***p < 0.001, not significant (ns) p ≥ 0.05 (unpaired two-tailed Student’s t test)

References

    1. Dutta R, Trapp BD. Relapsing and progressive forms of multiple sclerosis: insights from pathology. Curr Opin Neurol. 2014;27:271–278. doi: 10.1097/WCO.0000000000000094. - DOI - PMC - PubMed
    1. Di Filippo M, de Iure A, Durante V, Gaetani L, Mancini A, Sarchielli P, Calabresi P. Synaptic plasticity and experimental autoimmune encephalomyelitis: implications for multiple sclerosis. Brain Res. 2015;1621:205–213. doi: 10.1016/j.brainres.2014.12.004. - DOI - PubMed
    1. Mandolesi G, Gentile A, Musella A, Fresegna D, De Vito F, Bullitta S, Sepman H, Marfia GA, Centonze D. Synaptopathy connects inflammation and neurodegeneration in multiple sclerosis. Nat Rev Neurol. 2015;11:711–724. doi: 10.1038/nrneurol.2015.222. - DOI - PubMed
    1. Musella A, Mandolesi G, Mori F, Gentile A, Centonze D. Linking synaptopathy and gray matter damage in multiple sclerosis. Mult Scler. 2016;22:146–149. doi: 10.1177/1352458515581875. - DOI - PubMed
    1. Mandolesi G, Gentile A, Musella A, Centonze D. IL-1beta dependent cerebellar synaptopathy in a mouse mode of multiple sclerosis. Cerebellum. 2015;14:19–22. doi: 10.1007/s12311-014-0613-0. - DOI - PubMed

Publication types

LinkOut - more resources