

Genetic and epigenetic susceptibility of airway inflammation to PM2.5 in school children: new insights from quantile regression
- PMID: 28821285
- PMCID: PMC5563051
- DOI: 10.1186/s12940-017-0285-6
Genetic and epigenetic susceptibility of airway inflammation to PM2.5 in school children: new insights from quantile regression
Abstract
Background: The fractional concentration of exhaled nitric oxide (FeNO) is a biomarker of airway inflammation that has proved to be useful in investigations of genetic and epigenetic airway susceptibility to ambient air pollutants. For example, susceptibility to airway inflammation from exposure to particulate matter with aerodynamic diameter < =2.5 μm (PM2.5) varies by haplotypes and promoter region methylation in inducible nitric oxide synthase (iNOS encoded by NOS2). We hypothesized that PM2.5 susceptibility associated with these epigenetic and genetic variants may be greater in children with high FeNO from inflamed airways. In this study, we investigated genetic and epigenetic susceptibility to airborne particulate matter by examining whether the joint effects of PM2.5, NOS2 haplotypes and iNOS promoter methylation significantly vary across the distribution of FeNO in school children.
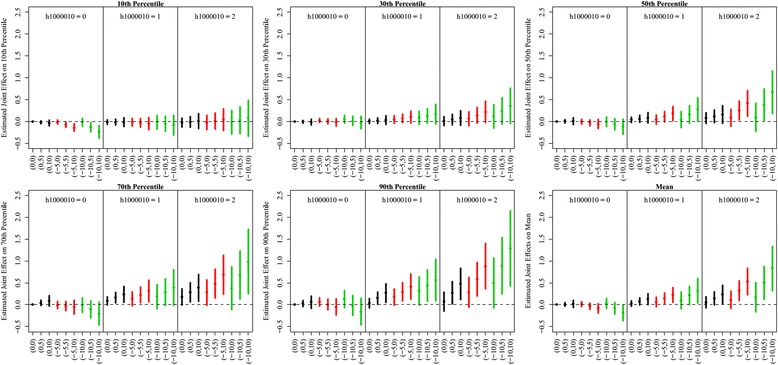
Methods: The study included 940 school children in the southern California Children's Health Study who provided concurrent buccal samples and FeNO measurements. We used quantile regression to examine susceptibility by estimating the quantile-specific joint effects of PM2.5, NOS2 haplotype and methylation on FeNO.
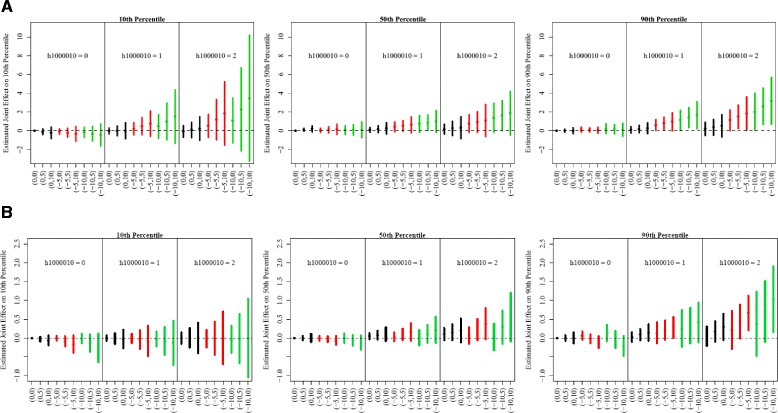
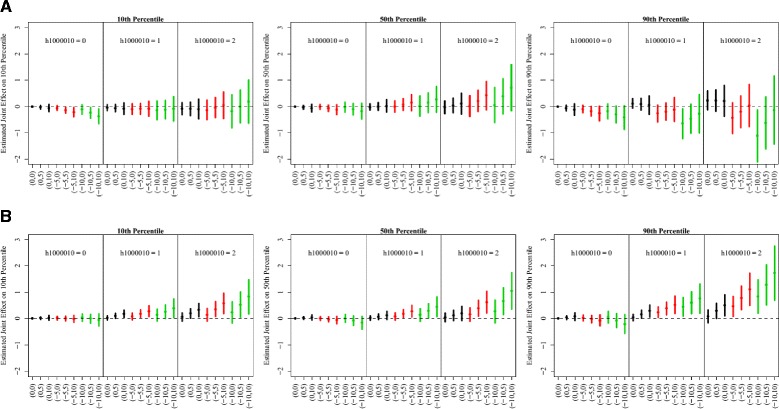
Results: We discovered striking differences in susceptibility to PM2.5 in school children. The joint effects of short-term PM2.5 exposure, NOS2 haplotypes and methylation across the FeNO distribution were significantly larger in the upper tail of the FeNO distribution, with little association in its lower tail, especially among children with asthma and Hispanic white children.
Conclusion: School-aged children with higher FeNO have greater genetic and epigenetic susceptibility to PM2.5, highlighting the importance of investigating effects across the entire distribution of FeNO.
Keywords: Asthma; Exhaled nitric oxide; Haplotype; Inducible nitric oxide synthase; Methylation; PM2.5.
Conflict of interest statement
Ethics approval and consent to participate
The study was approved by the University of Southern California Internal Review Board.
Consent for publication
N/A.
Competing interests
The authors declare that they have no competing interests.
Figures
Similar articles
-
Genetic and epigenetic variations in inducible nitric oxide synthase promoter, particulate pollution, and exhaled nitric oxide levels in children.J Allergy Clin Immunol. 2012 Jan;129(1):232-9.e1-7. doi: 10.1016/j.jaci.2011.09.037. Epub 2011 Nov 4. J Allergy Clin Immunol. 2012. PMID: 22055874 Free PMC article.
-
Inducible Nitric Oxide Synthase Promoter Haplotypes and Residential Traffic-Related Air Pollution Jointly Influence Exhaled Nitric Oxide Level in Children.PLoS One. 2015 Dec 29;10(12):e0145363. doi: 10.1371/journal.pone.0145363. eCollection 2015. PLoS One. 2015. PMID: 26714306 Free PMC article.
-
Association between fine particulate matter chemical constituents and airway inflammation: A panel study among healthy adults in China.Environ Res. 2016 Oct;150:264-268. doi: 10.1016/j.envres.2016.06.022. Epub 2016 Jun 21. Environ Res. 2016. PMID: 27340812
-
Understanding the Cellular Sources of the Fractional Exhaled Nitric Oxide (FeNO) and Its Role as a Biomarker of Type 2 Inflammation in Asthma.Biomed Res Int. 2022 May 2;2022:5753524. doi: 10.1155/2022/5753524. eCollection 2022. Biomed Res Int. 2022. PMID: 35547356 Free PMC article. Review.
-
An Overview of Fractional Exhaled Nitric Oxide and Children with Asthma.Expert Rev Clin Immunol. 2016;12(5):521-30. doi: 10.1586/1744666X.2016.1141049. Epub 2016 Feb 19. Expert Rev Clin Immunol. 2016. PMID: 26757849 Free PMC article. Review.
Cited by
-
A GWAS approach identifies Dapp1 as a determinant of air pollution-induced airway hyperreactivity.PLoS Genet. 2019 Dec 23;15(12):e1008528. doi: 10.1371/journal.pgen.1008528. eCollection 2019 Dec. PLoS Genet. 2019. PMID: 31869344 Free PMC article.
-
Genetic susceptibility to airway inflammation and exposure to short-term outdoor air pollution.Environ Health. 2023 Jun 29;22(1):50. doi: 10.1186/s12940-023-00996-7. Environ Health. 2023. PMID: 37386634 Free PMC article.
-
A Bayesian spatio-temporal analysis of neighborhood pediatric asthma emergency department visit disparities.Health Place. 2020 Nov;66:102426. doi: 10.1016/j.healthplace.2020.102426. Epub 2020 Oct 1. Health Place. 2020. PMID: 33011491 Free PMC article.
-
Airway inflammation, asthma, and soot.Pediatr Res. 2025 Jan;97(1):13-14. doi: 10.1038/s41390-024-03447-2. Epub 2024 Aug 24. Pediatr Res. 2025. PMID: 39181983 No abstract available.
-
Short-Term Effects of Particulate Matter and Its Constituents on Emergency Room Visits for Chronic Obstructive Pulmonary Disease: A Time-Stratified Case-Crossover Study in an Urban Area.Int J Environ Res Public Health. 2021 Apr 21;18(9):4400. doi: 10.3390/ijerph18094400. Int J Environ Res Public Health. 2021. PMID: 33919089 Free PMC article.
References
-
- Horvatch I, de Jongste JC. European respiratory monograph 49: exhaled biomarkers. United States: European Respiratory Society; 2010.
-
- Dweik RA, Boggs PB, Erzurum SC, Irvin CG, Leigh MW, Lundberg JO, Olin AC, Plummer AL, Taylor DR. An official ATS clinical practice guideline: interpretation of exhaled nitric oxide levels (FENO) for clinical applications. Am J Respir Crit Care Med. 2011;184(5):602–615. doi: 10.1164/rccm.9120-11ST. - DOI - PMC - PubMed
Publication types
MeSH terms
Substances
Grants and funding
LinkOut - more resources
Full Text Sources
Other Literature Sources
