

Spontaneous mutation of Dock7 results in lower trabecular bone mass and impaired periosteal expansion in aged female Misty mice
- PMID: 28821457
- PMCID: PMC5693233
- DOI: 10.1016/j.bone.2017.08.006
Spontaneous mutation of Dock7 results in lower trabecular bone mass and impaired periosteal expansion in aged female Misty mice
Abstract
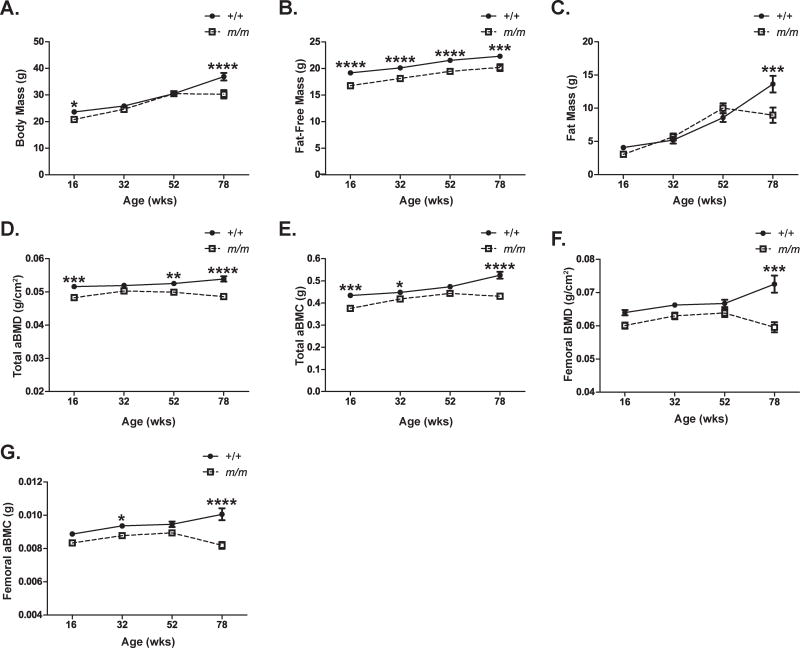
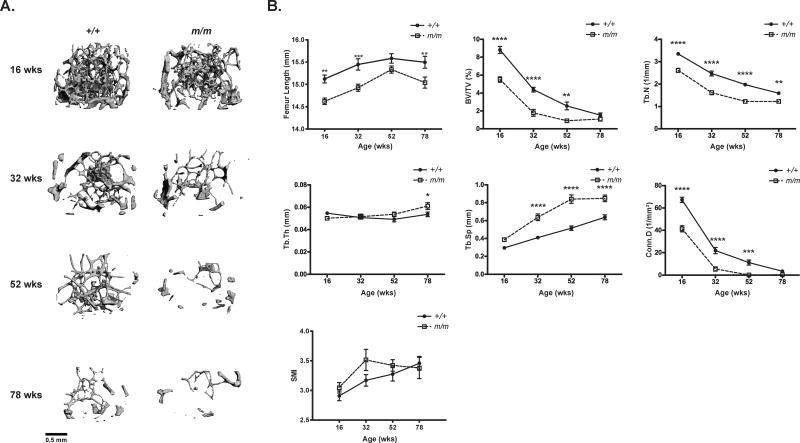
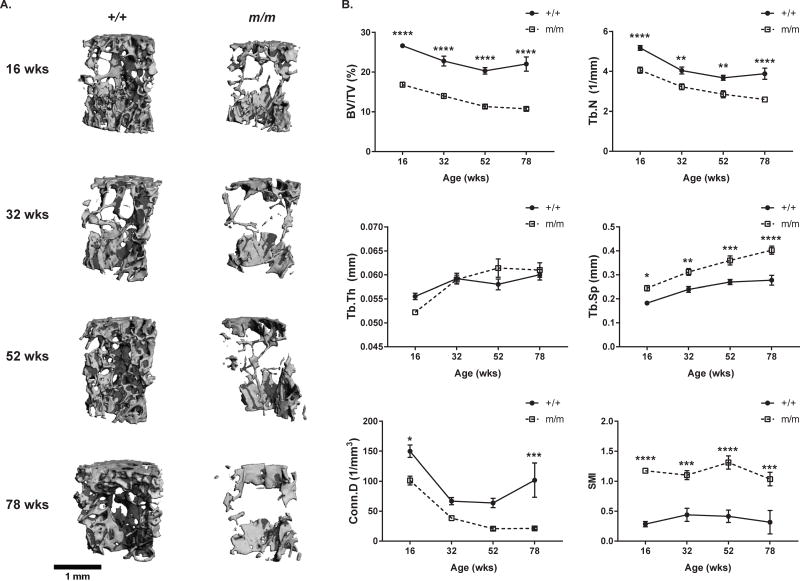
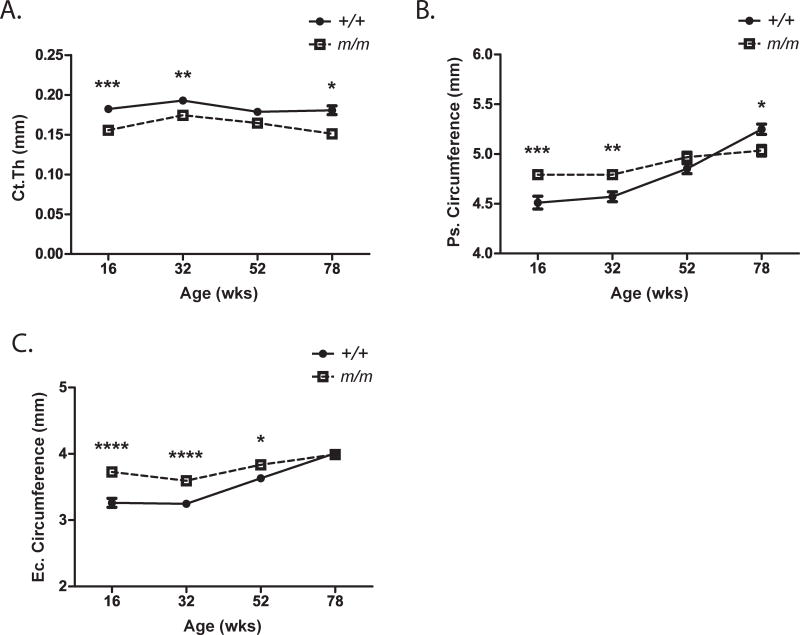
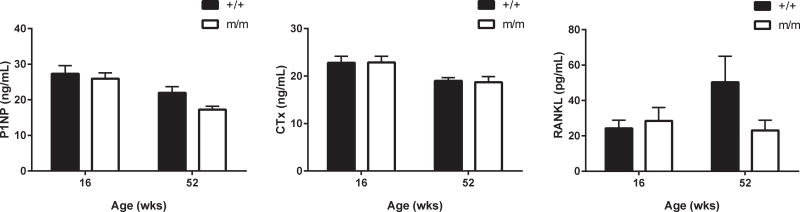
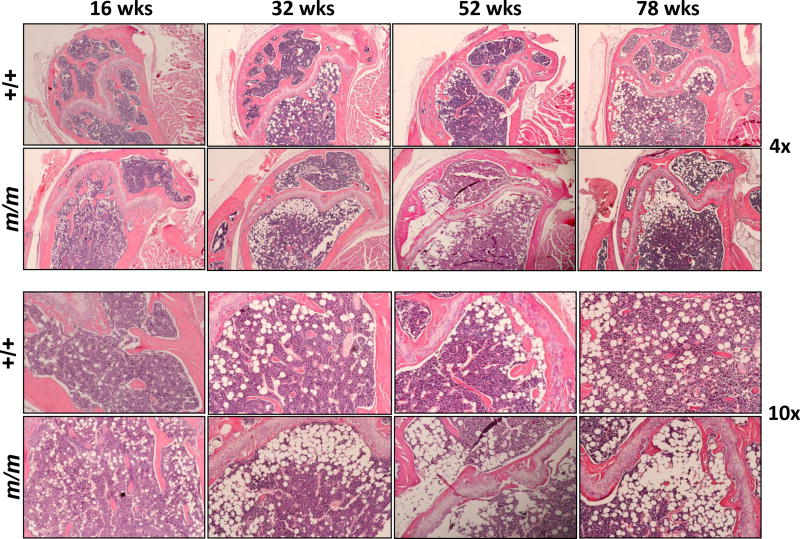
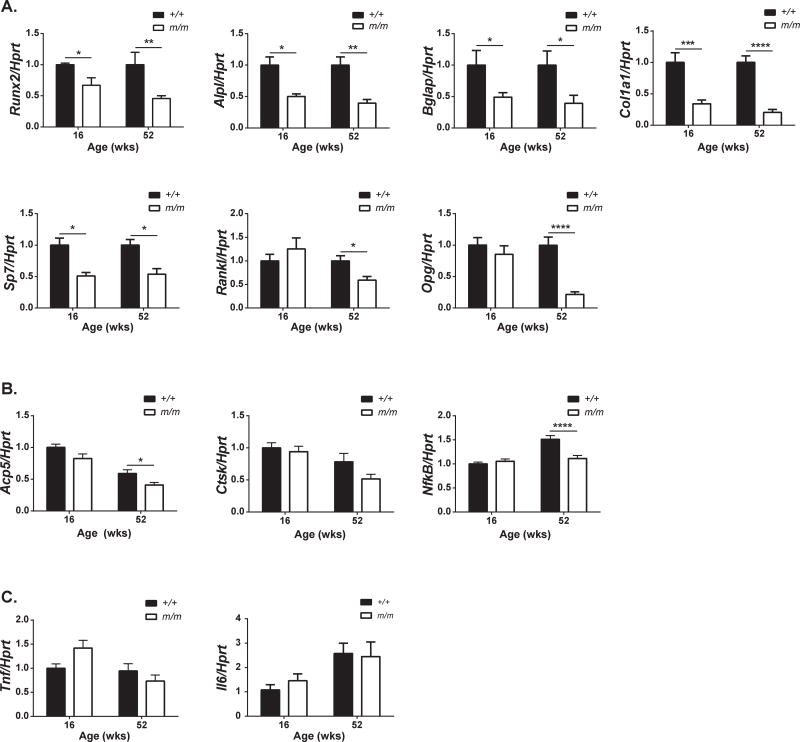
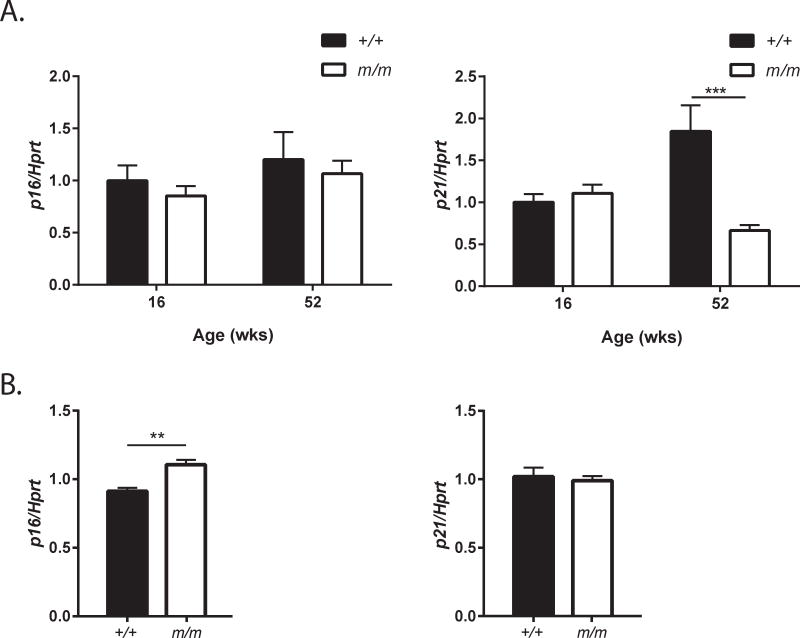
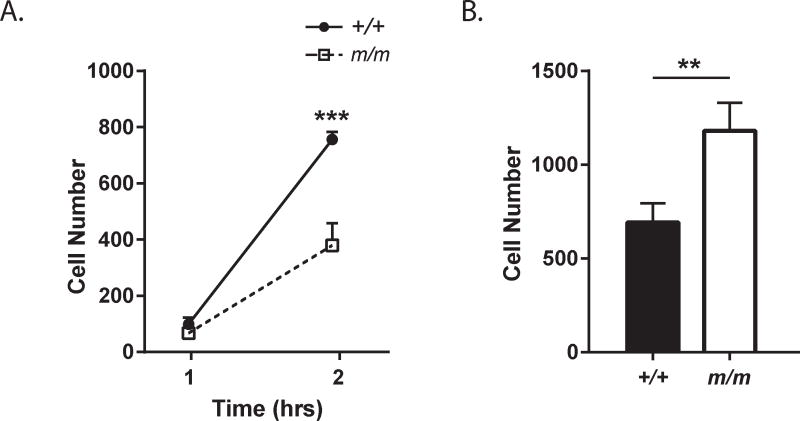
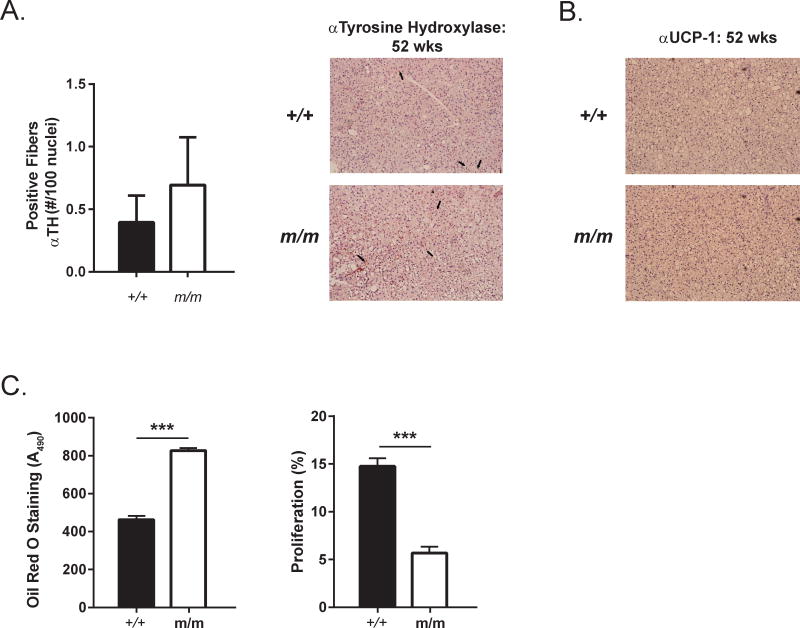
Misty mice (m/m) have a loss of function mutation in Dock7 gene, a guanine nucleotide exchange factor, resulting in low bone mineral density, uncoupled bone remodeling and reduced bone formation. Dock7 has been identified as a modulator of osteoblast number and in vitro osteogenic differentiation in calvarial osteoblast culture. In addition, m/m exhibit reduced preformed brown adipose tissue innervation and temperature as well as compensatory increase in beige adipocyte markers. While the low bone mineral density phenotype is in part due to higher sympathetic nervous system (SNS) drive in young mice, it is unclear what effect aging would have in mice homozygous for the mutation in the Dock7 gene. We hypothesized that age-related trabecular bone loss and periosteal envelope expansion would be altered in m/m. To test this hypothesis, we comprehensively characterized the skeletal phenotype of m/m at 16, 32, 52, and 78wks of age. When compared to age-matched wild-type control mice (+/+), m/m had lower areal bone mineral density (aBMD) and areal bone mineral content (aBMC). Similarly, both femoral and vertebral BV/TV, Tb.N, and Conn.D were decreased in m/m while there was also an increase in Tb.Sp. As low bone mineral density and decreased trabecular bone were already present at 16wks of age in m/m and persisted throughout life, changes in age-related trabecular bone loss were not observed highlighting the role of Dock7 in controlling trabecular bone acquisition or bone loss prior to 16wks of age. Cortical thickness was also lower in the m/m across all ages. Periosteal and endosteal circumferences were higher in m/m compared to +/+ at 16wks. However, endosteal and periosteal expansion were attenuated in m/m, resulting in m/m having lower periosteal and endosteal circumferences by 78wks of age compared to +/+, highlighting the critical role of Dock7 in appositional bone expansion. Histomorphometry revealed that osteoblasts were nearly undetectable in m/m and marrow adipocytes were elevated 3.5 fold over +/+ (p=0.014). Consistent with reduced bone formation, osteoblast gene expression of Alp, Col1a1, Runx-2, Sp7, and Bglap was significantly decreased in m/m whole bone. Furthermore, markers of osteoclasts were either unchanged or suppressed. Bone marrow stromal cell migration and motility were inhibited in culture and changes in senescence markers suggest that osteoblast function may also be inhibited with loss of Dock7 expression in m/m. Finally, increased Oil Red O staining in m/m ear mesenchymal stem cells during adipogenesis highlights a potential shift of cells from the osteogenic to adipogenic lineages. In summary, loss of Dock7 in the aging m/m resulted in an impairment of periosteal and endocortical envelope expansion, but did not alter age-related trabecular bone loss. These studies establish Dock7 as a critical regulator of both cortical and trabecular bone mass, and demonstrate for the first time a novel role of Dock7 in modulating compensatory changes in the periosteum with aging.
Keywords: Aging; Bone; Dock7; Misty; Osteoporosis; Periosteal.
Copyright © 2017 Elsevier Inc. All rights reserved.
Figures
Similar articles
-
Altered thermogenesis and impaired bone remodeling in Misty mice.J Bone Miner Res. 2013 Sep;28(9):1885-97. doi: 10.1002/jbmr.1943. J Bone Miner Res. 2013. PMID: 23553822 Free PMC article.
-
Calorie restriction in mice impairs cortical but not trabecular peak bone mass by suppressing bone remodeling.J Bone Miner Res. 2024 Aug 21;39(8):1188-1199. doi: 10.1093/jbmr/zjae104. J Bone Miner Res. 2024. PMID: 38995944 Free PMC article.
-
Jagged1 expression by osteoblast-lineage cells regulates trabecular bone mass and periosteal expansion in mice.Bone. 2016 Oct;91:64-74. doi: 10.1016/j.bone.2016.07.006. Epub 2016 Jul 12. Bone. 2016. PMID: 27416809 Free PMC article.
-
Reduced bone formation and increased bone resorption: rational targets for the treatment of osteoporosis.Osteoporos Int. 2003;14 Suppl 3:S2-8. doi: 10.1007/s00198-002-1340-9. Epub 2003 Mar 19. Osteoporos Int. 2003. PMID: 12730770 Review.
-
The skeleton in primary hyperparathyroidism: a review focusing on bone remodeling, structure, mass, and fracture.APMIS Suppl. 2001;(102):1-52. APMIS Suppl. 2001. PMID: 11419022 Review.
Cited by
-
A Population of M2 Macrophages Associated With Bone Formation.Front Immunol. 2021 Oct 12;12:686769. doi: 10.3389/fimmu.2021.686769. eCollection 2021. Front Immunol. 2021. PMID: 34712222 Free PMC article.
-
Reporting Guidelines, Review of Methodological Standards, and Challenges Toward Harmonization in Bone Marrow Adiposity Research. Report of the Methodologies Working Group of the International Bone Marrow Adiposity Society.Front Endocrinol (Lausanne). 2020 Feb 28;11:65. doi: 10.3389/fendo.2020.00065. eCollection 2020. Front Endocrinol (Lausanne). 2020. PMID: 32180758 Free PMC article. Review.
-
TGF-β prevents the denervation-induced reduction of bone formation and promotes the bone regeneration through inhibiting ubiquitin-proteasome pathway.Biosci Rep. 2019 May 14;39(5):BSR20190350. doi: 10.1042/BSR20190350. Print 2019 May 31. Biosci Rep. 2019. PMID: 31015371 Free PMC article.
-
Housing Temperature Influences Atypical Antipsychotic Drug-Induced Bone Loss in Female C57BL/6J Mice.JBMR Plus. 2021 Sep 7;5(10):e10541. doi: 10.1002/jbm4.10541. eCollection 2021 Oct. JBMR Plus. 2021. PMID: 34693191 Free PMC article.
-
Anti-osteoporosis mechanism of resistance exercise in ovariectomized rats based on transcriptome analysis: a pilot study.Front Endocrinol (Lausanne). 2023 Aug 17;14:1162415. doi: 10.3389/fendo.2023.1162415. eCollection 2023. Front Endocrinol (Lausanne). 2023. PMID: 37664852 Free PMC article.
References
-
- Burge R, Dawson-Hughes B, Solomon DH, Wong JB, King A, Tosteson A. Incidence and economic burden of osteoporosis-related fractures in the United States, 2005–2025. J Bone Miner Res. 2007;22:465–75. - PubMed
MeSH terms
Substances
Grants and funding
LinkOut - more resources
Full Text Sources
Other Literature Sources
Medical
Molecular Biology Databases
Research Materials
Miscellaneous
