. 2017 Oct;207(2):669-684.
doi: 10.1534/genetics.117.300144. Epub 2017 Aug 16.

Accumulation of Deleterious Mutations During Bacterial Range Expansions

Affiliations

Accumulation of Deleterious Mutations During Bacterial Range Expansions

Lars Bosshard et al. Genetics. 2017 Oct.

Abstract

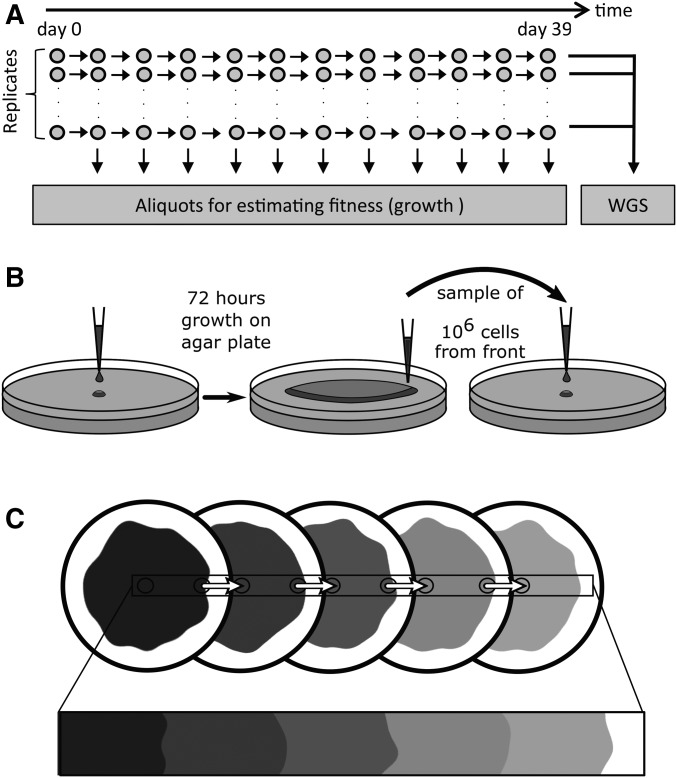
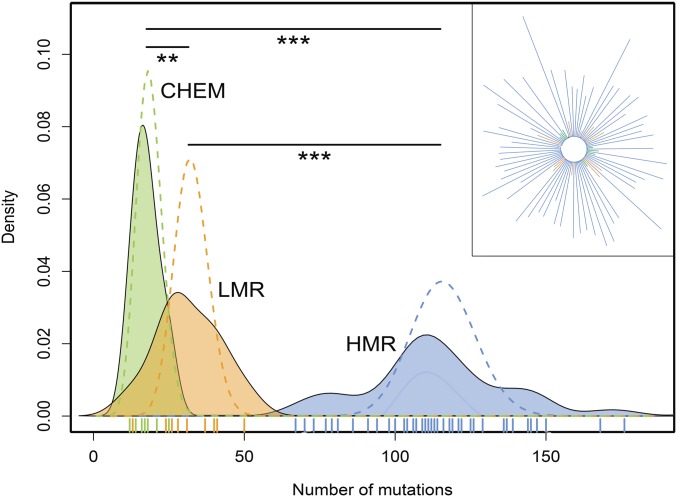
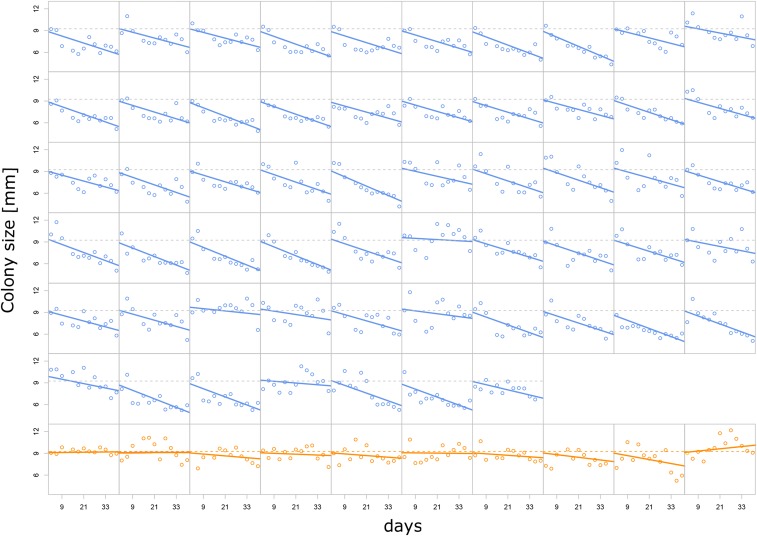
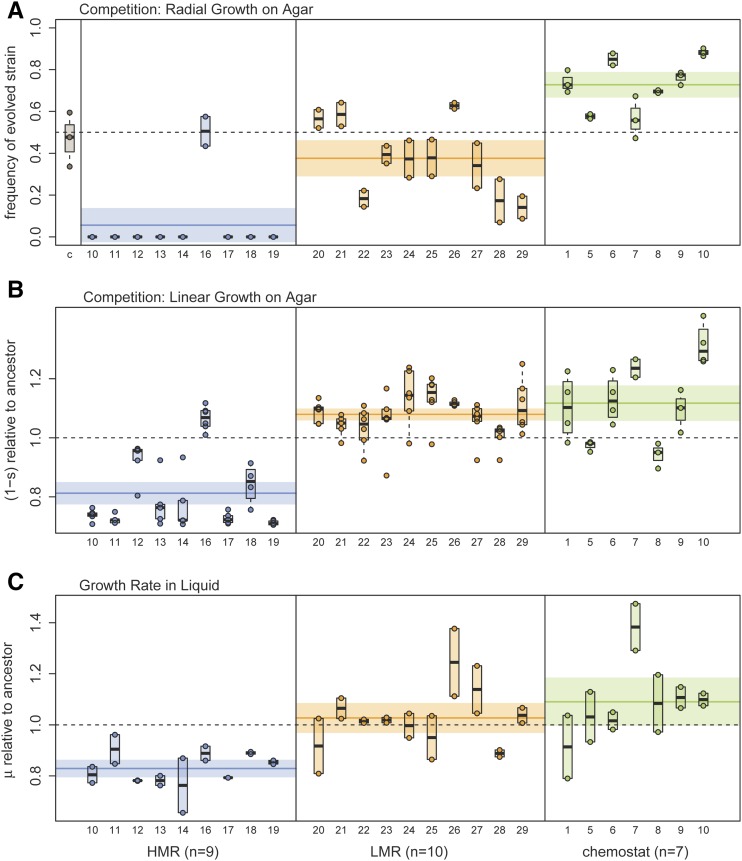
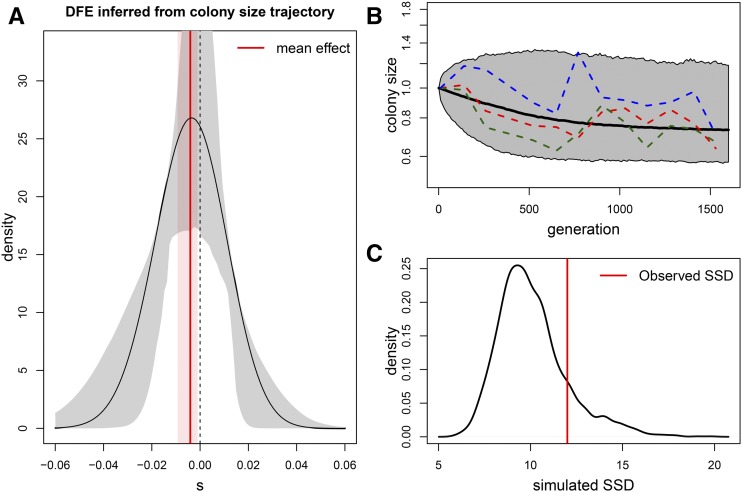
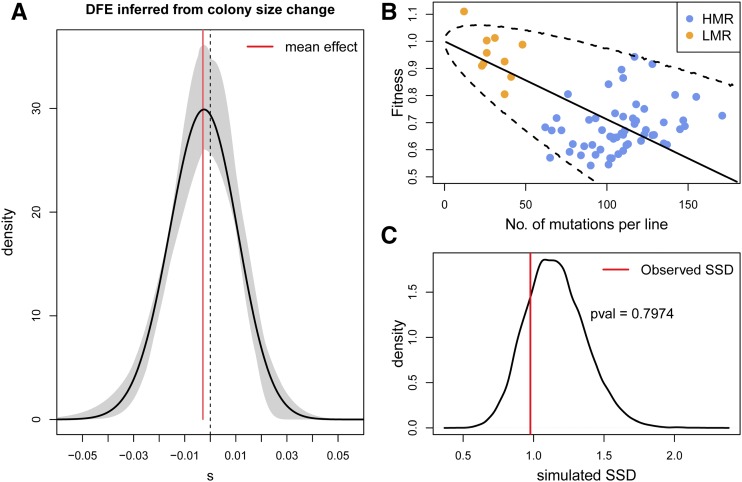
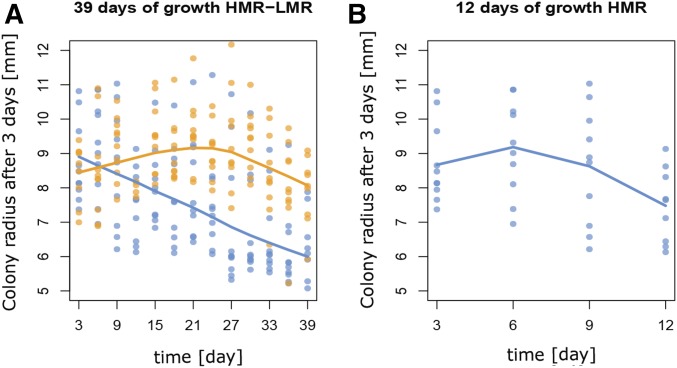
Recent theory predicts that the fitness of pioneer populations can decline when species expand their range, due to high rates of genetic drift on wave fronts making selection less efficient at purging deleterious variants. To test these predictions, we studied the fate of mutator bacteria expanding their range for 1650 generations on agar plates. In agreement with theory, we find that growth abilities of strains with a high mutation rate (HMR lines) decreased significantly over time, unlike strains with a lower mutation rate (LMR lines) that present three to four times fewer mutations. Estimation of the distribution of fitness effect under a spatially explicit model reveals a mean negative effect for new mutations (-0.38%), but it suggests that both advantageous and deleterious mutations have accumulated during the experiment. Furthermore, the fitness of HMR lines measured in different environments has decreased relative to the ancestor strain, whereas that of LMR lines remained unchanged. Contrastingly, strains with a HMR evolving in a well-mixed environment accumulated less mutations than agar-evolved strains and showed an increased fitness relative to the ancestor. Our results suggest that spatially expanding species are affected by deleterious mutations, leading to a drastic impairment of their evolutionary potential.

Keywords: experimental evolution; mutation load; range expansions.


Figures

Figure 1
Figure 1
Experimental setup. (A) mutS E. coli lines were grown on agar plates for a total of 39 days or ∼1650 generations assuming a generation time of 34 min (Figure S2 in File S1). (B) After 3 days of growth, ∼100 million bacteria are sampled on the edge of the colony, diluted in 1 μl LB medium, and ∼106 bacteria are deposited at the center of a new agar plate for a new 3-day growth cycle. This transfer should thus not impose any substantial bottleneck for the cells sampled on the edge of the colony that we are interested in following through time. This procedure was repeated 12 times for a total of 39 days of evolution for each line. (C) The expansion on several plates aims to mimic a continuous expansion. WGS, whole-genome sequencing.
Figure 2
Figure 2
Number of mutations in evolved strains. Distribution of the total number of observed mutations per strain. Dashed lines are Poisson distributions fitted to the mean of the observed distributions. The three means are significantly different by a Mann–Whitney test (HMR vs. LMR: P-value = 5.52 × 10⁻⁷; HMR vs. CHEM: P-value = 1.85 × 10⁻⁷; and LMR vs. CHEM: P-value = 0.0084). In the upper right inset we show a neighbor joining tree of the different strains (represented with the same color code as in the main figure). CHEM, chemostat; HMR, high mutation rate; LMR, low mutation rate; **, p < 0.01; ***, p < 0.001.
Figure 3
Figure 3
Evolution of colony radius after 3 days of growth on agar. Blue, HMR lines; orange, LMR lines. The x-axis scale represents total days of evolution. Horizontal dashed lines represent the average colony size measured after the first 3 days of growth over all HMR or all LMR lines. Mixed-effect linear regressions have been performed separately for HMR and LMR strains. Solid lines represent strain-specific regression lines, with slopes obtained as the sum of fixed and line-specific effects. HMR change in growth rate per day: −78 μm, 95% C.I. (−85; −70), P-value < 2 10−16. LMR change in growth rate per day: −11 μm, 95% C.I. (−33; 10), P-value = 0.29 NS. HMR, high mutation rate; LMR, low mutation rate; NS, not significant.
Figure 4
Figure 4
Estimation of bacterial fitness. (A) Relative frequency of evolved strains on the edge of the colony after 3 days of radial growth on an agar plate, under conditions similar to those of our experiment of range expansion on agar (see Materials and Methods and Figure S5 in File S1). Note that this measure only gives a qualitative assessment of the relative fitness of two strains, as this proportion will quickly change over time in case of unequal fitness (Gralka et al. 2016b). The first column (c) of the leftmost pane represents the relative frequency of the ancestral strain containing the same plasmid as the evolved strains, showing that the incorporated plasmids do not induce any fitness difference between strains. (B) Competition on agar plate between a reference strain and evolved lines growing side-by-side for 3-days. The fitness of evolved strains (lines) is measured by the difference in growth rates at the contact zone between strains following Korolev et al. (2012). The angle formed by the contact zone between strains is indeed proportional to their fitness difference (see Materials and Methods). Each dot corresponds to one measure for a given strain. Note that the two HMR lines (12 and 16) with highest fitness both have a nonsynonymous mutation in the mlc (makes large colonies) gene. (C) Fitness of evolved strains relative to the ancestral strain, measured as growth rate in liquid culture. Note that labels on the x-axis represent line identifiers. HMR, high mutation rate; LMR, low mutation rate.
Figure 5
Figure 5
Distribution of fitness effects (DFE). (A) DFE inferred from the evolutionary trajectory of colony size over time shown in Figure 3. Parameters were estimated by minimizing the sum of squared deviations (SSD) from the expectation of colony size obtained from the model described in Peischl et al. (2015). Estimated parameters of the displaced γ distribution: α=972;β=2220.2;δ=0.434. The effective population size at the expansion front is estimated as Ne=14.6, and the mean mutation effect is −0.00379. The gray area delimits an empirical 95% C.I. obtained from parametric bootstrap. The corresponding 95% C.I. for the mean mutation effect is shown in pink. (B) Evolution of colony size obtained by simulations using the estimated parameters. The solid line shows the average and the borders of the gray shaded area indicate the 0.5 and 99.5 percentiles of the simulated data, both estimated from 1000 simulations. The dashed lines show three randomly chosen examples of the observed colony size evolution of the high mutation rate strain. (C) Test of goodness of fit of the observed fitness under the estimated DFE shown in (A). The SSD between observed and expected fitness is compared to the distribution of SSD between the expected fitness and that simulated using the estimated parameters. The simulated SSD density was computed from 1000 simulations. The observed deviation between expected and observed fitness in (B) is thus not significant (P-value = 0.18).
Figure 6
Figure 6
Distribution of fitness effects (DFE). (A) Black line: DFE inferred from the change of colony size over time shown in Figure 3. Maximum likelihood parameters of the displaced γ distribution: α=989.95;β=2357.2;δ=0.417. Mean mutation effect = −0.00288. The gray area delimits an empirical 95% C.I. obtained from parametric bootstrap. The corresponding 95% C.I. for the mean mutation effect is extremely narrow around the mean value (red vertical line) and shown in pink. (B) Fitness of bacteria as a function the number of observed mutations in HMR and LMR strains. The solid black line is the mean fitness decline expected under the DFE shown in (A), and the dashed lines represent limits of a 95% C.I. around the mean, both estimated from 50,000 simulations. (C) Test of goodness of fit of the observed fitness under the maximum likelihood DFE shown in (A). The SSD between observed and expected fitness is compared to the distribution of SSD between the expected fitness and that simulated under the ML DFE for the same numbers of mutations as those observed. The simulated SSD density was computed from 20,000 simulations. The observed deviation between expected and observed fitness in (B) is thus not significant (P-value = 0.80). HMR, high mutation rate; LMR, low mutation rate; ML, maximum likelihood; SSD, sums of square deviations.
Figure 7
Figure 7
Early growth dynamics of HMR and LMR lines. (A) Evolution of HMR (experiment 2) and LMR colony size after 3 days of growth over the course of the experiment. The average size of HMR colonies estimated by a LOESS regression linearly declines over time, whereas that of LMR colonies increases until day 24, and then declines until the end of the experiment. (B) Same as (A) but only for HMR lines during the first 12 days of growth, showing a pattern similar to that of LMR lines but on an ∼4× shorter timescale, which approximately corresponds to their ∼3.7× higher mutation rate (see Table S4 in File S1). HMR, high mutation rate; LMR, low mutation rate; LOESS, locally weighted scatterplot smoothing.

References

    1. Agrawal A. F., Whitlock M. C., 2012. Mutation load: the fitness of individuals in populations where deleterious alleles are abundant. Annu. Rev. Ecol. Evol. Syst. 43: 115–135.
    1. Al Mamun A. A., Lombardo M. J., Shee C., Lisewski A. M., Gonzalez C., et al. , 2012. Identity and function of a large gene network underlying mutagenic repair of DNA breaks. Science 338: 1344–1348. - PMC - PubMed
    1. Barrick J. E., Lenski R. E., 2013. Genome dynamics during experimental evolution. Nat. Rev. Genet. 14: 827–839. - PMC - PubMed
    1. Barrick J. E., Yu D. S., Yoon S. H., Jeong H., Oh T. K., et al. , 2009. Genome evolution and adaptation in a long-term experiment with Escherichia coli. Nature 461: 1243–1247. - PubMed
    1. Blundell J., Levy S., Venkataram S., Petrov D., Fisher D., et al. , 2015. Quantitative evolutionary dynamics of one million barcoded lineages. Bull. Am. Phys. Soc. Volume 60.

LinkOut - more resources