. 2017 Sep 29;292(39):16093-16108.
doi: 10.1074/jbc.M117.797563. Epub 2017 Aug 18.

Protein kinase G confers survival advantage to Mycobacterium tuberculosis during latency-like conditions

Affiliations

Protein kinase G confers survival advantage to Mycobacterium tuberculosis during latency-like conditions

Mehak Zahoor Khan et al. J Biol Chem. .

Abstract

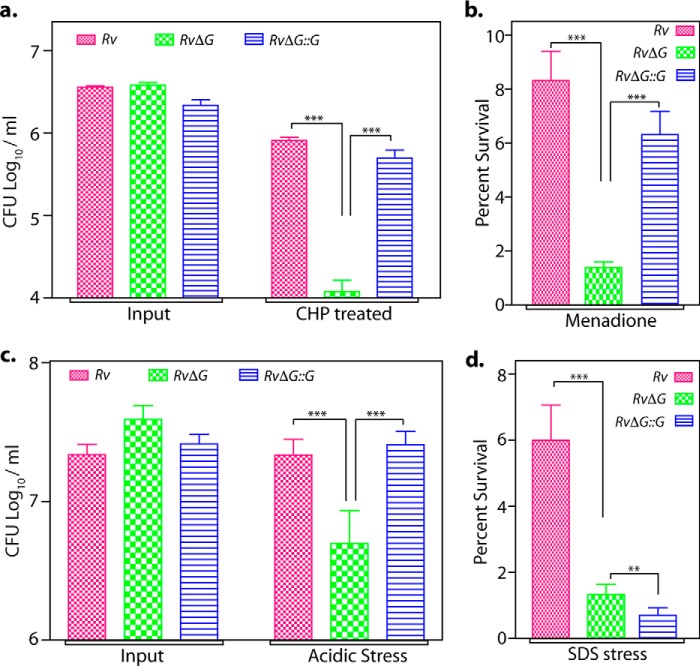
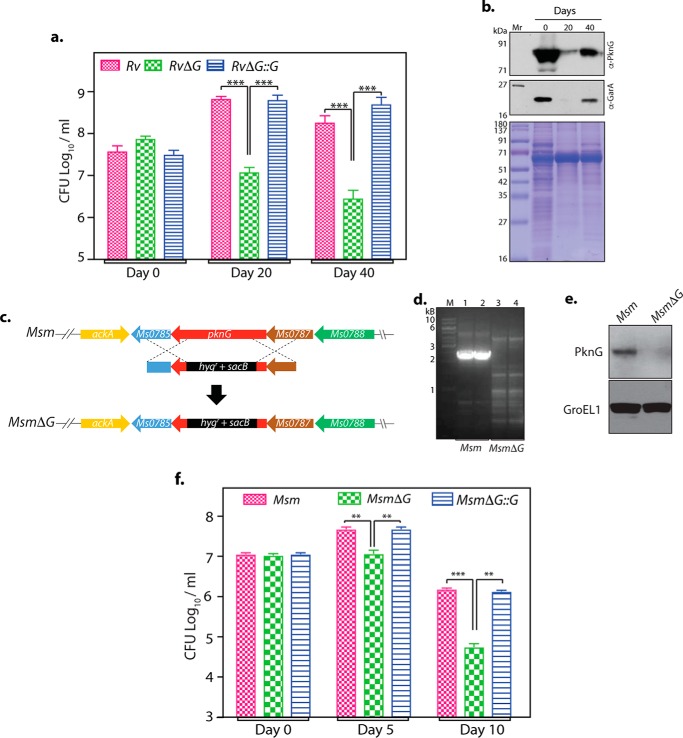
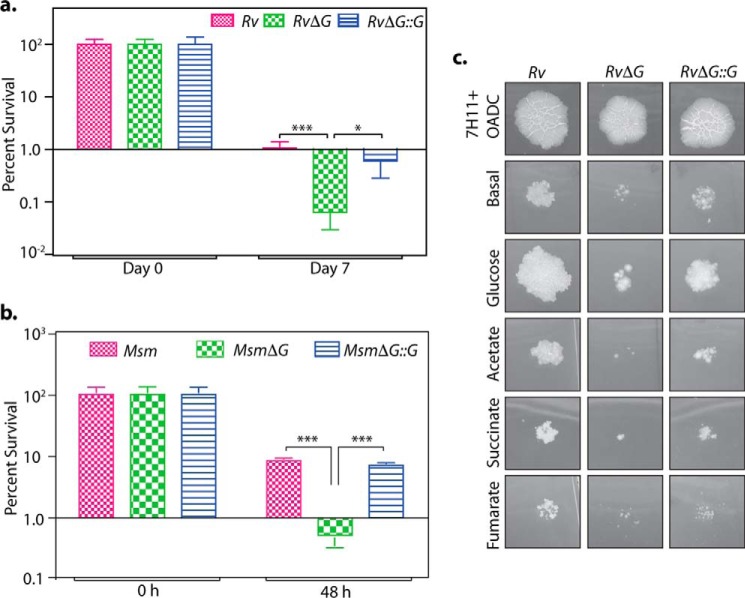
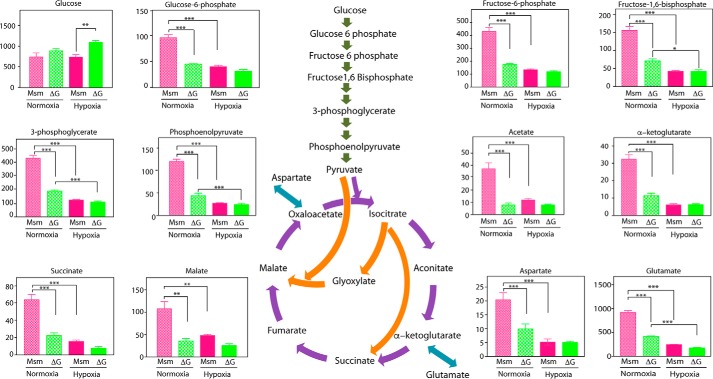
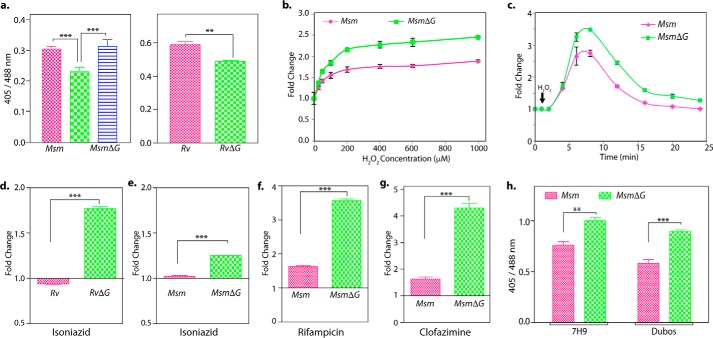
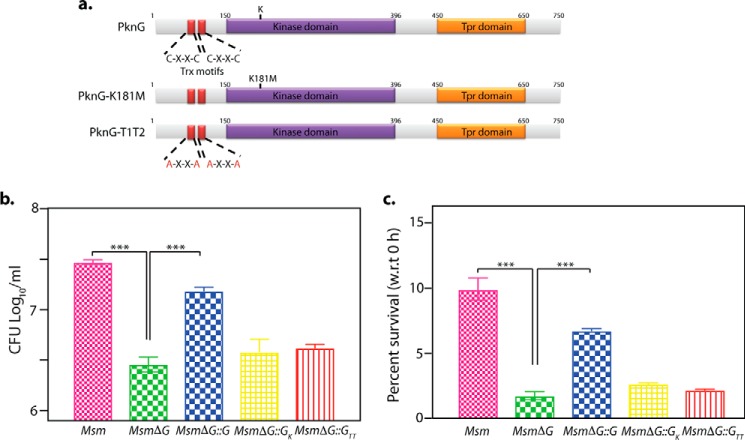
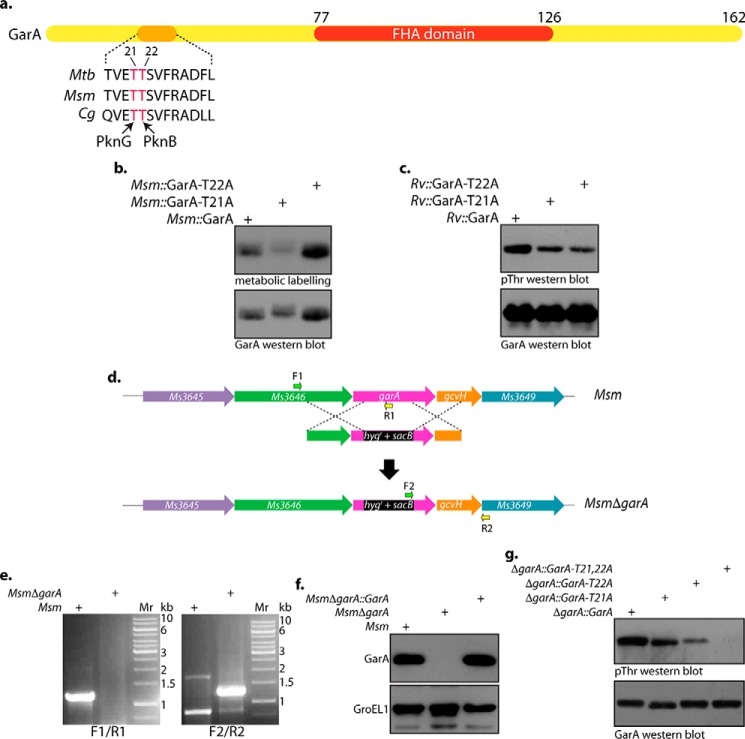
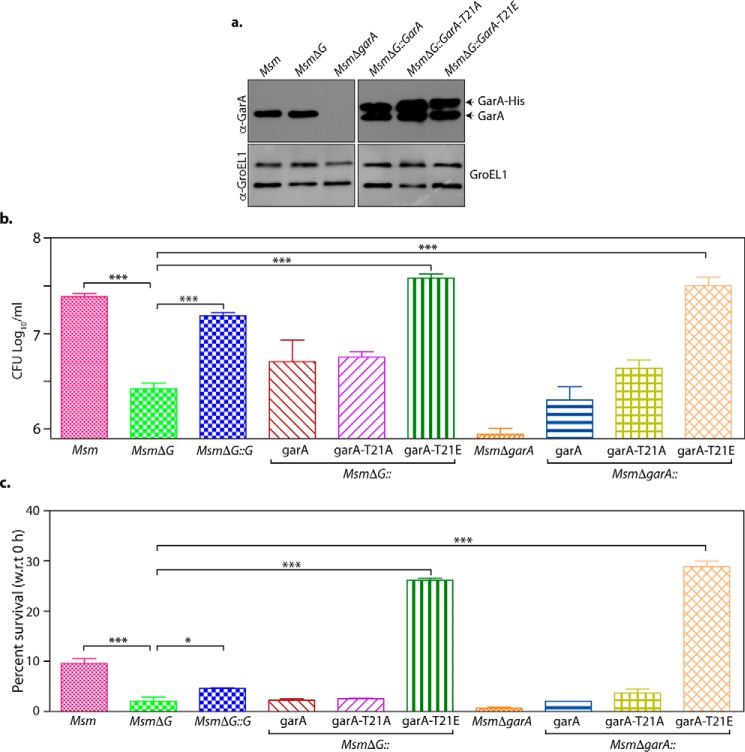
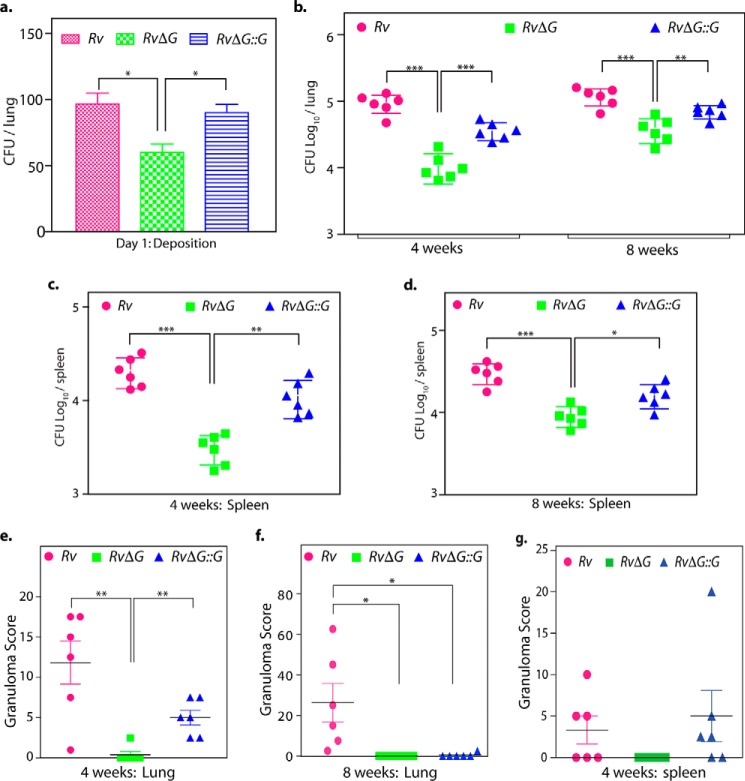
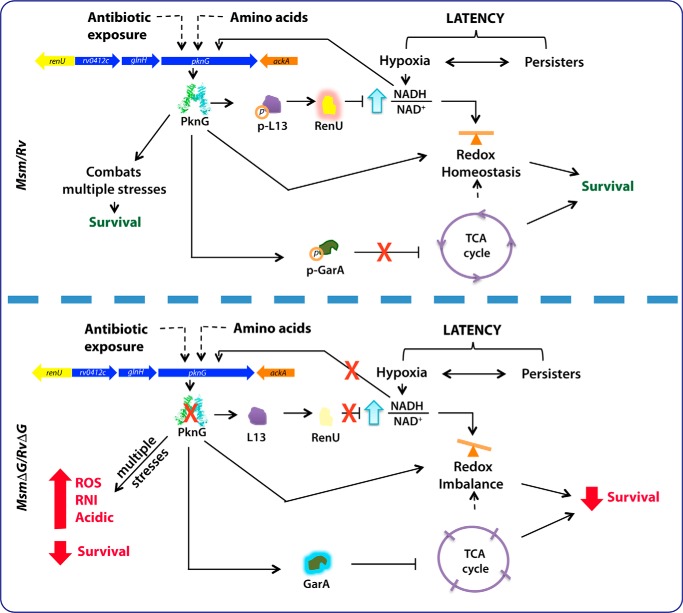
Protein kinase G (PknG), a thioredoxin-fold-containing eukaryotic-like serine/threonine protein kinase, is a virulence factor in Mycobacterium tuberculosis, required for inhibition of phagolysosomal fusion. Here, we unraveled novel functional facets of PknG during latency-like conditions. We found that PknG mediates persistence under stressful conditions like hypoxia and abets drug tolerance. PknG mutant displayed minimal growth in nutrient-limited conditions, suggesting its role in modulating cellular metabolism. Intracellular metabolic profiling revealed that PknG is necessary for efficient metabolic adaptation during hypoxia. Notably, the PknG mutant exhibited a reductive shift in mycothiol redox potential and compromised stress response. Exposure to antibiotics and hypoxic environment resulted in higher oxidative shift in mycothiol redox potential of PknG mutant compared with the wild type. Persistence during latency-like conditions required kinase activity and thioredoxin motifs of PknG and is mediated through phosphorylation of a central metabolic regulator GarA. Finally, using a guinea pig model of infection, we assessed the in vivo role of PknG in manifestation of disease pathology and established a role for PknG in the formation of stable granuloma, hallmark structures of latent tuberculosis. Taken together, PknG-mediated GarA phosphorylation is important for maintenance of both mycobacterial physiology and redox poise, an axis that is dispensable for survival under normoxic conditions but is critical for non-replicating persistence of mycobacteria. In conclusion, we propose that PknG probably acts as a modulator of latency-associated signals.

Keywords: Mycobacterium tuberculosis; hypoxia; mycobacteria; redox signaling; serine/threonine protein kinase; thioredoxin.


Conflict of interest statement

The authors declare that they have no conflicts of interest with the contents of this article

Figures

Figure 1.
Figure 1.
PknG plays a crucial role in subverting host-induced stresses. a, 50 μm CHP was added to log-phase cultures of Rv, RvΔG, and RvΔG::G, and survival was monitored after 24 h. b, early log-phase cultures of Rv, RvΔG, and RvΔG::G were spotted on OADC-7H11 containing 50 μm menadione. cfu obtained in OADC-7H11 plates without menadione was normalized to 100%, and survival on menadione-containing plates was calculated with respect to 100%. c, to assay the sensitivity of M. tuberculosis strains to acidic stress, single cell suspensions of bacterial strains were inoculated in sodium citrate buffer (pH 4.5), and cfu were enumerated on days 0 and 7. d, for surfactant stress, mid-log phase cultures were grown in 7H9 broth containing 0.1% SDS for 3 h. The y axis (percent survival) represents survival of bacterial strains in the presence of SDS/absence of SDS × 100. The data depict mean ± S.D. (error bars) of two independent experiments performed in triplicates (n = 6). **, p < 0.005; ***, p < 0.0005.
Figure 2.
Figure 2.
PknG ameliorates mycobacterial survival during hypoxia. a, to monitor survival of Rv, RvΔG, and RvΔG::G under hypoxic conditions, cultures were inoculated at an initial A600 of 0.1 in 7H9-ADS in sealed tubes and incubated at 37 °C for 20 and 40 days. Establishment of hypoxia was monitored with the help of decolorization of methylene blue. cfu were enumerated on 0, 20, and 40 days. The data indicate representative mean ± S.E. (error bars) of three biologically independent experiments, each performed in triplicates (n = 3). b, 30 μg of WCLs of Rv prepared on days 0, 20, and 40 post-hypoxia were resolved and probed with anti-PknG and anti-GarA antibody. 15 μg of lysates were resolved and stained with Coomassie Blue to show equal loading. Lane 1, marker; lane 2, day 0; lane 3, day 20; lane 4, day 40 post-hypoxia. c, schematic outline of the methodology used for the disruption of pknG in M. smegmatis. d, disruption of pknG at native locus was confirmed by performing PCRs employing gene-specific primers. Genomic DNA from two independent colonies of M. smegmatis (lanes 1 and 2) and MsmΔG (lanes 3 and 4) were used as template. M, 1-kb gene ruler ladder (Thermo Fisher Scientific). e, 35 μg of WCLs prepared from M. smegmatis and MsmΔG were resolved, transferred to nitrocellulose membrane, and probed using anti-PknG (top) and anti-GroEL1 antibodies (bottom). f, M. smegmatis, MsmΔG, and MsmΔG::G strains were inoculated at an initial A600 of 0.1 in 7H9-ADS in sealed tubes and incubated at 37 °C for 5 and 10 days. Survival during hypoxia was monitored by enumerating cfu on days 0, 5, and 10. Data indicate representative mean ± S.E. of three biologically independent experiments, each performed in triplicates (n = 3). **, p < 0.005; ***, p < 0.0005.
Figure 3.
Figure 3.
PknG plays a role in phenotypic drug tolerance. a, log-phase cultures of Rv, RvΔG, and RvΔG::G were inoculated in 7H9-ADS containing 5 μg/ml isoniazid. Survival was monitored at 0 and 7 days. Survival at day 0 was normalized to 100%, and percentage survival at 7 days was calculated with respect to survival at 0 h for each strain. Data are represented as mean percentage survival ± S.D. (error bars) of one of three biologically independent experiments, each performed in triplicates (n = 3). b, log-phase cultures of M. smegmatis, MsmΔG, and MsmΔG::G were inoculated in 7H9-ADS containing 50 μg/ml isoniazid. Survival was monitored at 0 and 48 h. Survival at day 0 was normalized to 100%, and percentage survival at 48 h was calculated with respect to survival at 0 h for each strain. Data are represented as mean percentage survival ± S.D. of one of three biologically independent experiments, each performed in triplicates (n = 3). c, 3 × 10⁵ cells of Rv, RvΔG, and RvΔG::G (equal volume) were spotted onto 7H10-OADC or Dubos-agar medium alone (basal) or supplemented with 50 mm glucose, 25 mm acetate, 50 mm succinate, or 50 mm fumarate. The growth phenotype was analyzed after 4 weeks of incubation, based on the diameter of the viable spot and number of colonies per spot. *, p < 0.05; ***, p < 0.0005.
Figure 4.
Figure 4.
PknG modulates metabolic adaptations during hypoxia. M. smegmatis and MsmΔG were grown in [U-13C]glucose-supplemented Dubos medium for 16 h at 200 rpm (normoxia) or in long sealed conical vessels for 5 days (hypoxia). The intracellular pool of selected metabolites was measured with the help of NMR spectroscopy as described under “Materials and methods,” and results are represented as mean ± S.E. (error bars) of three biologically independent experiments. The y axis represents normalized intensity of metabolites (arbitrary units). The schematic represents glycolytic and TCA cycle intermediates connected by green and purple arrows, respectively. The glyoxylate pathway and anaplerotic reactions are shown with the help of orange and blue arrows, respectively. *, p < 0.05; **, p < 0.005; ***, p < 0.0005.
Figure 5.
Figure 5.
PknG plays a crucial role in maintaining intrabacterial redox state. a, M. smegmatis and M. tuberculosis strains expressing Mrx1-roGFP2 were grown until mid-log phase (A600 of 0.6–0.8) in 7H9-ADS, and ratiometric (405/488 nm) sensor response was analyzed with the help of flow cytometry (32). Bar graphs represent normalized data (see “Materials and methods”). b, to study the impact of PknG on antioxidant capacity of mycobacteria, M. smegmatis and MsmΔG cells were treated with varying concentrations of H2O2 for 2 min, and ratiometric sensor response was measured. -Fold change (y axis) represents the 405/488-nm reading at different concentrations of H2O2/corresponding readings of the untreated cells. c, M. smegmatis strains were treated with 500 μm H2O2, and the sensor reading was measured at the indicated times post-treatment. -Fold change (y axis) represents the 405/488-nm readings at different time points/corresponding readings at 0 min. d and e, 405/488-nm ratio was measured in M. tuberculosis (d) and M. smegmatis (e) strains in the presence or absence of 50 and 5 μg/ml isoniazid, respectively. Isoniazid was added for 2 days or 6 h for M. tuberculosis or M. smegmatis strains, respectively. f and g, the experiment was performed as above but with 10 μg/ml rifampicin (f) and 10 μg/ml clofazimine (g). -Fold change (y axis) in d–g represents the 405/488-nm reading in the presence of antibiotic/corresponding readings of the untreated cells. h, hypoxic cultures of M. smegmatis and MsmΔG expressing Mrx1-roGFP2 were subjected to redox measurements at day 5. Data shown represent mean ± S.E. (error bars) and are representative of three biologically independent experiments each performed at least in duplicates. **, p < 0.005; ***, p < 0.0005.
Figure 6.
Figure 6.
Active kinase and thioredoxin domain of PknG aids in survival of latent mycobacteria. a, schematic showing N terminus rubredoxin domain with two CXXC thioredoxin motifs, a central kinase domain, and C terminus tetratricopeptide domain in PknG. Mutations in kinase-inactive PknG (PknG-K181M) or thioredoxin mutant (PknG-T1T2), wherein cysteine residues were mutated to alanines, are represented. b, survival of different M. smegmatis strains enumerated at 12 days post-hypoxia, represented as cfu log10 ± S.D. (error bars) of one of three independent experiments performed in triplicates (n = 3). Statistical significance was drawn in comparison with MsmΔG by one-way analysis of variance with post hoc Bonferroni test. c, log-phase cultures of M. smegmatis strains were inoculated in 7H9-ADS containing 50 μg/ml isoniazid for 48 h. cfu/ml obtained for each strain at 0 h was normalized to 100%, and percentage survival at 48 h was calculated with respect to survival at 0 h for the corresponding strain. The bar diagram depicts mean percentage survival ± S.D. and is representative for two biologically independent experiments each performed in triplicates. ***, p < 0.0005.
Figure 7.
Figure 7.
GarA is robustly phosphorylated on Thr-21 residue in vivo. a, schematic showing conserved N terminus motif in GarA across various bacteria. Thr-21 and Thr-22 are phosphorylated in vitro by PknG and PknB, respectively. Cg, Corynebacterium glutamicum. b, M. smegmatis transformed with pVV16-GarA (Msm::GarA), pVV16-GarA-T21A (Msm::GarA-T21A), and pVV16-GarA-T22A (Msm::GarA-T22A) was metabolically labeled as described previously (50). C-terminal hexahistidine (His)-tagged GarA and GarA mutant proteins were pulled down using Ni2+-nitrilotriacetic acid affinity beads, resolved on SDS-PAGE, transferred to nitrocellulose membrane, and autoradiographed (top). The membrane was later probed with anti-GarA antibodies (bottom). c, GarA or GarA mutants from 1 mg of whole-cell lysate (WCLs) of Rv electroporated with pVV16-GarA (Rv::GarA), pVV16-GarA-T21A (Rv::GarA-T21A), and pVV16-GarA-T22A (Rv::GarA-T22A) were pulled down using Ni2+-nitrilotriacetic acid affinity beads. Four-fifths of pulldown was probed with anti-pThr antibody (top), and the remaining one-fifth was probed with anti-GarA antibody (bottom). d, schematic outline of the methodology used for the disruption of garA in M. smegmatis. The primers used for PCR amplification are represented by arrows. e, agarose gel showing PCR amplifications using F1-R1 and F2-R2 primers as depicted in d. A PCR amplicon of 1.1 kb with the F1-R1 pair is expected only in M. smegmatis, whereas a 1.2-kb product is expected with the F2-R2 pair only in the MsmΔgarA. f, to confirm GarA knock-out, 25 μg of WCLs prepared from M. smegmatis, MsmΔgarA, and MsmΔgarA::GarA were resolved on 12% SDS-PAGE, transferred onto nitrocellulose membrane, and probed with anti-GarA and anti-GroEL1 antibodies. g, His-tagged GarA or GarA mutants were pulled down from 1 mg of WCLs prepared from different strains. Four-fifths of the pulldown was probed with anti-pThr antibody, and the remaining one-fifth was probed with anti-GarA antibody.
Figure 8.
Figure 8.
PknG ameliorates survival of latent mycobacteria through GarA. a, MsmΔG was electroporated with pVV16-GarA (MsmΔG::GarA), pVV16-GarA-T21A (MsmΔG::GarA-T21A), and pVV16-GarA-T21E (MsmΔG::GarA-T21E), and expression of GarA and GarA mutants was assessed by Western blotting. GarA-His denotes C-terminal tagged GarA expressed from episomal pVV16-GarAwild type/mutant constructs. b, M. smegmatis strains were subjected to hypoxia for 12 days, and survival was enumerated by plating cfu. Data (mean ± S.D.) are representative of three independent experiments. Statistical significance was drawn in comparison with MsmΔG by one-way ANOVA with post-Bonferroni's test. c, exponentially growing M. smegmatis strains were treated with 50 μg/ml isoniazid. cfu was enumerated at 0 and 48 h to calculate percentage survival of the bacilli. The bar graph represents mean ± S.D. (error bars) of two independent experiments performed in triplicates. *, p < 0.05; ***, p < 0.0005.
Figure 9.
Figure 9.
Disruption of PknG attenuates mycobacterium survival and stable granuloma formation in guinea pigs. Shown is survival of M. tuberculosis strains in guinea pigs. a, day 1 cfu of lung homogenates to determine mycobacterial deposition (n = 2). b, bacillary load in lungs of guinea pigs infected with M. tuberculosis strains at 4 and 8 weeks p.i. (n = 6). At 4 weeks p.i., mean cfu for Rv, RvΔG, and RvΔG::G in lungs were 4.95, 4.00, and 4.54 on log10 scale, respectively. At 8 weeks p.i., mean cfu for Rv, RvΔG, and RvΔG::G in lungs were 5.05, 4.55, and 4.83 on log10 scale, respectively. c and d, survival of M. tuberculosis strains inside spleen of guinea pigs at 4 weeks (c) and 8 weeks (d) p.i. At 4 weeks p.i., mean cfu for Rv, RvΔG, and RvΔG::G in the spleen were 4.29, 3.47, and 4.02 on log10 scale, respectively. At 8 weeks p.i., mean cfu for Rv, RvΔG, and RvΔG::G in the spleen were 4.46, 3.94, and 4.19 on log10 scale, respectively. Each data point in a–d represents log10 cfu of an infected animal in individual organs, and error bars depict S.D. for each group. Statistical significance was drawn in comparison with RvΔG. Lungs of infected animals euthanized at 4 weeks (e) and 8 weeks (f) p.i. were stained with H&E and photomicrographed to analyze total granuloma score. Shown is the total granuloma score (mean ± S.E.) in H&E-stained lung sections of animals infected with M. tuberculosis strains at 4 weeks (e) and 8 weeks (f) p.i. Each data point represents the granuloma score of an individual animal (n = 6). G, granuloma; N, necrosis; EC, epithelioid cells; AS, alveolar space. g, total granuloma scores (mean ± S.E.) in H&E-stained spleen sections of animals infected with M. tuberculosis strains at 4 weeks p.i. Each data point represents the granuloma score of an individual animal (n = 6). G, granuloma; WP, white pulp; RP, red pulp. *, p < 0.05; **, p < 0.005; ***, p < 0.0005.
Figure 10.
Figure 10.
Model depicting the proposed role of PknG in latency. The two most commonly used in vitro models of latency are hypoxia and persisters (24). The depicted structure of PknG was adapted from Sherr et al. (12). Oxygen depletion in cells renders them drug-tolerant (23), indicated by the two-way arrow. Upon oxygen limitation, the NADH/NAD+ ratio increases (6), which has been shown to enhance PknG expression (16). Antibiotic exposure may similarly enhance expression or activity of PknG. Recently, amino acids such as glutamate and aspartate have been shown to induce PknG activity (14). In wild-type mycobacteria (Rv/Msm), PknG combats oxidative, acidic, nitrosative, and surfactant stress and hence may act as a “stress regulator” (this study). PknG-mediated phosphorylation of GarA at Thr-21 results in derepression of the TCA cycle (15). PknG, most importantly, regulates precarious redox homeostasis both in hypoxic and antibiotic-treated cells (this study). Redox balance may be aided by modulation of the TCA cycle (shown by a dotted arrow) or through the L13-RenU axis (16) previously shown to maintain NADH levels. Taken together, PknG helps mycobacteria remodel metabolism in response to latency-like conditions resulting in the survival of mycobacteria.

Similar articles

Cited by

References

    1. McDermott W. (1959) Inapparent infection: relation of latent and dormant infections to microbial persistence. Public Health Rep. 74, 485–499 - PMC - PubMed
    1. Davis J. M., and Ramakrishnan L. (2009) The role of the granuloma in expansion and dissemination of early tuberculous infection. Cell 136, 37–49 - PMC - PubMed
    1. Wayne L. G., and Lin K. Y. (1982) Glyoxylate metabolism and adaptation of Mycobacterium tuberculosis to survival under anaerobic conditions. Infect. Immun. 37, 1042–1049 - PMC - PubMed
    1. Wayne L. G. (1976) Dynamics of submerged growth of Mycobacterium tuberculosis under aerobic and microaerophilic conditions. Am. Rev. Respir. Dis. 114, 807–811 - PubMed
    1. Wayne L. G., and Diaz G. A. (1967) Autolysis and secondary growth of Mycobacterium tuberculosis in submerged culture. J. Bacteriol. 93, 1374–1381 - PMC - PubMed

MeSH terms

Substances

LinkOut - more resources