. 2017 Sep 20;37(38):9320-9331.
doi: 10.1523/JNEUROSCI.0544-17.2017. Epub 2017 Aug 16.

Location of the Mesopontine Neurons Responsible for Maintenance of Anesthetic Loss of Consciousness

Affiliations

Location of the Mesopontine Neurons Responsible for Maintenance of Anesthetic Loss of Consciousness

Anne Minert et al. J Neurosci. .

Abstract

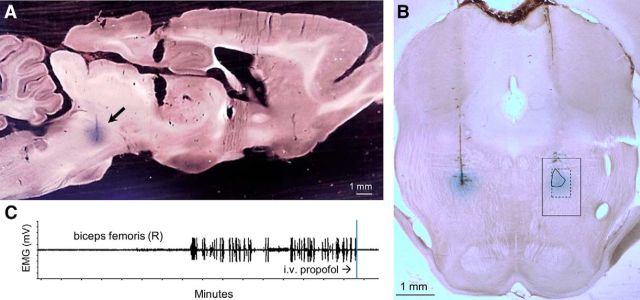
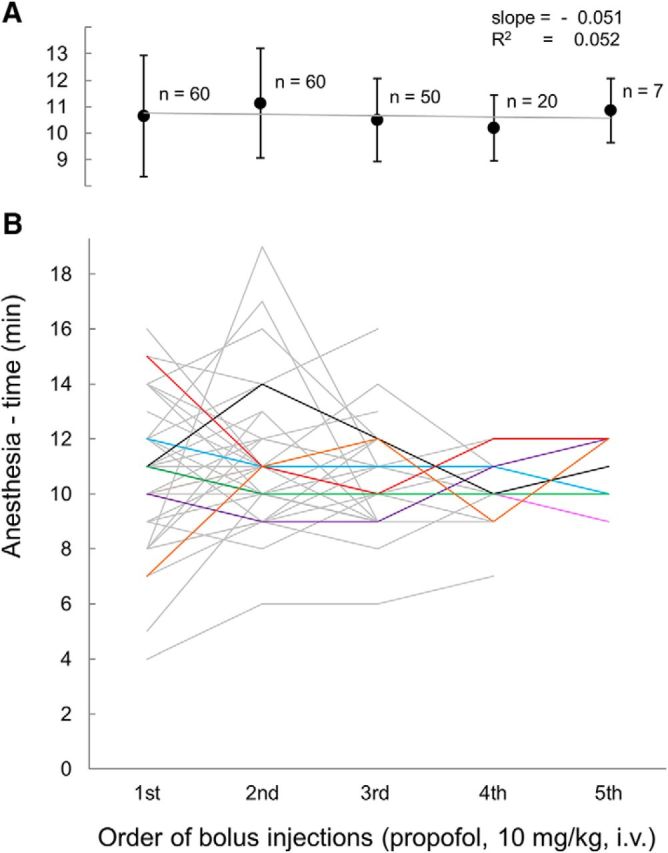
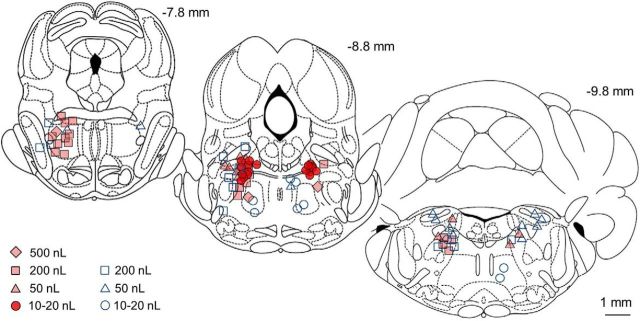
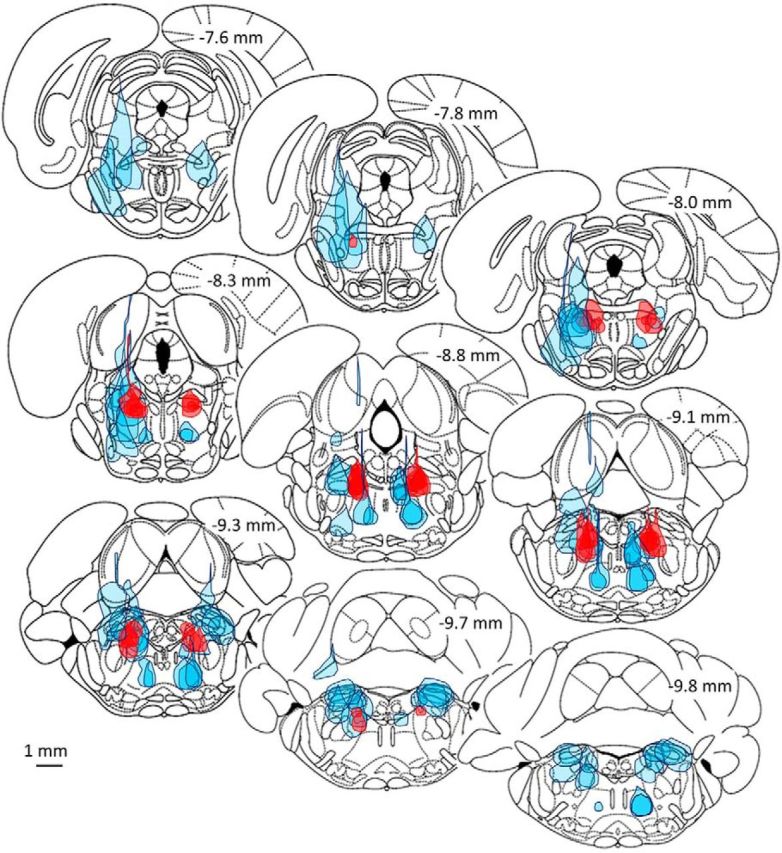
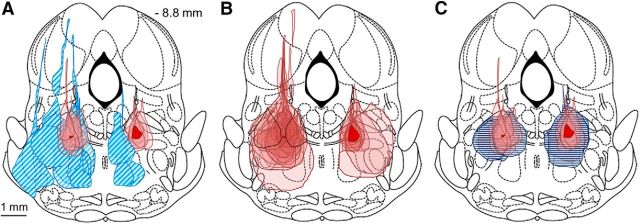
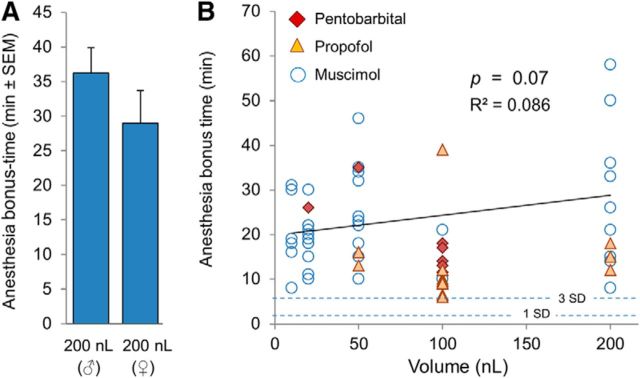
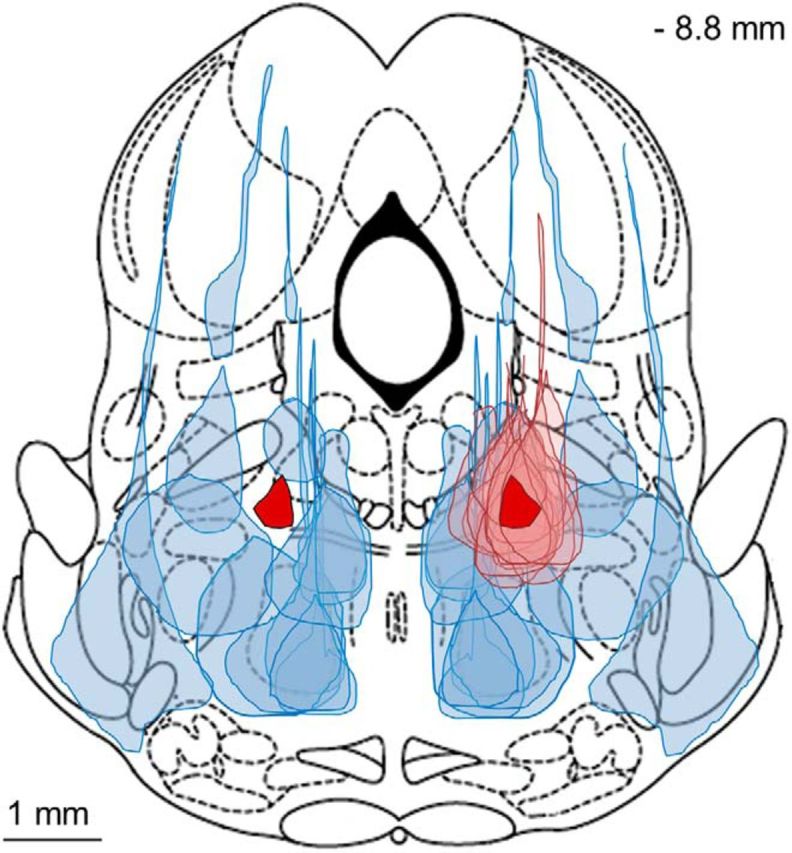
The transition from wakefulness to general anesthesia is widely attributed to suppressive actions of anesthetic molecules distributed by the systemic circulation to the cerebral cortex (for amnesia and loss of consciousness) and to the spinal cord (for atonia and antinociception). An alternative hypothesis proposes that anesthetics act on one or more brainstem or diencephalic nuclei, with suppression of cortex and spinal cord mediated by dedicated axonal pathways. Previously, we documented induction of an anesthesia-like state in rats by microinjection of small amounts of GABAA-receptor agonists into an upper brainstem region named the mesopontine tegmental anesthesia area (MPTA). Correspondingly, lesioning this area rendered animals resistant to systemically delivered anesthetics. Here, using rats of both sexes, we applied a modified microinjection method that permitted localization of the anesthetic-sensitive neurons with much improved spatial resolution. Microinjected at the MPTA hotspot identified, exposure of 1900 or fewer neurons to muscimol was sufficient to sustain whole-body general anesthesia; microinjection as little as 0.5 mm off-target did not. The GABAergic anesthetics pentobarbital and propofol were also effective. The GABA-sensitive cell cluster is centered on a tegmental (reticular) field traversed by fibers of the superior cerebellar peduncle. It has no specific nuclear designation and has not previously been implicated in brain-state transitions.SIGNIFICANCE STATEMENT General anesthesia permits pain-free surgery. Furthermore, because anesthetic agents have the unique ability to reversibly switch the brain from wakefulness to a state of unconsciousness, knowing how and where they work is a potential route to unraveling the neural mechanisms that underlie awareness itself. Using a novel method, we have located a small, and apparently one of a kind, cluster of neurons in the mesopontine tegmentum that are capable of effecting brain-state switching when exposed to GABAA-receptor agonists. This action appears to be mediated by a network of dedicated axonal pathways that project directly and/or indirectly to nearby arousal nuclei of the brainstem and to more distant targets in the forebrain and spinal cord.

Keywords: MPTA; anesthesia; arousal; reticular formation; syncope; wet blanket hypothesis.


Figures

Figure 1.
Figure 1.
Microinjections of muscimol into the MPTA. A, Sagittal section showing the dye spread associated with a microinjection of 200 nL of muscimol into the MPTA. B, Coronal section showing the dye spread associated with on-target muscimol microinjections of 20 nL, first on the left, then 20 min later on the right (rat #340). These trials yielded bonus times of 10 and 21 min, respectively. The boundaries of the MPTA as defined by Devor and Zalkind (2001) are overlaid on the right-sided microinjection (1000 × 1500 μm, solid outline). The common core of the MPTA is shown within the 500 × 750 μm dashed frame. C, The sudden appearance of repetitive hindlimb “pacing” movements was accompanied by rhythmic bursts in the biceps femoris electromyogram. Both were silenced by the standard intravenous bolus of propofol.
Figure 2.
Figure 2.
Anesthesia time was independent of the number of antecedent propofol boluses given. A, In rats given 2 (n = 60), 3 (n = 50), 4 (n = 20), or 5 (n = 7) consecutive bolus doses of propofol mean anesthesia time was the same on the first bolus as on the nth. B, Lines represent anesthesia times of 60 individual rats upon repeated bolus dosing (all at HUJI). To ease separation, lines representing the seven rats given five consecutive doses are colored. Error bars in A indicate ±SD.
Figure 3.
Figure 3.
Small volume muscimol microinjections (10–20 nL) locate the hotspot for anesthetic induction within the MPTA area. Symbols mark centers of the microinjections listed in Table 1, with the volume microinjected indicated for each symbol. Filled symbols indicate trials that yielded a significant bonus time; open symbols indicate bonus times that were not significant. Numbers above the coronal sections indicate the section's location caudal to bregma (in millimeters; outlines from Paxinos and Watson, 1998). Microinjections that fell on planes −7.0 to −8.0 are gathered on the most rostral section outline (−7.8 mm), those on planes −8.0 to −9.16 are gathered on the middle section (−8.8 mm), and those that fell on planes −9.3 to −10.8 are gathered on the caudal section (−9.8 mm). Many effective microinjections overlap, especially in the dark (red) clusters.
Figure 4.
Figure 4.
Ineffective microinjections of muscimol surround the cluster of effective microinjections in all three planes. The full extent of dye spread is shown in red (dark fill) for the 17 small volume microinjections (10 or 20 nL) that yielded a significant bonus time. Dye spread of all of the ineffective microinjections represented at these levels (−7.6 to −9.8 mm, n = 28 in 18 rats), including large and small volume trials (10–500 nL), are shown in light blue fill.
Figure 5.
Figure 5.
Location of the MPTA common core. AC, Maximal cross-sectional area of effective (solid pink) and noneffective (hatched blue) microinjections are collected onto a single rostrocaudal plane (−8.8 mm). The track of the injection pipette in these trials actually lay over the range of −8.0 to −9.16 mm caudal to bregma. A, Dye spread for the 17 small effective muscimol microinjections largely overlap (10 or 20 nL, 9 rats, 10 on the left and 7 on the right). The region in common to all (intersection), on the right and on the left, is shown in solid red (dark). The term “common core” refers to this area on the right. Noneffective microinjections (10–200 nL) surround the effective ones (14 microinjections in 12 rats). B, As in A, but showing areas of both large and small effective muscimol microinjections (24 left, 11 right in 23 rats). Noneffective trials are not shown. The solid red area on the right is common to all 11 microinjections on that side. The (smaller) solid red area on the left is common to 22 of the 24 left-sided microinjections. Dye spread areas of the two microinjections not included fell closely nearby (black outlines, rats #322 and #15, 50 and 200 nL, respectively). C, Dye spread areas of 10 saline (control) microinjections (5 rats; 50–200 nL; horizontal dark blue lines) overlapped the common core zone bilaterally (5 left, 5 right). None of these yielded a significant bonus time.
Figure 6.
Figure 6.
A, Average of the significant bonus times was the same (p = 0.24) at the two experimental venues (left: BIDMC, male Sprague Dawley rats; right: HUJI, female Wistar-derived Sabra rats). B, Anesthesia bonus time did not correlate significantly with the volume (and thus dose) of muscimol microinjected (open circles; 39 trials in which there was a significant bonus; R2 = 0.086, p = 0.07). The regression line for this relation is shown. Also shown are bonus times obtained for on-target microinjections of pentobarbital (7 trials in 6 rats, filled diamonds) and propofol (12 trials in 9 rats, filled triangles). The regression of all bonus times on volume microinjected also failed to reach statistical significance (R2 = 0.011, p = 0.43). All data shown were from experiments performed at HUJI. Horizontal dashed lines indicate the degree of variability of anesthesia times obtained using the standard bolus dose of propofol in trials in which there was no drug microinjection (+1 SD = 2.0 min; +3 SDs = 6.1 min).
Figure 7.
Figure 7.
Sizes and shapes of neurons populating the MPTA common core are heterogeneous. A total of 1198 neurons were measured bilaterally in four naive rats. A, Histogram showing somatic area. B, Photomicrograph showing a typical field of NeuN-immunolabeled neurons, includes one neuron that is exceptionally larger (arrow). CE, Histograms showing the distribution of three shape parameters in the population of neurons shown in A. These were as follows: aspect ratio (a measure of flatness and radial symmetry), form factor (a measure of the complexity of the somatic perimeter), and roundness.
Figure 8.
Figure 8.
Graphical illustration of the MPTA common core and mMPTA. Left, Noneffective microinjections from the right side of Figure 5A are mirror transposed and plotted together with noneffective microinjections actually made on the left side in Figure 5A (light blue shading). These contours surround the transposed MPTA common core (Fig. 5A, right). Note the nonshaded halo surrounding the common core that is devoid of failed microinjections. Right, Dye spread areas of noneffective microinjections of all volumes (light blue shading) have been mirror transposed and combined with all of the effective small volume microinjections (10–20 nL; Fig. 5A, both sides, pink fill). The union of these pink contours is the mMPTA. The successful microinjections (pink) are surrounded on all sides by failed microinjections (blue). For clarity, the two negative trials noted in the Results that included the common core, whereas indicated on the right side in this illustration, are absent on the left.

Similar articles

Cited by

References

    1. Abulafia R, Zalkind V, Devor M (2009) Cerebral activity during the anesthesia-like state induced by mesopontine microinjection of pentobarbital. J Neurosci 29:7053–7064. 10.1523/JNEUROSCI.1357-08.2009 - DOI - PMC - PubMed
    1. Alkire MT, Hudetz AG, Tononi G (2008) Consciousness and anesthesia. Science 322:876–880. 10.1126/science.1149213 - DOI - PMC - PubMed
    1. Anaclet C, Ferrari L, Arrigoni E, Bass CE, Saper CB, Lu J, Fuller PM (2014) The GABAergic parafacial zone is a medullary slow wave sleep-promoting center. Nat Neurosci 17:1217–1224. 10.1038/nn.3789 - DOI - PMC - PubMed
    1. Antognini JF, Carstens E, Raines DE, eds (2003) Neural mechanisms of anesthesia. Totowa, NJ: Human Press.
    1. Baker R, Gent TC, Yang Q, Parker S, Vyssotski AL, Wisden W, Brickley SG, Franks NP (2014) Altered activity in the central medial thalamus precedes changes in the neocortex during transitions into both sleep and propofol anesthesia. J Neurosci 34:13326–13335. 10.1523/JNEUROSCI.1519-14.2014 - DOI - PMC - PubMed

Publication types