. 2017 Sep 13;37(37):8919-8928.
doi: 10.1523/JNEUROSCI.0829-17.2017. Epub 2017 Aug 11.

Visual Receptive Field Heterogeneity and Functional Connectivity of Adjacent Neurons in Primate Frontoparietal Association Cortices

Affiliations

Visual Receptive Field Heterogeneity and Functional Connectivity of Adjacent Neurons in Primate Frontoparietal Association Cortices

Pooja Viswanathan et al. J Neurosci. .

Abstract

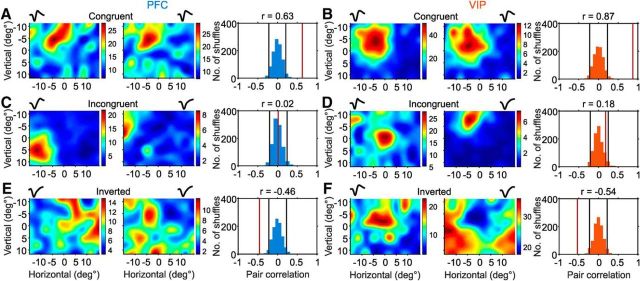
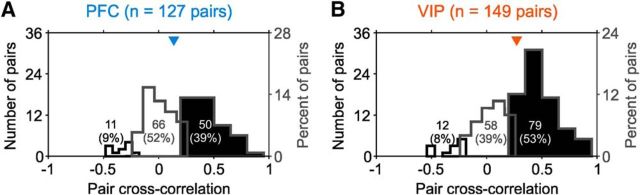
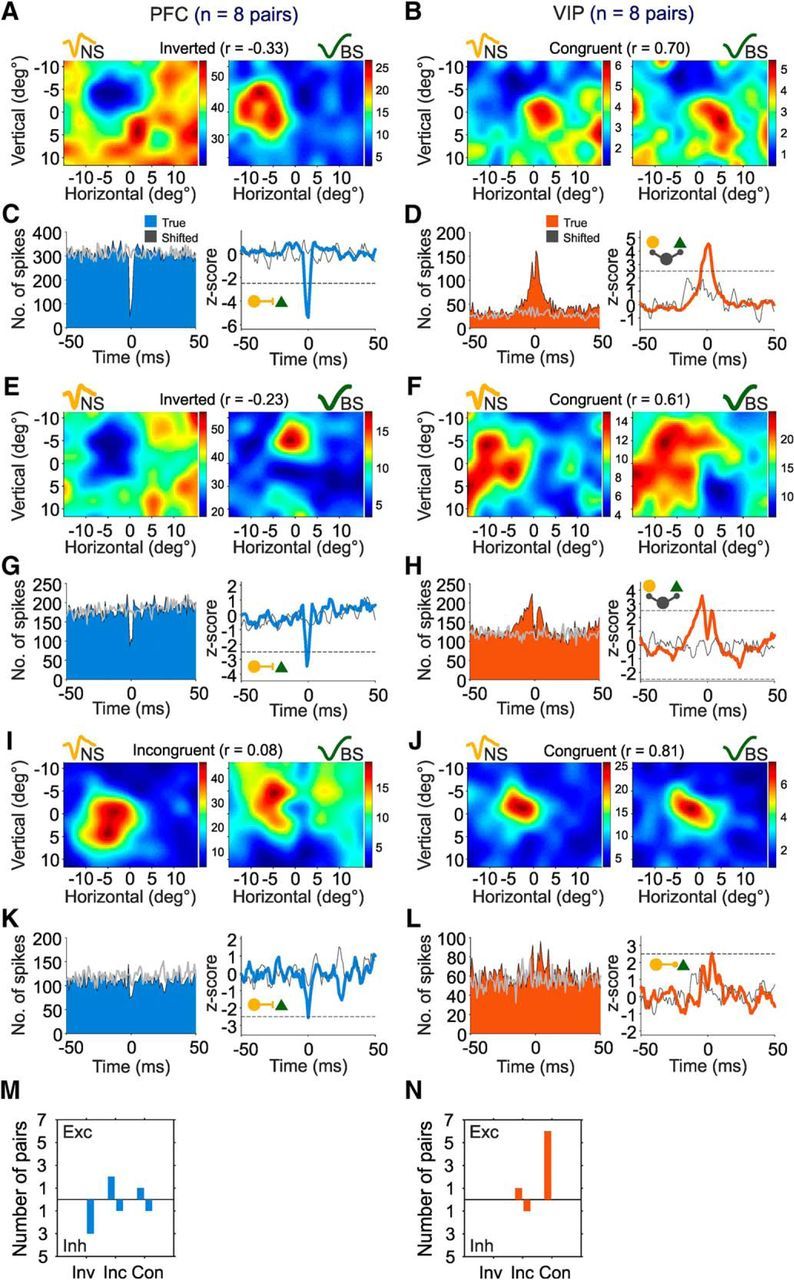
The basic organization principles of the primary visual cortex (V1) are commonly assumed to also hold in the association cortex such that neurons within a cortical column share functional connectivity patterns and represent the same region of the visual field. We mapped the visual receptive fields (RFs) of neurons recorded at the same electrode in the ventral intraparietal area (VIP) and the lateral prefrontal cortex (PFC) of rhesus monkeys. We report that the spatial characteristics of visual RFs between adjacent neurons differed considerably, with increasing heterogeneity from VIP to PFC. In addition to RF incongruences, we found differential functional connectivity between putative inhibitory interneurons and pyramidal cells in PFC and VIP. These findings suggest that local RF topography vanishes with hierarchical distance from visual cortical input and argue for increasingly modified functional microcircuits in noncanonical association cortices that contrast V1.SIGNIFICANCE STATEMENT Our visual field is thought to be represented faithfully by the early visual brain areas; all the information from a certain region of the visual field is conveyed to neurons situated close together within a functionally defined cortical column. We examined this principle in the association areas, PFC, and ventral intraparietal area of rhesus monkeys and found that adjacent neurons represent markedly different areas of the visual field. This is the first demonstration of such noncanonical organization of these brain areas.

Keywords: functional connectivity; prefrontal cortex; single-unit recordings; ventral intraparietal.


Figures

Figure 1.
Figure 1.
RF mapping in PFC and VIP. A, Passive fixation task. Monkeys fixated a central fixation target while a bar (3° × 0.20°) moving in four directions appeared in five successive locations on the screen. The visual field on the screen was divided into a grid of 80 locations (10 × 8) sampled over 16 trials/cycle. B, Lateral view (left) of a macaque monkey brain and a sagittal section (right) of the intraparietal sulcus at the position indicated by the dotted line. Positions of recording sites in the dorsolateral PFC (cyan) and the VIP (orange) in the depth of the sulcus are shown. ps, Principal sulcus; ls, lateral sulcus; ips, intraparietal sulcus; sts, superior temporal sulcus.
Figure 2.
Figure 2.
Example neurons with RFs. A, Raster plot of an example spatially selective PFC neuron recorded in Monkey S. Each of the 80 locations is represented by a subplot, within which the dots along each line indicate the action potentials elicited for each trial. B, Peristimulus time histogram for the same neuron as in A. Each location is again represented by a subplot where the colored line indicates the trial-averaged response of the neuron in time. C, Averaged and smoothed high-resolution RF map (“heat map”) for the neuron. Colors represent the firing rates across the measured visual field. D–F, The same plots as A–C for an example neuron recorded in VIP from Monkey L. Enlarged bottom left squares represent the scale of each subplot of A, B, D, and E. The moving bar moved in four different directions within each position of the grid.
Figure 3.
Figure 3.
RFs of neuron pairs recorded on the same electrode. Left, PFC neuron pairs. Right, VIP neuron pairs. A, Example of PFC neuron pair recorded in Monkey L whose RF maps (left) were classified as congruent based on their 2D correlation coefficient, r (right). The normalized averaged waveforms of these neurons are in miniature above the RF maps. Histogram of correlation coefficients obtained from shuffling the raw RF maps 1000 times and calculating the 2D correlation coefficient 1000 times. Black vertical lines indicate the 2.5th and 97.5th percentiles of the shuffled distribution. Red line indicates the true correlation coefficient obtained from the true RF maps, also stated above the histogram. As the true correlation coefficient is >97.5th percentile of the data (two-tailed, p < 0.05), the neuron pair was judged to have congruent RFs. B, Example congruent pair from VIP. C, D, Example of an incongruent pair from each area with their corresponding correlation coefficient. Here, the true correlation coefficient lay within 2.5th and 97.5th percentiles of the shuffled distribution. E, F, Example of an inverted pair from each area. Here, the true correlations were <2.5th percentile of the surrogate distribution and were negative. B–F, The neuron pairs were recorded from Monkey S.
Figure 4.
Figure 4.
Heterogeneity of RFs of adjacent neurons. A, Frequency distributions of inverted (white histograms with black outline), incongruent (white histograms with gray outline), and congruent neuron pairs (black histograms) from PFC. Overlaid numbers indicate the total number and percentage of pairs contained in the histograms. Colored triangles represent the medians of all the correlation coefficients. B, Frequency distribution of the similarity for VIP neuron pairs. The population of recorded neuron pairs in VIP had a higher correlation coefficient than PFC (Mann–Whitney U test, p < 0.05). PFC had a significantly higher frequency of incongruent pairs than congruent pairs (χ2 = 5.33, p < 0.05) compared with VIP.
Figure 5.
Figure 5.
Classification of neuron types according to spike waveform characteristics. A, Spike waveforms of 50 randomly chosen NS neurons (yellow) and BS neurons (green), aligned to their troughs. The mean waveforms of all NS and BS neurons are plotted in black. B, Distribution of spike widths for all NS and BS neurons. Black vertical lines indicate the widths of the average waveforms in each class. C, Histogram of 1086 PFC spike widths colored according to the classification into NS and BS classes with 50 randomly selected PFC waveforms of each class in the inset. The means of all PFC NS and BS neurons are plotted in black. Scale is the same as in A. D, Histogram of 865 VIP spike widths colored by class with 50 randomly chosen VIP waveforms of each class in the inset as in C. E, Distribution of RF similarity. Three classes of neuron pairs in PFC: Inv, Inverted; Inc, incongruent; Con, congruent. Yellow represents NS-NS pairs. Blue represents NS-BS pairs. Green represents BS-BS. F, Same distribution as E for neuron pairs recorded in VIP.
Figure 6.
Figure 6.
Distinct connectivity of BS-BS pairs in PFC and VIP. A, Example of a BS-BS pair with congruent RFs recorded from the same electrode in PFC. Top, Example waveforms illustrate the cell classes. The neuron used as the trigger to produce the cross-correlogram is presented on the left of each panel. B, An example BS-BS pair from the VIP with congruent RFs. C, Left, Raw cross-correlogram of the neuron pair in color. Gray represents the shifted cross-correlogram. The cross-correlogram shows the distribution of spike times measured in neuron from A (right) to each spike in A (left). The shifted cross-correlogram shows the distribution of spike times measured in the subsequent trial. Right, z scores obtained from the raw and shifted correlograms, smoothed with a 3 ms boxcar. Dashed line indicates the significance threshold. Here, the BS neuron in A (left, top) inhibits the other BS neuron (right, top) as denoted by the green triangles linked by an inhibitory connection from left to right. D, Cross-correlogram for the neuron pair presented in B. Here, the BS neuron on the right is exciting the BS neuron on the left as the peak has a negative lag. E, An example of an incongruent BS-BS pair from PFC. F, Example pair from VIP with inverted RFs. G, Cross-correlograms of pair depicted in E. H, Cross-correlogram of pair in F. Example pair A is from Monkey L and the rest from Monkey S. Putative connection diagrams are shown on each correlogram. I, Summary plot of excitatory (Exc) and inhibitory (Inh) connections and the similarity index of the resultant RFs in PFC. Inv, Inverted; Inc, incongruent; Con, congruent. J, Corresponding plot for RFs in VIP.
Figure 7.
Figure 7.
Distinct connectivity of NS-BS pairs in PFC and VIP. A, Example of an NS-BS pair with inverted RFs recorded from the same electrode in PFC. Same layout as in Figure 5A, B. B, An example NS-BS pair with congruent RFs from the VIP. C, Raw cross-correlogram of the neuron pair from A (left) and z scores obtained from the correlogram in color. Gray represents the shifted correlogram. Same layout as in Figure 5C, D. Here, the NS neuron in A (left, above) depicted with a yellow circle inhibits the BS neuron (right, above) shown as a green triangle. D, Raw cross-correlogram (left) and z scores of the neuron pair from B. Here, the NS neuron and BS neuron show a broad peak ∼0 ms, indicating the presence of common excitatory input. E, Example NS-BS pair with inverted RFs from PFC. F, Example pair from VIP with congruent RFs. G, Raw cross-correlogram (left) and z scores of the neuron pair from E. H, Raw cross-correlogram (left) and z scores of the neuron pair from F. I, Example PFC pair with incongruent RFs. J, Example VIP pair with congruent RFs. K, L, Raw cross-correlogram and z scores of the neuron pairs from I and J. Example pairs A, B, E, and J are from Monkey L; and example pairs F and I are from Monkey S. Putative connection diagrams are shown on each correlogram. M, N, Summary plot of excitatory (Exc) and inhibitory (Inh) connections and RF similarity in PFC and VIP, respectively. Inv, Inverted; Inc, incongruent; Con, congruent.

Similar articles

Cited by

References

    1. Aertsen AM, Gerstein GL, Habib MK, Palm G (1989) Dynamics of neuronal firing correlation: modulation of “effective connectivity.” J Neurophysiol 61:900–917. - PubMed
    1. Avillac M, Denève S, Olivier E, Pouget A, Duhamel JR (2005) Reference frames for representing visual and tactile locations in parietal cortex. Nat Neurosci 8:941–949. 10.1038/nn1480 - DOI - PubMed
    1. Avillac M, Ben Hamed S, Duhamel JR (2007) Multisensory integration in the ventral intraparietal area of the macaque monkey. J Neurosci 27:1922–1932. 10.1523/JNEUROSCI.2646-06.2007 - DOI - PMC - PubMed
    1. Chen X, DeAngelis GC, Angelaki DE (2014) Eye-centered visual receptive fields in the ventral intraparietal area. J Neurophysiol 112:353–361. 10.1152/jn.00057.2014 - DOI - PMC - PubMed
    1. Colby CL, Duhamel JR, Goldberg ME (1993) Ventral intraparietal area of the macaque: anatomic location and visual response properties. J Neurophysiol 69:902–914. - PubMed

Publication types

LinkOut - more resources