. 2017 Sep 13;37(37):8863-8875.
doi: 10.1523/JNEUROSCI.1181-17.2017. Epub 2017 Aug 8.

Learning and Stress Shape the Reward Response Patterns of Serotonin Neurons

Affiliations

Learning and Stress Shape the Reward Response Patterns of Serotonin Neurons

Weixin Zhong et al. J Neurosci. .

Abstract

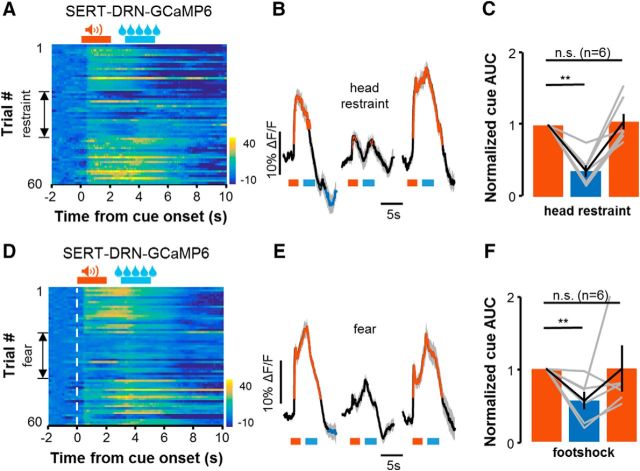
The ability to predict reward promotes animal survival. Both dopamine neurons in the ventral tegmental area and serotonin neurons in the dorsal raphe nucleus (DRN) participate in reward processing. Although the learning effects on dopamine neurons have been extensively characterized, it remains largely unknown how the response of serotonin neurons evolves during learning. Moreover, although stress is known to strongly influence reward-related behavior, we know very little about how stress modulates neuronal reward responses. By monitoring Ca2+ signals during the entire process of Pavlovian conditioning, we here show that learning differentially shapes the response patterns of serotonin neurons and dopamine neurons in mice of either sex. Serotonin neurons gradually develop a slow ramp-up response to the reward-predicting cue, and ultimately remain responsive to the reward, whereas dopamine neurons increase their response to the cue but reduce their response to the reward. For both neuron types, the responses to the cue and the reward depend on reward value, are reversible when the reward is omitted, and are rapidly reinstated by restoring the reward. We also found that stressors including head restraint and fearful context substantially reduce the response strength of both neuron types, to both the cue and the reward. These results reveal the dynamic nature of the reward responses, support the hypothesis that DRN serotonin neurons signal the current likelihood of receiving a net benefit, and suggest that the inhibitory effect of stress on the reward responses of serotonin neurons and dopamine neurons may contribute to stress-induced anhedonia.SIGNIFICANCE STATEMENT Both serotonin neurons in the dorsal raphe and dopamine neurons in the ventral tegmental area are intimately involved in reward processing. Using long-term fiber photometry of Ca2+ signals from freely behaving mice, we here show that learning produces a ramp-up activation pattern in serotonin neurons that differs from that in dopamine neurons, indicating complementary roles for these two neuron types in reward processing. Moreover, stress treatment substantially reduces the reward responses of both serotonin neurons and dopamine neurons, suggesting a possible physiological basis for stress-induced anhedonia.

Keywords: Pavlovian conditioning; fiber photometry; learning; stress-induced anhedonia; stressors; sucrose.


Figures

Figure 1.
Figure 1.
Appetitive Pavlovian conditioning differentially shapes the response patterns of DRN serotonin neurons and VTA dopamine neurons. A, The design of the cue–reward classical conditioning task. An auditory tone (2 s) was repetitively paired with sucrose delivery (0.5 s) after a 1 s delay. Each daily session consisted of 100 trials, and each mouse completed four or six sessions. B, Fiber photometry of Ca2+ signals from freely behaving mice engaged in the classical conditioning task. We infused sucrose solution into the oral cavity through cheek fistula as indicated in the schematic. We implanted an optical fiber into the DRN to simultaneously record changes in GCaMP6 fluorescence using fiber photometry. C, Expression of GCaMP6 (Green) in TPH2-immunopositive neurons (red) in the DRN of a SERT-DRN-GCaMP6 mouse. D, Raw traces showing the behavior events of the tone (black), sucrose delivery (blue), and GCaMP6 signals (green) during the conditioning session of day 1 (d1) and day 6 (d6) from a SERT-DRN-GCaMP6 mouse. E, Heatmaps illustrating the GCaMP changes (ΔF/F, %) of DRN serotonin neurons across six daily classical conditioning sessions from a SERT-DRN-GCaMP6 mouse. F, Peri-event plots of the average Ca2+ signals. G, The intensity of the Ca2+ signal during the anticipatory phase of DRN serotonin neurons gradually increased as the number of conditioning sessions increased. We measured the area under the peri-event curve (AUC) between cue onset (0 s) and sucrose delivery (3 s) to represent the response strength in the reward anticipatory phase. H, The response to sucrose remained relatively unchanged over time. Within each session, the peak response intensity following sucrose delivery (3–5 s) was normalized to the sucrose response intensities of the initial 50 trials of the conditioning. I, Heatmaps illustrating the GCaMP changes of VTA dopamine neurons during six daily classical conditioning sessions from a DAT-VTA-GCaMP6 mouse. J, Peri-event plots of the average intensity of Ca2+ signals of dopamine neurons. K, L, The response strength of VTA dopamine neurons to the tone onset (K) and sucrose delivery (L) across conditioning sessions (see Figs. 1-1 and 1-2, respectively). Shaded areas in FH and JL indicate SEM (FH, n = 14 SERT-DRN-GCaMP6 mice; JL, n = 9 DAT-VTA-GCaMP6 mice). F, G, JL, Red and blue colors superimposed on the black line indicate significant increases and decreases from the baseline, respectively (F, J, p < 0.001; G, H, K, L, p < 0.05, multivariate permutation tests).
Figure 2.
Figure 2.
The effects of reward omission and reinstatement on the responses of serotonin neurons and dopamine neurons. A, A heatmap showing the Ca2+ signals of DRN serotonin neurons in a mouse challenged with reward omission. We presented the CS for all of the trials, but omitted US during trials 51–150. B, The effect of reward omission on the activity of serotonin neurons during the anticipatory phase (n = 7 SERT-DRN-GCaMP6 mice). Each point in the line plot represents the average value of the normalized area under the curve (AUC) between cue onset (0 s) and sucrose delivery (3 s) for 10 trials. C, The effect of reward omission on the activity of serotonin neurons during the reward consumption phase (n = 7 SERT-DRN-GCaMP6 mice). DF, The effect of reward omission on the activity of VTA dopamine neurons (n = 9 DAT-VTA-GCaMP6 mice). We defined response strength in E and F as the peak value normalized to the average peak value of the initial 50 trials during the first session. Shaded areas in B, C, E, and F indicate SEM. Red and blue colors in B, C, E, and F indicate significant increases and decreases from the baseline, respectively (p < 0.05, multivariate permutation test).
Figure 3.
Figure 3.
The effects of reward values on the responses of serotonin neurons and dopamine neurons. AC, The effects of adding quinine on the sucrose-evoked Ca2+ signal intensity of DRN serotonin neurons. The heatmap in A illustrates the Ca2+ signals from a mouse across all trials. The sucrose concentration was held at 5% for 60 trials; quinine (10 mm) was added during trials 21–40. The peri-event plots in B show the average Ca2+ signals to sucrose from the animal shown in A before, during, and after the quinine trials. Data are aligned to pump onset for liquid delivery. Population-level data in C show the effect of mixing quinine with sucrose on the response of DRN serotonin neurons (n = 6 SERT-DRN-GCaMP6 mice). Response amplitudes were normalized to those before quinine addition for each individual mouse. DF, Heatmap representation (D) and peri-event plot of Ca2+ signals (E) from a representative mouse and population data (F, n = 7 DAT-VTA-GCaMP6 mice) showing the effects of adding quinine on the sucrose response of VTA dopamine neurons. G, Heatmaps illustrating the GCaMP changes (ΔF/F, %) of DRN serotonin neurons to small (left) and large (right) rewards from a SERT-DRN-GCaMP6 mouse during the day 6 conditioning session. The trials of the two reward sizes were intermixed in pseudorandom order and sorted for illustration purposes. H, Peri-event plots of the average Ca2+ signals of DRN serotonin neurons to the small (black) and large (red) rewards. (n = 8 SERT-DRN-GCaMP6 mice). I, J, Heatmaps (I) and average Ca2+ signals of VTA dopamine neurons (J) during the day 6 conditioning session (n = 7 DAT-VTA-GCaMP6 mice). Error bars in C and F indicate SEM. *p < 0.05; **p < 0.01; ***p < 0.001; n.s., not significant; multiple comparisons after repeated-measures one-way ANOVA. Shaded areas in B, E, H, and J indicate SEM. Red and blue colors in B and E indicate significant increases and decreases from the baseline, respectively (p < 0.05, multivariate permutation tests). See Figures 3-1, 3-2, and 3-3, respectively.
Figure 4.
Figure 4.
Acute stress decreases the reward response intensity of DRN serotonin neurons. A, A heatmap showing the effect of acutely restraining on the Ca2+ signal intensity of DRN serotonin neurons. The same amount of sucrose was delivered for 60 trials, and the mouse was head-restrained during trials 21–40. B, Peri-event plot of the average Ca2+ signals to sucrose from the animal shown in A before, during, and after the trials with head restraint. Data are aligned to pump onset for liquid delivery. C, Population-level data showing the effect of head restraint on the response of DRN serotonin neurons (n = 7 SERT-DRN-GCaMP6 mice). Response amplitudes were normalized to those before head restraint for each individual mouse. DF, The effects of a fearful context on the sucrose response of DRN serotonin neurons (n = 11 SERT-DRN-GCaMP6 mice). A total of 60 trials were recorded. After initial 20 trials of recording, a mouse was moved to a new chamber and given five random footshocks ∼10 min before the recording of 20 trials recording sucrose responses. The mouse was then returned to the initial recording chamber and a final 20 trials were recorded. Error bars in C and F indicate SEM. *p < 0.05; **p < 0.01; n.s., not significant; multiple comparisons after repeated-measures one-way ANOVA. Shaded areas in B and E indicate SEM. Red and blue colors in B and E indicate significant increases and decreases from the baseline, respectively (p < 0.05, multivariate permutation tests). See Figure 4-1.
Figure 5.
Figure 5.
Acute stress decreases the reward response intensity of VTA dopamine neurons. AC, The effect of acute head-restraint on the sucrose response of VTA dopamine neurons (n = 6 mice). DF, The effect of placing an animal in a fearful context on the sucrose response of VTA dopamine neurons (n = 7 mice). Error bars in C and F indicate SEM. *p < 0.05; **p < 0.01; n.s., not significant; multiple comparisons after repeated-measures one-way ANOVA. Shaded areas in B and E indicate SEM. Red and blue colors in B and E indicate significant increases and decreases from the baseline, respectively (p < 0.05, multivariate permutation tests).
Figure 6.
Figure 6.
Acute stress decreases the conditioned responses of DRN serotonin to reward-predicting cues. AC, The effect of head restraint on the conditioned responses of DRN serotonin neurons to a cue that was associated with sucrose delivery. A, Heatmap representation of Ca2+ signals; (B) average plot of Ca2+ signals before, during, and after the trials with head restraint; (C) population data (n = 7 SERT-DRN-GCaMP6 mice). DF, Heatmap (D) and average Ca2+ signals (E) of a mouse and population data (F) showing the effect of a fearful context on the responses of DRN serotonin neurons to reward-predicting cues (n = 6 mice). Error bars in C and F indicate SEM. **p < 0.01; n.s., not significant; multiple comparisons after repeated-measures one-way ANOVA. Shaded areas in B and E indicate SEM. Red and blue colors in B and E indicate significant increases and decreases from the baseline, respectively (p < 0.05, multivariate permutation tests). See Figure 6-1.
Figure 7.
Figure 7.
Acute stress decreases the conditioned responses of VTA dopamine neurons to reward-predicting cues. AC, Heatmap (A) and peri-event plot of Ca2+ signals (B) of a representative mouse and population data (C) showing the effect of head restraint on the responses of VTA dopamine neurons to reward-associated cues (n = 6 DAT-VTA-GCaMP6 mice). DF, Heatmap (D) and peri-event plot of Ca2+ signals (E) of a mouse and population data (F) showing the effect of fearful context on the responses of VTA dopamine neurons to reward-predicting cues (n = 8 mice). Error bars in E and F indicate SEM. **p < 0.01; n.s., not significant; multiple comparisons after repeated-measures one-way ANOVA. Shaded areas in B and E indicate SEM. Red and blue colors in B and E indicate significant increases and decreases from the baseline, respectively (p < 0.05, multivariate permutation tests).

Similar articles

Cited by

References

    1. Amat J, Baratta MV, Paul E, Bland ST, Watkins LR, Maier SF (2005) Medial prefrontal cortex determines how stressor controllability affects behavior and dorsal raphe nucleus. Nat Neurosci 8:365–371. 10.1038/nn1399 - DOI - PubMed
    1. Anisman H, Zacharko RM (1990) Multiple neurochemical and behavioral consequences of stressors: implications for depression. Pharmacol Ther 46:119–136. 10.1016/0163-7258(90)90039-5 - DOI - PubMed
    1. Bekris S, Antoniou K, Daskas S, Papadopoulou-Daifoti Z (2005) Behavioural and neurochemical effects induced by chronic mild stress applied to two different rat strains. Behav Brain Res 161:45–59. 10.1016/j.bbr.2005.01.005 - DOI - PubMed
    1. Berghorst LH, Bogdan R, Frank MJ, Pizzagalli DA (2013) Acute stress selectively reduces reward sensitivity. Front Hum Neurosci 7:133. 10.3389/fnhum.2013.00133 - DOI - PMC - PubMed
    1. Bogdan R, Pizzagalli DA (2006) Acute stress reduces reward responsiveness: implications for depression. Biol Psychiatry 60:1147–1154. 10.1016/j.biopsych.2006.03.037 - DOI - PMC - PubMed

Publication types

LinkOut - more resources