. 2017 Sep 6;37(36):8783-8796.
doi: 10.1523/JNEUROSCI.0468-17.2017. Epub 2017 Aug 8.

Audiovisual Modulation in Mouse Primary Visual Cortex Depends on Cross-Modal Stimulus Configuration and Congruency

Affiliations

Audiovisual Modulation in Mouse Primary Visual Cortex Depends on Cross-Modal Stimulus Configuration and Congruency

Guido T Meijer et al. J Neurosci. .

Abstract

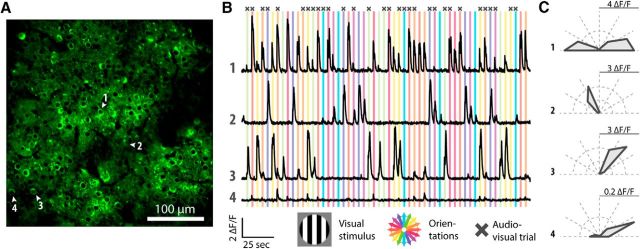
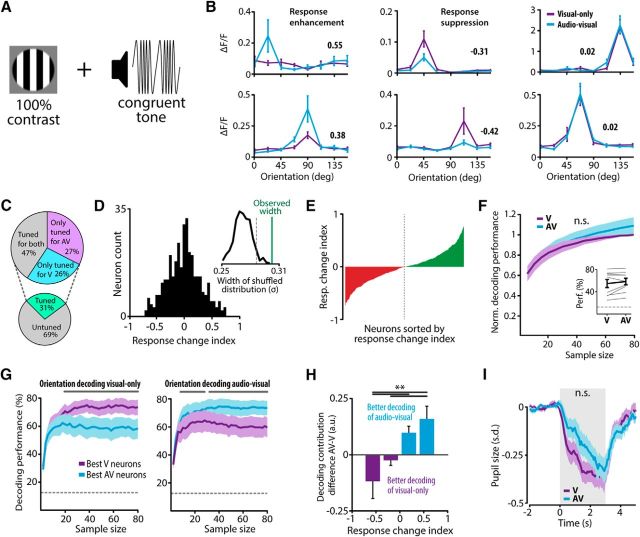
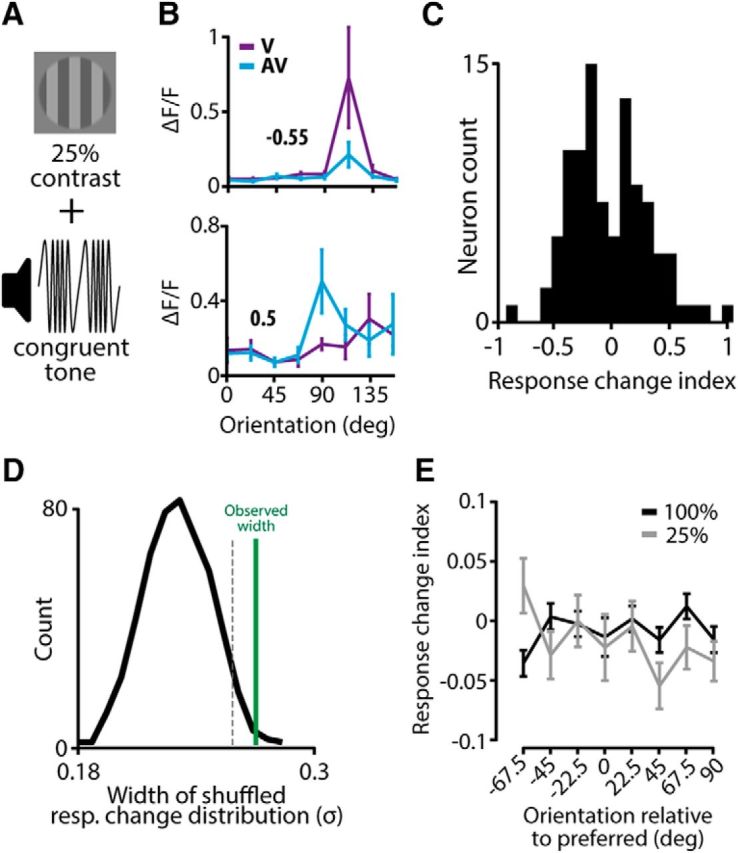
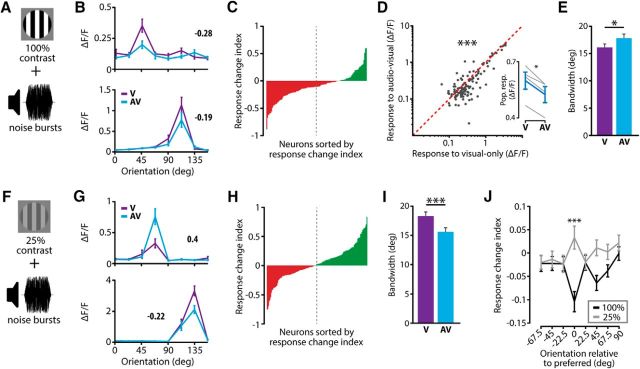
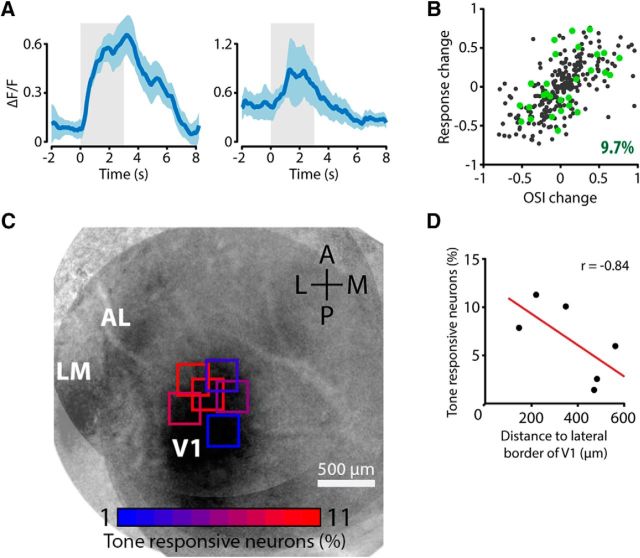
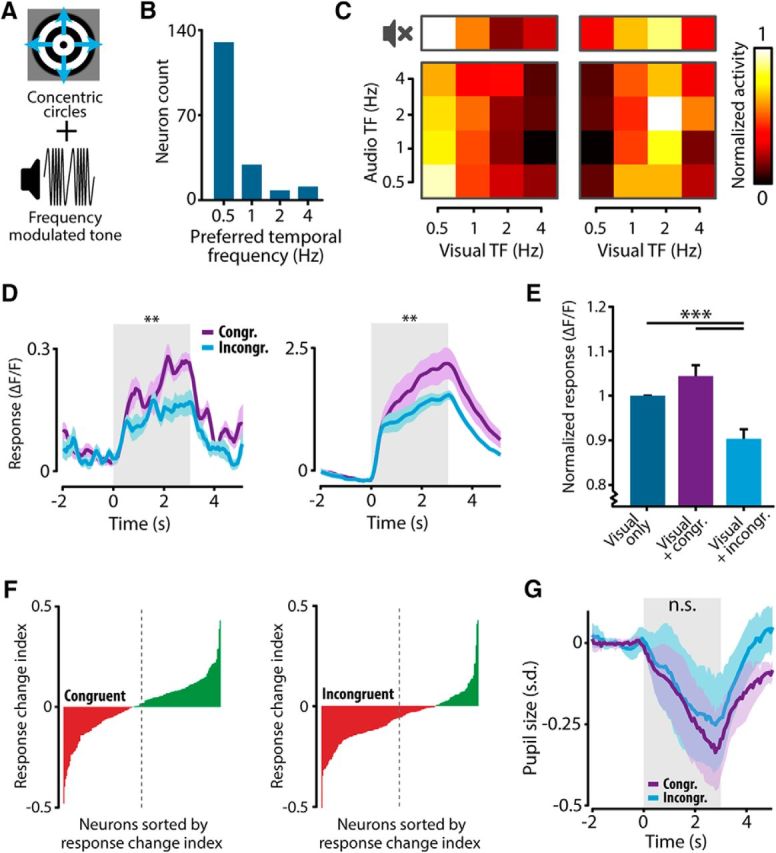
The sensory neocortex is a highly connected associative network that integrates information from multiple senses, even at the level of the primary sensory areas. Although a growing body of empirical evidence supports this view, the neural mechanisms of cross-modal integration in primary sensory areas, such as the primary visual cortex (V1), are still largely unknown. Using two-photon calcium imaging in awake mice, we show that the encoding of audiovisual stimuli in V1 neuronal populations is highly dependent on the features of the stimulus constituents. When the visual and auditory stimulus features were modulated at the same rate (i.e., temporally congruent), neurons responded with either an enhancement or suppression compared with unisensory visual stimuli, and their prevalence was balanced. Temporally incongruent tones or white-noise bursts included in audiovisual stimulus pairs resulted in predominant response suppression across the neuronal population. Visual contrast did not influence multisensory processing when the audiovisual stimulus pairs were congruent; however, when white-noise bursts were used, neurons generally showed response suppression when the visual stimulus contrast was high whereas this effect was absent when the visual contrast was low. Furthermore, a small fraction of V1 neurons, predominantly those located near the lateral border of V1, responded to sound alone. These results show that V1 is involved in the encoding of cross-modal interactions in a more versatile way than previously thought.SIGNIFICANCE STATEMENT The neural substrate of cross-modal integration is not limited to specialized cortical association areas but extends to primary sensory areas. Using two-photon imaging of large groups of neurons, we show that multisensory modulation of V1 populations is strongly determined by the individual and shared features of cross-modal stimulus constituents, such as contrast, frequency, congruency, and temporal structure. Congruent audiovisual stimulation resulted in a balanced pattern of response enhancement and suppression compared with unisensory visual stimuli, whereas incongruent or dissimilar stimuli at full contrast gave rise to a population dominated by response-suppressing neurons. Our results indicate that V1 dynamically integrates nonvisual sources of information while still attributing most of its resources to coding visual information.

Keywords: audiovisual; decoding; multisensory; neuronal ensembles; population; primary visual cortex.


Figures

Figure 1.
Figure 1.
Two-photon calcium imaging of neuronal activity in layer II/III of V1 of the awake mouse and the activity patterns of orientation-selective neurons. A, Field of view of an example imaging session. Cell bodies of neurons typically consist of a darkened nucleus and green fluorescent cytosol. Blood vessels appear black. Four example neurons are indicated with white arrows and numbers. B, Fluorescence traces of four example neurons. The cell bodies of those neurons are numbered in A. Colored bars behind the traces indicate presentations of bidirectionally moving gratings. The color of the bar indicates the orientation of the grating according to the rose plot on the bottom. Crosses above the colored bars show trials that were combined with an auditory stimulus. C, Tuning curves of orientation-selective firing for the four example neurons computed across all trials that contained visual stimulation. The full scale, as indicated by the gray line, of the fluorescence response is depicted in ΔF/F in the top right corner of each rose plot.
Figure 2.
Figure 2.
Multimodal stimulation results in subsets of neurons exhibiting response enhancement and suppression. A, Full-contrast visual square-wave gratings of eight orientations were presented alone (V) or together with a tone that was modulated at the same temporal frequency as the visual stimulus (AV). B, Tuning curves of six example neurons for both the V (purple) and the AV (cyan) condition. The response change index is shown next to the tuning curves as a bold number. C, Percentages of tuned neurons. D, Histogram of the change in response to the preferred orientation between the V and AV condition for each neuron. A positive response change index corresponds to a response enhancement by adding sound, whereas a negative response change indicates response suppression. The inset shows that the distribution of response changes between the V and AV conditions is broader than expected by chance, indicating that the number of neurons that showed a large positive or negative response change is larger than expected. The black curve indicates the histogram of the widths of response change distributions originating from shuffled datasets in which tone presence was shuffled. The dotted gray line indicates the 95th percentile of the shuffled distribution and the green line indicates the width of the experimentally observed response change distribution. E, The amount of response-enhancing (green) and response-suppressing (red) neurons was balanced in the population as shown by plotting the response change index of all neurons sorted from negative to positive (dotted line is midpoint of population). F, Orientation classification on the basis of random subsamples of neurons (bootstrapped 500 times) using a Bayesian decoding classifier reveals that the addition of a tone does not significantly change the amount of information regarding orientation in the population. Decoding performance is normalized to the performance at the largest sample size (80) of the V condition. Inset shows non-normalized decoding performance using the population of tuned neurons (gray lines indicate individual mice). G, Greedy decoding classification of orientation using samples of progressively decreasing decoding contribution. Left, Decoding performance was significantly better when using the ensemble of neurons that coded for the V condition (purple line), as indicated by a high decoding contribution in the V condition, compared with the ensemble that specialized in encoding audiovisual stimuli (cyan line). Right, Decoding performance in the AV condition was significantly better using the highly contributing neurons from the AV condition compared with the high contributors as determined in the V condition (dashed gray line indicates chance level, significant differences indicated by gray line above plot, paired t test, p < 0.05). H, Neurons showing a response suppression to audiovisual compared with visual-only stimuli contributed significantly more information to the V condition, whereas neurons that showed a response enhancement contributed significantly stronger to the AV condition (Kruskal–Wallis with post hoc Tukey–Kramer; dotted gray line represents chance level, significant differences indicated by solid gray line above plot; **p < 0.01). I, Pupil size, a proxy for arousal, was not significantly different between the two conditions (Wilcoxon matched-pairs signed-ranks test). Stimulus onset was centered at 0 s and lasted for 3 s as indicated by the gray box (all error bars represent SEM).
Figure 3.
Figure 3.
Balanced multisensory activation patterns for low-contrast visual stimuli. A, The visual stimulus was presented at a relatively low contrast (25%) and was combined with a frequency-modulated tone. B, Example tuning curves of two neurons showing either response suppression (top) or response enhancement (bottom). C, Histogram of the change in response to the preferred orientation between the V and AV conditions for each neuron. D, The distribution of response changes between the V and AV conditions is broader than expected by chance. Plotting conventions as in Figure 2E. E, The average response change was not significantly different between the full contrast (100%; black line; Fig. 2) and the low contrast (25%; gray line) for any of the eight orientations (t test with Bonferroni correction). Orientations were related to the preferred orientation of each neuron such that an orientation of 0 corresponded to the preferred orientation of that neuron. All error bars represent SEM.
Figure 4.
Figure 4.
Auditory stimulus features impact on cross-modal modulation. A, A full-contrast visual stimulus was presented alone (V) or combined with white-noise bursts (AV). B, Tuning curves of two example neurons for these stimulus conditions. C, Histogram of sorted response change indices of all neurons shows that there were more response-suppressing neurons compared with response-enhancing neurons when presenting 100% contrast visual stimuli with white-noise bursts (dotted line is midpoint of population). D, Across the entire tuned population, neurons showed a weaker response during visual-only compared with audiovisual stimulation (paired Wilcoxon signed-rank test). Inset shows a significant reduction of the population response per mouse (gray lines) in the AV compared with V condition (paired t test). E, Audiovisual stimulation resulted in a broadening of the tuning curves, as indicated by a significant increase in bandwidth during audiovisual compared with visual-only stimulation. F, The visual component was presented at a low contrast (25%) together with a white-noise auditory stimulus. G, Two example tuning curves for these stimulus conditions. H, Low-contrast visual stimuli paired with noise bursts resulted in a balanced prevalence of response-enhancing and response-suppressing neurons in the population. I, Neurons showed a sharpening of their tuning curves when a low-contrast visual stimulus was paired with white noise compared with when no auditory stimulus was presented, indicated by a significant decrease in bandwidth in AV versus V conditions (paired Wilcoxon signed-rank test). J, At the preferred orientation, there was a significant difference in response change between the full visual contrast (100%) and the low visual contrast (25%) conditions (t test with Bonferroni correction; *p < 0.05; ***p < 0.001). All error bars represent SEM.
Figure 5.
Figure 5.
Neurons in V1 respond to auditory stimulation. A, Two example neurons showing a significant response when the mouse was presented with an auditory stimulus only (solid cyan line represents mean response, shaded area represents SEM). The light gray area indicates the time of stimulus presentation (t = 0 tone onset). B, Scatterplot of the response change index and change in orientation selectivity of all tuned neurons. Tone-responsive neurons are plotted in green (9.7% of the tuned population). Tone-responsive neurons did not selectively show either response enhancement or suppression in the AV condition, but were distributed evenly among the visually tuned population. C, Recording sessions on the lateral side of V1 contained more tone-responsive neurons than sessions on the medial side. Squares show imaging sites overlaid with the average intrinsic optical signal imaging map, color of the square shows the percentage of tone-responding neurons. D, Significant correlation between the distance of the center of the imaging plane to the lateral border of V1 and the percentage of tone-responsive neurons in that imaging plane (Pearson's correlation, p = 0.04).
Figure 6.
Figure 6.
Neurons in V1 are sensitive to the congruency between visual and auditory stimuli. A, Mice were presented with concentric outward-moving circles together with a frequency-modulated tone. The temporal frequency (TF) of the visual stimulus and the modulation rate of the frequency-modulated tone could vary (0.5, 1, 2, and 4 Hz). Besides the AV condition, a V condition was also presented. B, Histogram indicating the incidence of each preferred TF in the V condition. Most neurons were tuned to slow-moving (0.5 Hz) concentric circles. C, The responses of two example neurons for all frequencies in the V (top row; no-sound symbol) and AV conditions (bottom matrix). The average fluorescence response for each combination of visual and auditory TF was normalized to the strongest response recorded and color coded in a response matrix. D, The fluorescence response to the preferred visual TF combined with a congruent (purple) or incongruent (cyan) auditory TF (same example neurons as in C). Both neurons show a stronger fluorescence response for the congruent stimulus combination (left: 0.5 Hz visual with 0.5 Hz audio; right: 2 Hz visual with 2 Hz audio) compared with the incongruent combination (left: 0.5 Hz visual with 4 Hz audio; right: 2 Hz visual with 0.5 Hz audio). E, The fluorescence response was normalized to the V condition. Neurons showed a significant response suppression when presented with an incongruent audiovisual stimulus (Kruskal–Wallis with post hoc Tukey–Kramer). F, Sorted histograms of response change indices for congruent and incongruent AV combinations show that during congruent stimuli, response-enhancing and response-suppressing neurons are proportionally present in the population, whereas during incongruent AV stimulation this balance shifts to predominantly response-suppressing neurons (dotted line indicates midpoint of the population). G, Pupil size was not significantly different during congruent and incongruent audiovisual stimulation (Wilcoxon matched-pairs signed-ranks test; **p < 0.01; ***p < 0.001). All error bars represent SEM.

Similar articles

Cited by

References

    1. Aston-Jones G, Cohen JD (2005) An integrative theory of locus coeruleus-norepinephrine function: adaptive gain and optimal performance. Annu Rev Neurosci 28:403–450. 10.1146/annurev.neuro.28.061604.135709 - DOI - PubMed
    1. Berens P, Keliris GA, Ecker AS, Logothetis NK, Tolias AS (2008) Comparing the feature selectivity of the gamma-band of the local field potential and the underlying spiking activity in primate visual cortex. Front Syst Neurosci 2:2. 10.3389/neuro.01.015.2008 - DOI - PMC - PubMed
    1. Budinger E, Scheich H (2009) Anatomical connections suitable for the direct processing of neuronal information of different modalities via the rodent primary auditory cortex. Hear Res 258:16–27. 10.1016/j.heares.2009.04.021 - DOI - PubMed
    1. Cappe C, Rouiller EM, Barone P (2009) Multisensory anatomical pathways. Hear Res 258:28–36. 10.1016/j.heares.2009.04.017 - DOI - PubMed
    1. Carandini M, Heeger DJ (2011) Normalization as a canonical neural computation. Nat Rev Neurosci 13:51–62. 10.1038/nrc3398 - DOI - PMC - PubMed

Publication types

LinkOut - more resources