. 2017 Sep 20;37(38):9189-9196.
doi: 10.1523/JNEUROSCI.0938-17.2017. Epub 2017 Aug 18.

Cortical Representations of Speech in a Multitalker Auditory Scene

Affiliations

Cortical Representations of Speech in a Multitalker Auditory Scene

Krishna C Puvvada et al. J Neurosci. .

Abstract

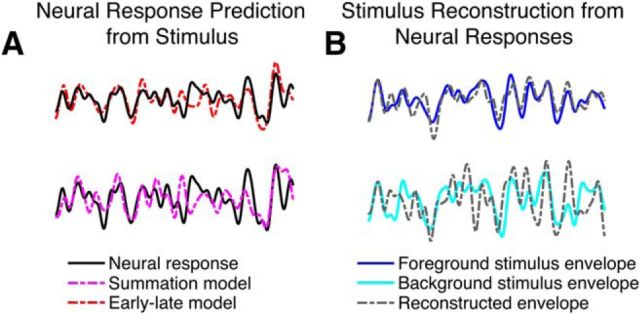
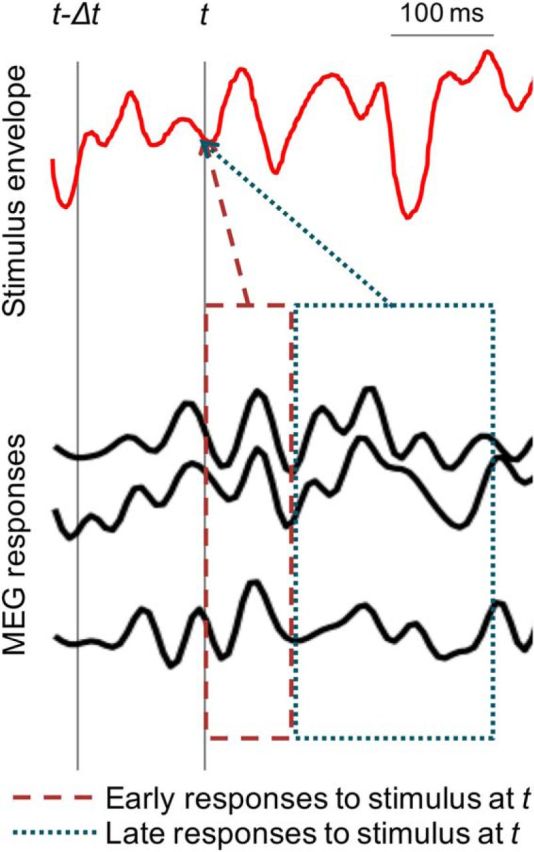
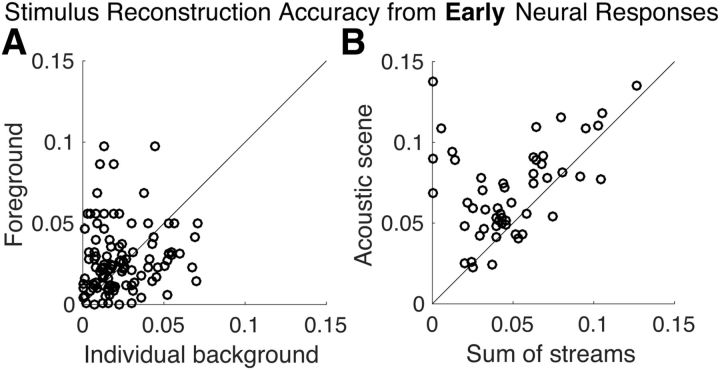
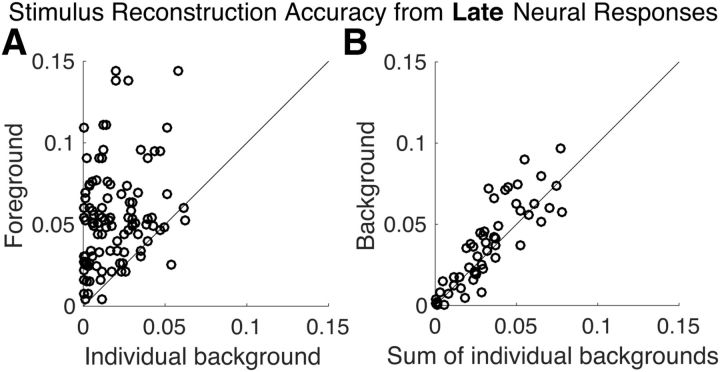
The ability to parse a complex auditory scene into perceptual objects is facilitated by a hierarchical auditory system. Successive stages in the hierarchy transform an auditory scene of multiple overlapping sources, from peripheral tonotopically based representations in the auditory nerve, into perceptually distinct auditory-object-based representations in the auditory cortex. Here, using magnetoencephalography recordings from men and women, we investigate how a complex acoustic scene consisting of multiple speech sources is represented in distinct hierarchical stages of the auditory cortex. Using systems-theoretic methods of stimulus reconstruction, we show that the primary-like areas in the auditory cortex contain dominantly spectrotemporal-based representations of the entire auditory scene. Here, both attended and ignored speech streams are represented with almost equal fidelity, and a global representation of the full auditory scene with all its streams is a better candidate neural representation than that of individual streams being represented separately. We also show that higher-order auditory cortical areas, by contrast, represent the attended stream separately and with significantly higher fidelity than unattended streams. Furthermore, the unattended background streams are more faithfully represented as a single unsegregated background object rather than as separated objects. Together, these findings demonstrate the progression of the representations and processing of a complex acoustic scene up through the hierarchy of the human auditory cortex.SIGNIFICANCE STATEMENT Using magnetoencephalography recordings from human listeners in a simulated cocktail party environment, we investigate how a complex acoustic scene consisting of multiple speech sources is represented in separate hierarchical stages of the auditory cortex. We show that the primary-like areas in the auditory cortex use a dominantly spectrotemporal-based representation of the entire auditory scene, with both attended and unattended speech streams represented with almost equal fidelity. We also show that higher-order auditory cortical areas, by contrast, represent an attended speech stream separately from, and with significantly higher fidelity than, unattended speech streams. Furthermore, the unattended background streams are represented as a single undivided background object rather than as distinct background objects.

Keywords: attention; auditory cortex; cocktail party problem; magnetoencephalography; stimulus reconstruction; temporal response function.


Figures

Figure 1.
Figure 1.
Illustrations of outcomes comparing competing encoding-based and decoding-based neural representations of the auditory scene and its constituents. All examples are grand averages across subjects (3 s duration). A, Comparing competing models of encoding to neural responses. In both the top and bottom examples, an experimentally measured MEG response (black) is compared with the neural response predictions made by competing proposed models. In the top example, the neural response prediction (red) is from the early–late model; in the bottom example, the neural response prediction (magenta) is from the summation model. The proposed early–late model prediction shows higher correlation with the actual MEG neural response than the summation model. B, Comparing models of decoding to stimulus speech envelopes. In both the top and bottom examples, an acoustic speech stimulus envelope (blue/cyan) is compared with the model reconstruction of the respective envelope (gray). In the top example, the envelope reconstruction is of the foreground stimulus (blue), based on late time responses; in the bottom example, the envelope reconstruction is of the background stimulus (cyan), also based on late time responses. The foreground reconstruction shows higher correlation with the actual foreground envelope, compared with the background reconstruction with the actual background envelope.
Figure 2.
Figure 2.
Early versus late MEG neural responses to a continuous speech stimulus. A sample stimulus envelope and time-locked multichannel MEG recordings are shown in red and black respectively. The two gray vertical lines indicate two arbitrary time points at t − Δt and t. The dashed and dotted boxes represent the early and late MEG neural responses to stimulus at time point t respectively. The reconstruction of the stimulus envelope at time t can be based on either early or late neural responses, and the separate reconstructions can be compared against each other.
Figure 3.
Figure 3.
Stimulus envelope reconstruction accuracy using early neural responses. A, Scatter plot of reconstruction accuracy of the foreground versus individual background envelopes. No significant difference was observed (p = 0.21), and therefore no preferential representation of the foreground stream over the individual background streams is revealed in early neural responses. Each data point corresponds to a distinct background and condition partition per subject (with two backgrounds sharing a common foreground). B, Scatter plot of reconstruction accuracy of the envelope of the entire acoustic scene versus that of the sum of the envelopes of all three individual speech streams. The acoustic scene is reconstructed more accurately (visually, most of data points fall above the diagonal) as a whole than as the sum of individual components in early neural responses (p < 2 × 10⁻⁶). Each data point corresponds to a distinct condition partition per subject. In both plots, reconstruction accuracy is measured by proportion of the variance explained: the square of the Pearson correlation coefficient between the actual and predicted envelopes.
Figure 4.
Figure 4.
Stimulus envelope reconstruction accuracy using late neural responses. A, Scatter plot of accuracy of foreground versus individual background envelope reconstructions demonstrates that the foreground is represented with dramatically better fidelity (visually, most of data points fall above the diagonal) than the background speech, in late neural responses (p < 2 × 10⁻⁶). Each data point corresponds to a distinct background and condition partition per subject (with two backgrounds sharing a common foreground). B, Scatter plot of the reconstruction accuracy of the envelope of the entire background versus that of the sum of the envelopes of the two individual background speech streams. The background scene is reconstructed more accurately as a monolithic background than as separated individual background streams in late neural responses (p = 0.012). Each data point corresponds to a distinct condition partition per subject.
Figure 5.
Figure 5.
MEG response prediction accuracy. Scatter plot of the accuracy of predicted MEG neural response for the proposed early–late model versus the standard summation model. The early–late model predicts the MEG neural response dramatically better (visually, most of data points fall above the diagonal) than the summation model (p < 2 × 10⁻⁶). The accuracy of predicted MEG neural responses is measured by proportion of the variance explained: the square of the Pearson correlation coefficient between the actual and predicted responses. Each data point corresponds to a distinct condition partition per subject.

Similar articles

Cited by

References

    1. Ahveninen J, Hämäläinen M, Jääskeläinen IP, Ahlfors SP, Huang S, Lin FH, Raij T, Sams M, Vasios CE, Belliveau JW (2011) Attention-driven auditory cortex short-term plasticity helps segregate relevant sounds from noise. Proc Natl Acad Sci U S A 108:4182–4187. 10.1073/pnas.1016134108 - DOI - PMC - PubMed
    1. Bregman AS. (1994) Auditory scene analysis: the perceptual organization of sound. Cambridge, MA: MIT.
    1. Carlyon RP. (2004) How the brain separates sounds. Trends Cogn Sci 8:465–471. 10.1016/j.tics.2004.08.008 - DOI - PubMed
    1. Chang EF, Rieger JW, Johnson K, Berger MS, Barbaro NM, Knight RT (2010) Categorical speech representation in human superior temporal gyrus. Nat Neurosci 13:1428–1432. 10.1038/nn.2641 - DOI - PMC - PubMed
    1. Cherry EC. (1953) Some experiments on the recognition of speech, with one and with 2 ears. J Acoust Soc Am 25:975–979. 10.1121/1.1907229 - DOI

Publication types