

Cathepsin K knockout protects against cardiac dysfunction in diabetic mice
- PMID: 28821796
- PMCID: PMC5562704
- DOI: 10.1038/s41598-017-09037-z
Cathepsin K knockout protects against cardiac dysfunction in diabetic mice
Abstract
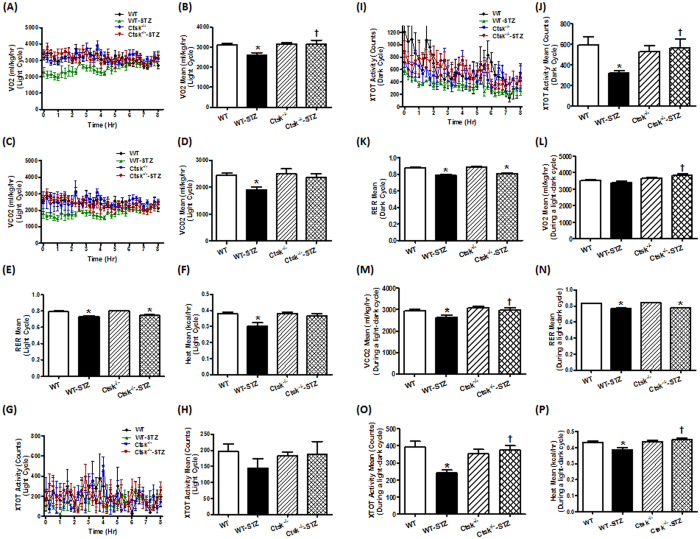
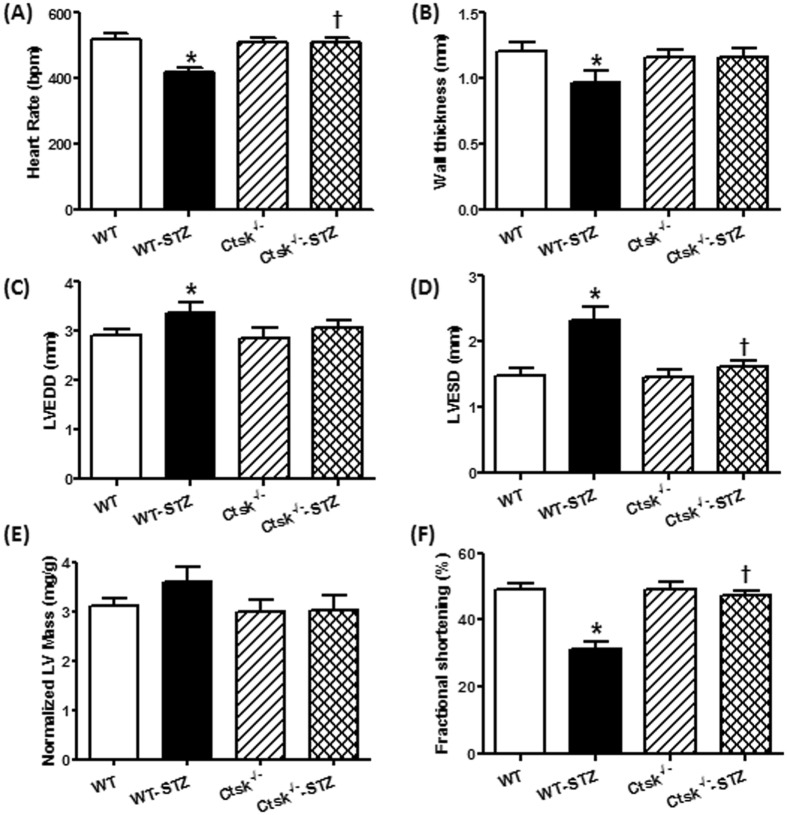
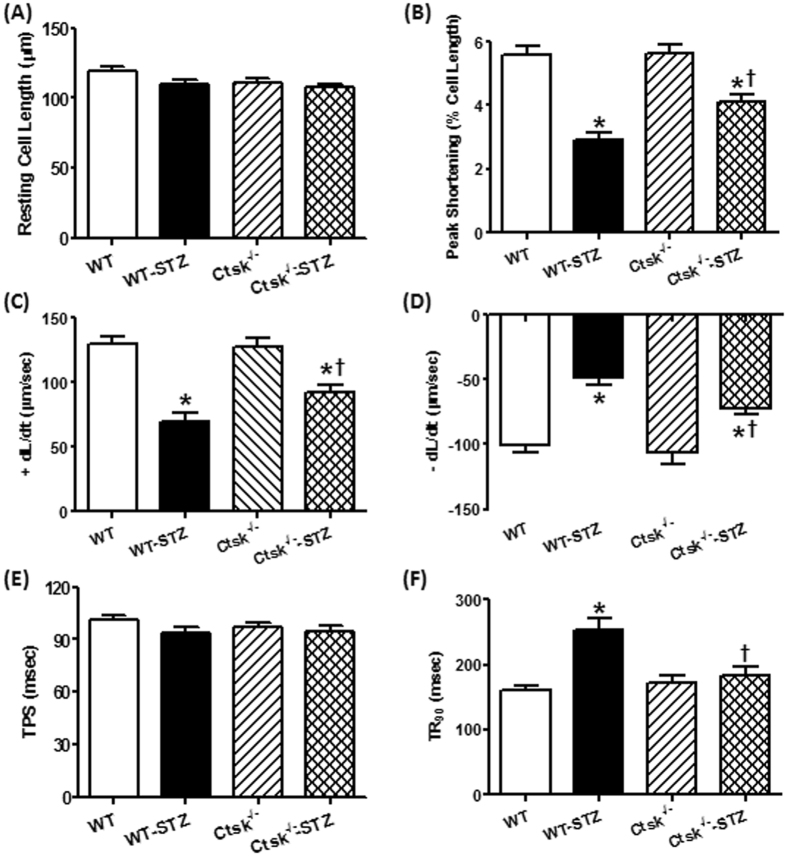
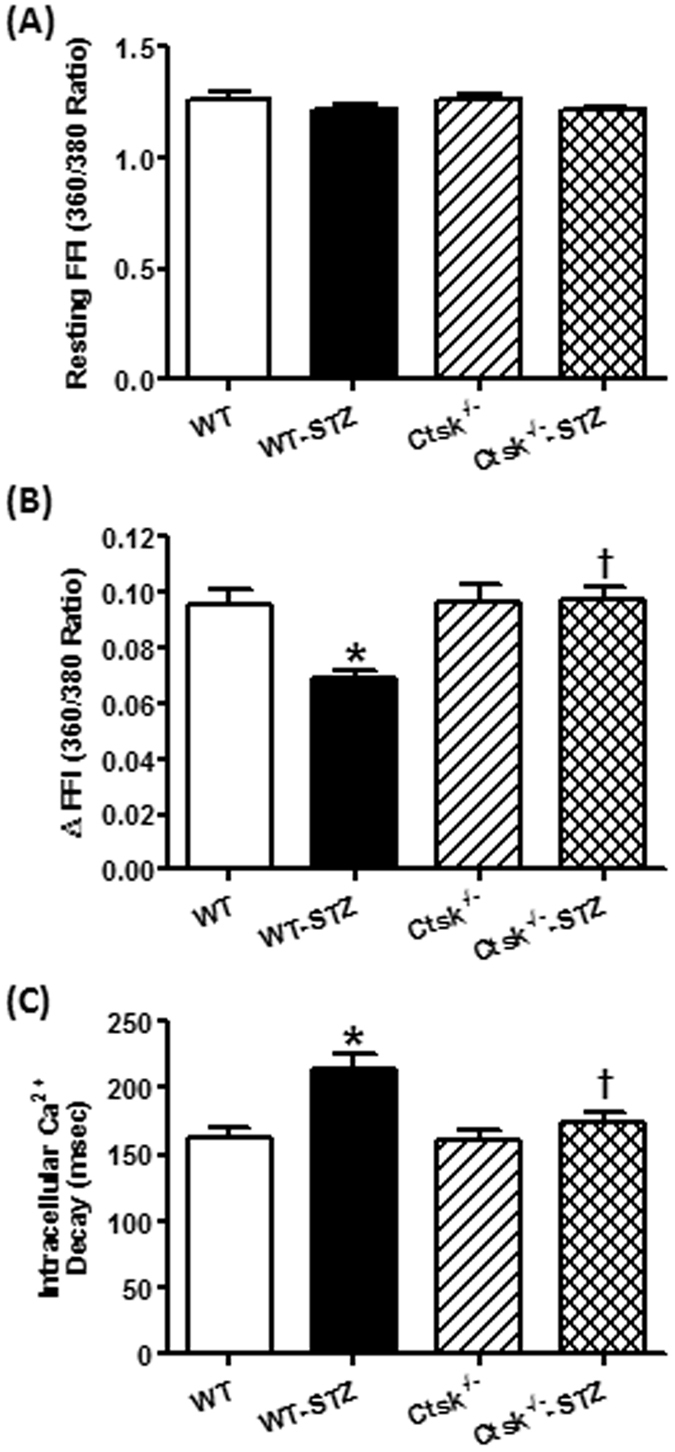
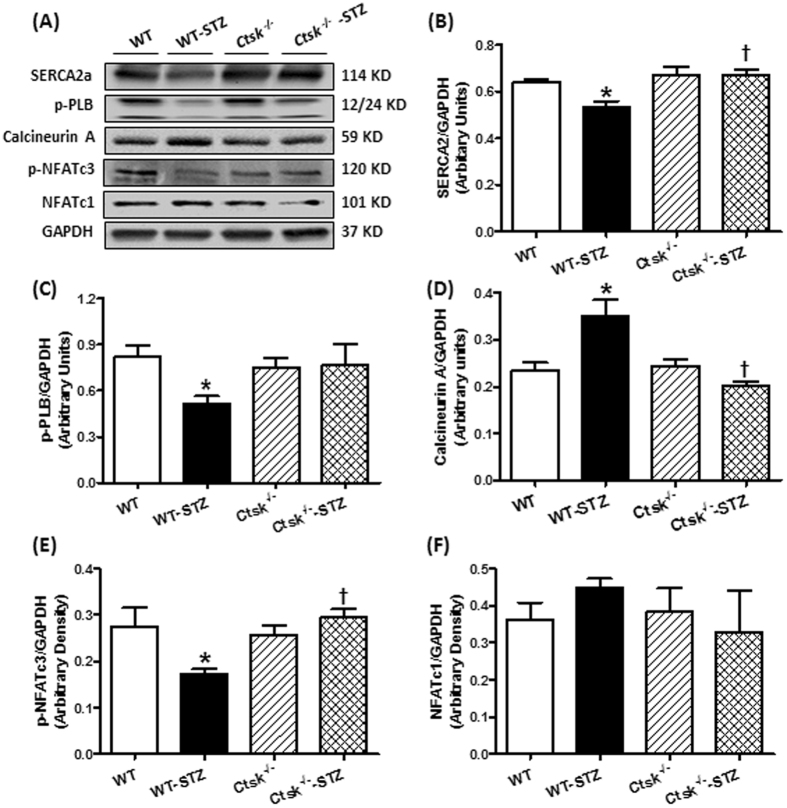
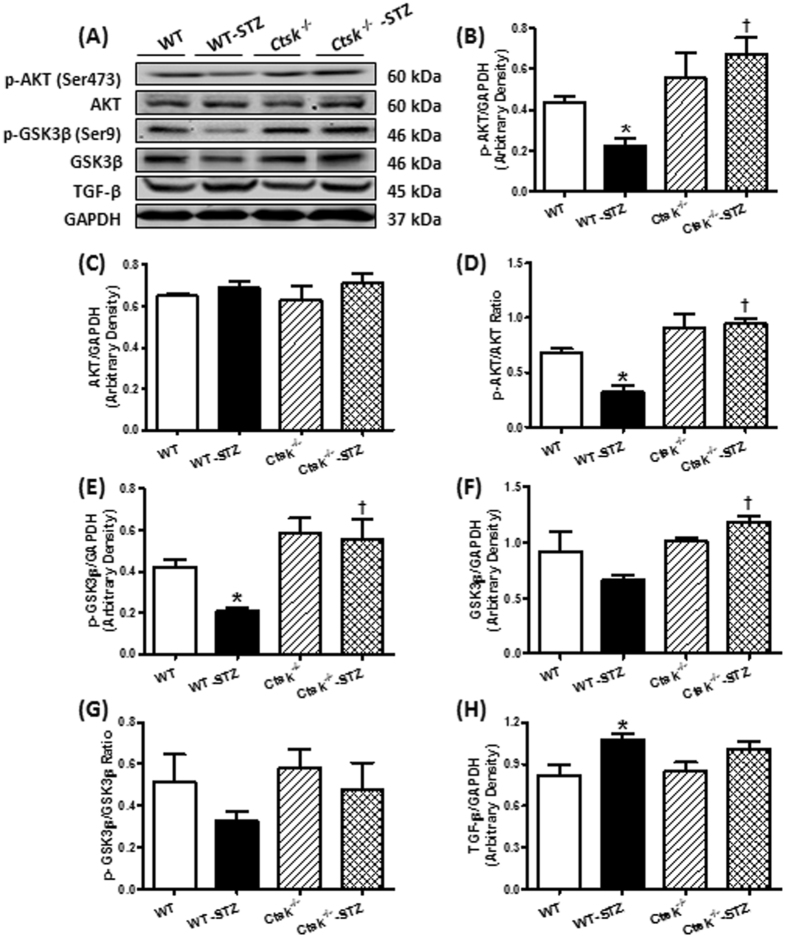
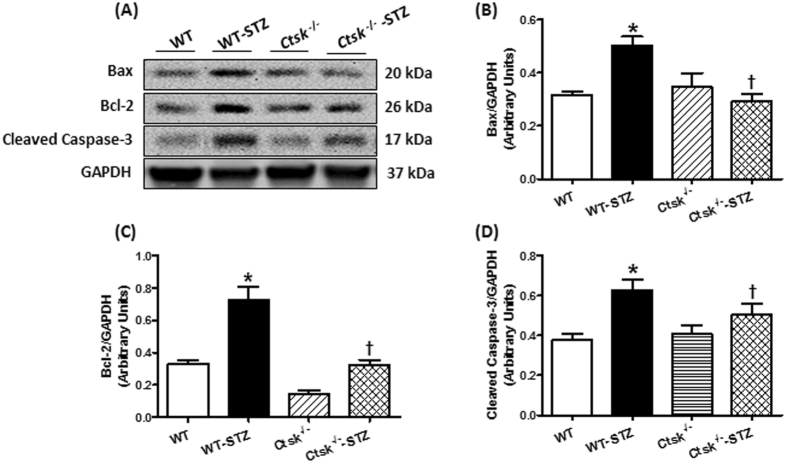
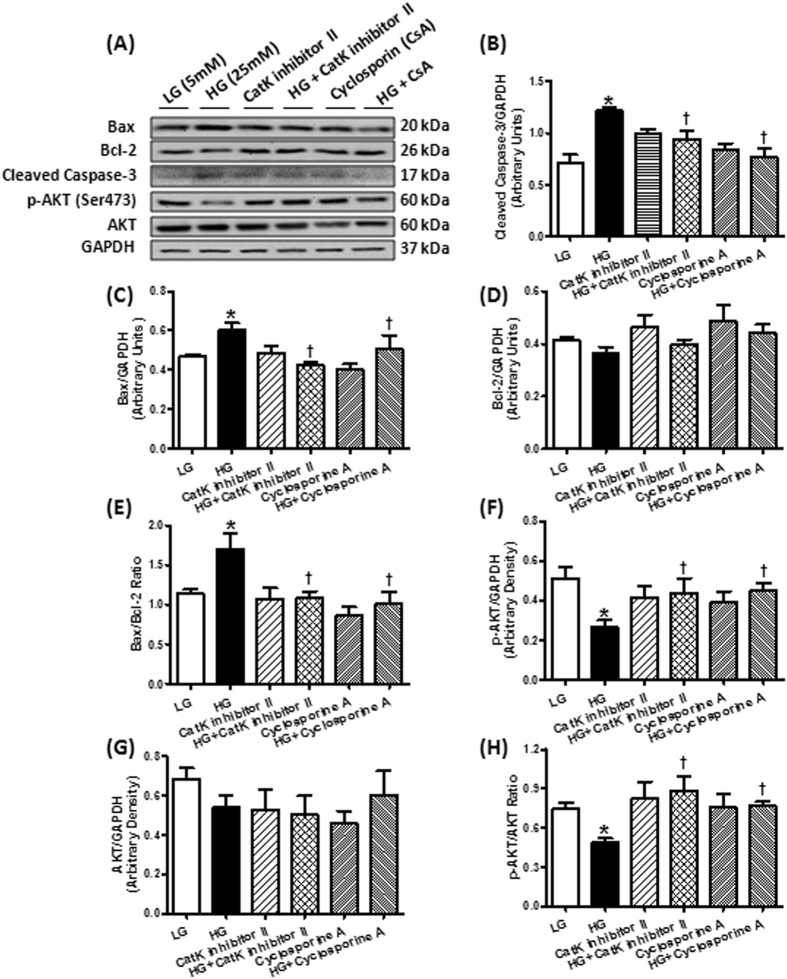
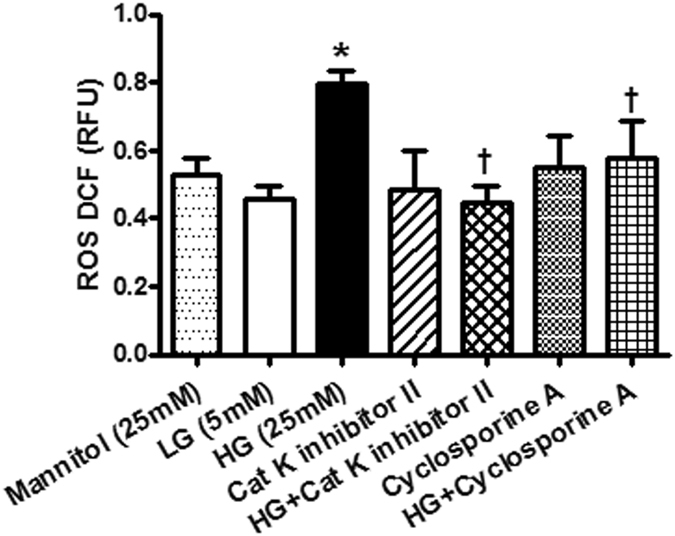
Diabetes is a major risk factor for cardiovascular disease and the lysosomal cysteine protease cathepsin K plays a critical role in cardiac pathophysiology. To expand upon our previous findings, we tested the hypothesis that, knockout of cathepsin K protects against diabetes-associated cardiac anomalies. Wild-type and cathepsin K knockout mice were rendered diabetic by streptozotocin (STZ) injections. Body weight, organ mass, fasting blood glucose, energy expenditure, cardiac geometry and function, cardiac histomorphology, glutathione levels and protein levels of cathepsin K and those associated with Ca2+ handling, calcineurin/NFAT signaling, insulin signaling, cardiac apoptosis and fibrosis were determined. STZ-induced diabetic mice exhibited distinct cardiac dysfunction, dampened intracellular calcium handling, alterations in cardiac morphology, and elevated cardiomyocyte apoptosis, which were mitigated in the cathepsin K knockout mice. Additionally, cathepsin K knockout mice attenuated cardiac oxidative stress and calcineurin/NFAT signaling in diabetic mice. In cultured H9c2 myoblasts, pharmacological inhibition of cathepsin K, or treatment with calcineurin inhibitor rescued cells from high-glucose triggered oxidative stress and apoptosis. Therefore, cathepsin K may represent a potential target in treating diabetes-associated cardiac dysfunction.
Conflict of interest statement
The authors declare that they have no competing interests.
Figures
Similar articles
-
Cardiomyocyte-specific disruption of Cathepsin K protects against doxorubicin-induced cardiotoxicity.Cell Death Dis. 2018 Jun 7;9(6):692. doi: 10.1038/s41419-018-0727-2. Cell Death Dis. 2018. PMID: 29880809 Free PMC article.
-
Cathepsin K knockout alleviates aging-induced cardiac dysfunction.Aging Cell. 2015 Jun;14(3):345-51. doi: 10.1111/acel.12276. Epub 2015 Feb 18. Aging Cell. 2015. PMID: 25692548 Free PMC article.
-
Cathepsin K knockout mitigates high-fat diet-induced cardiac hypertrophy and contractile dysfunction.Diabetes. 2013 Feb;62(2):498-509. doi: 10.2337/db12-0350. Epub 2012 Oct 15. Diabetes. 2013. PMID: 23069627 Free PMC article.
-
Sirt3 deficiency exacerbates diabetic cardiac dysfunction: Role of Foxo3A-Parkin-mediated mitophagy.Biochim Biophys Acta Mol Basis Dis. 2017 Aug;1863(8):1973-1983. doi: 10.1016/j.bbadis.2016.10.021. Epub 2016 Oct 26. Biochim Biophys Acta Mol Basis Dis. 2017. PMID: 27794418 Review.
-
The mechanism of the NFAT transcription factor family involved in oxidative stress response.J Cardiol. 2024 Jan;83(1):30-36. doi: 10.1016/j.jjcc.2023.04.017. Epub 2023 May 4. J Cardiol. 2024. PMID: 37149283 Review.
Cited by
-
Cathepsin K in Pathological Conditions and New Therapeutic and Diagnostic Perspectives.Int J Mol Sci. 2022 Nov 9;23(22):13762. doi: 10.3390/ijms232213762. Int J Mol Sci. 2022. PMID: 36430239 Free PMC article. Review.
-
Endogenous reduction of miR-185 accelerates cardiac function recovery in mice following myocardial infarction via targeting of cathepsin K.J Cell Mol Med. 2019 Feb;23(2):1164-1173. doi: 10.1111/jcmm.14016. Epub 2018 Nov 18. J Cell Mol Med. 2019. PMID: 30450725 Free PMC article.
-
Cathepsin S Deficiency Mitigated Chronic Stress-Related Neointimal Hyperplasia in Mice.J Am Heart Assoc. 2019 Jul 16;8(14):e011994. doi: 10.1161/JAHA.119.011994. Epub 2019 Jul 12. J Am Heart Assoc. 2019. PMID: 31296090 Free PMC article.
-
Identification and Analysis of Hub Genes in Diabetic Cardiomyopathy: Potential Role of Cytochrome P450 1A1 in Mitochondrial Metabolism and STZ-Induced Myocardial Dysfunction.Front Cardiovasc Med. 2022 Mar 21;9:835244. doi: 10.3389/fcvm.2022.835244. eCollection 2022. Front Cardiovasc Med. 2022. PMID: 35387435 Free PMC article.
-
Myocardial protection of S-nitroso-L-cysteine in diabetic cardiomyopathy mice.Front Endocrinol (Lausanne). 2022 Oct 12;13:1011383. doi: 10.3389/fendo.2022.1011383. eCollection 2022. Front Endocrinol (Lausanne). 2022. PMID: 36313766 Free PMC article.
References
-
- DeFronzo RA. Pathogenesis of type 2 diabetes: metabolic and molecular implications for identifying diabetes genes. Diabetes Reviews. 1997;5:177–269.
-
- Fonarow, G. C. & Srikanthan, P. Diabetic cardiomyopathy. Endocrinol Metab Clin North Am35, 575–599, ix, doi:10.1016/j.ecl.2006.05.003 (2006). - PubMed
-
- Seferovic, P. M. & Paulus, W. J. Clinical diabetic cardiomyopathy: a two-faced disease with restrictive and dilated phenotypes. Eur Heart J36, 1718–1727, 1727a-1727c, doi:10.1093/eurheartj/ehv134 (2015). - PubMed
-
- Zhong M, et al. [Mechanism of reversion of myocardial interstitial fibrosis in diabetic cardiomyopathy by valsartan] Zhonghua Yi Xue Za Zhi. 2006;86:232–236. - PubMed
Publication types
MeSH terms
Substances
Grants and funding
LinkOut - more resources
Full Text Sources
Other Literature Sources
Molecular Biology Databases
Miscellaneous
