. 2017 Aug 18;7(1):8794.
doi: 10.1038/s41598-017-09114-3.

Plk1 bound to Bub1 contributes to spindle assembly checkpoint activity during mitosis

Affiliations

Plk1 bound to Bub1 contributes to spindle assembly checkpoint activity during mitosis

Masanori Ikeda et al. Sci Rep. .

Abstract

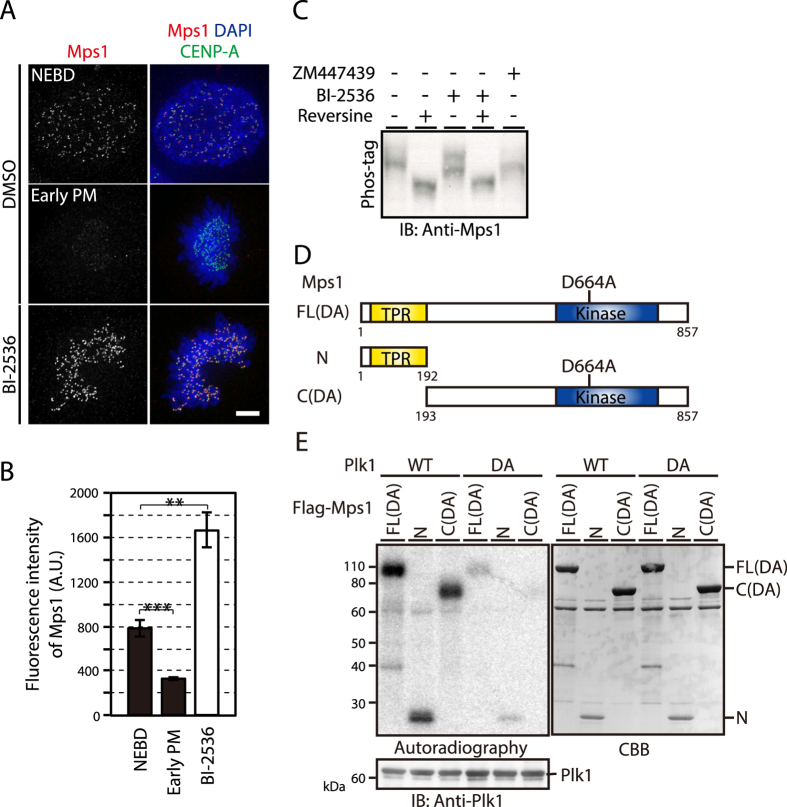
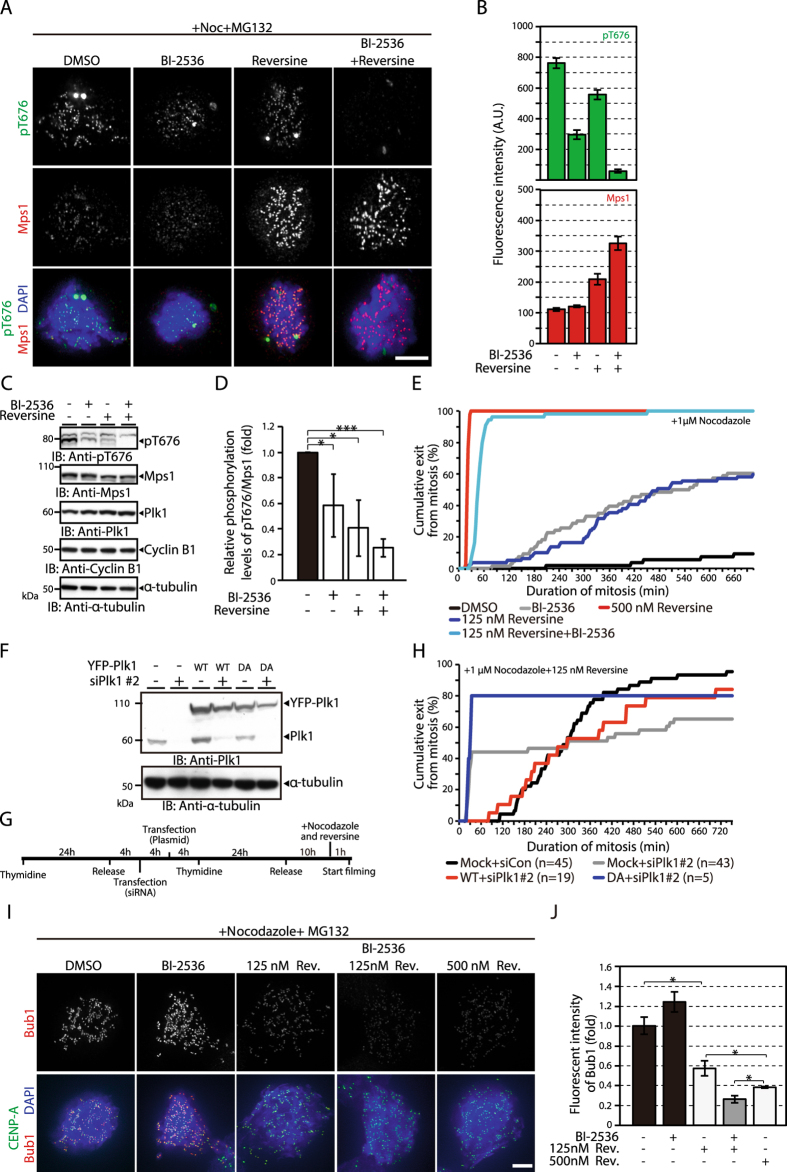
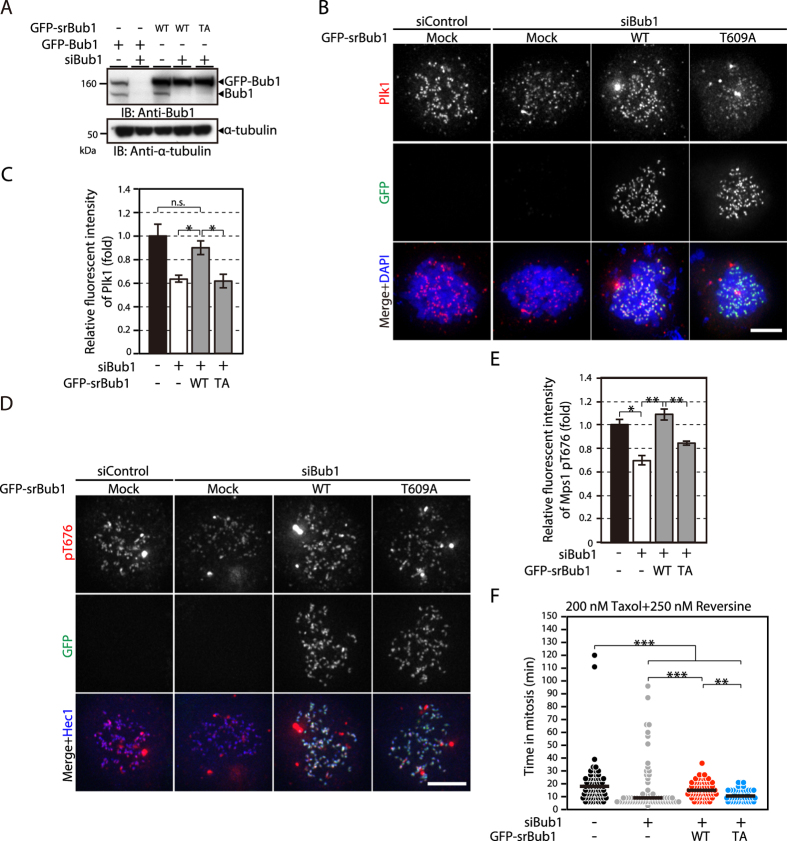
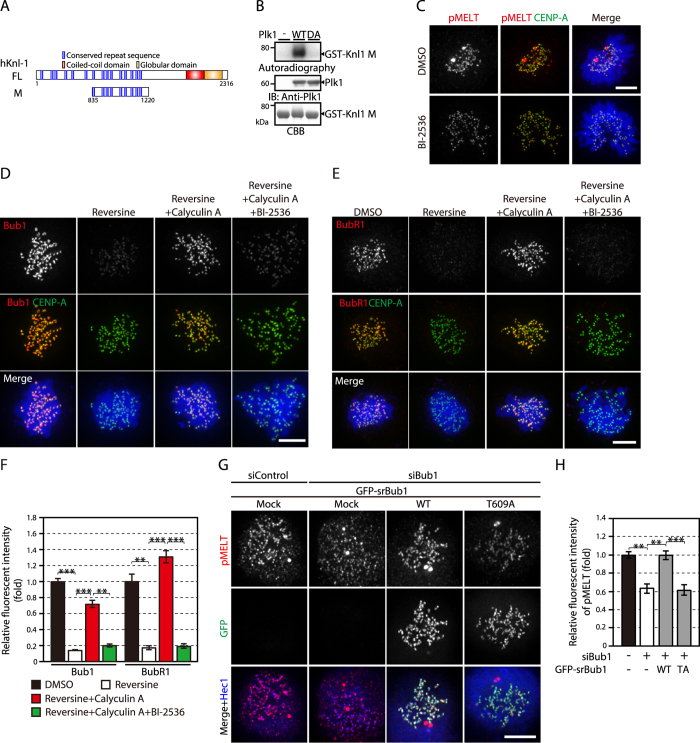
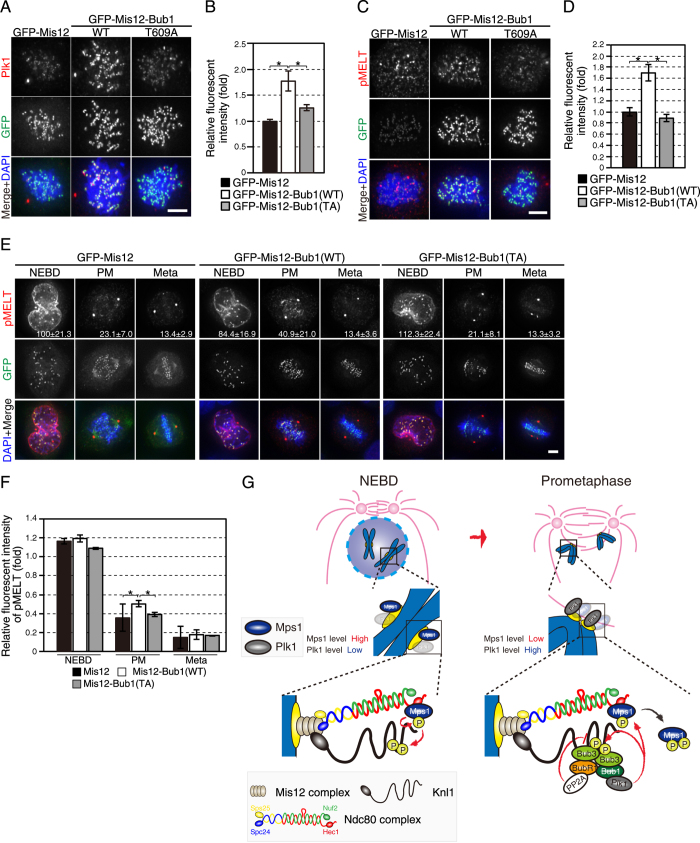
For faithful chromosome segregation, the formation of stable kinetochore-microtubule attachment and its monitoring by the spindle assembly checkpoint (SAC) are coordinately regulated by mechanisms that are currently ill-defined. Here, we show that polo-like kinase 1 (Plk1), which is instrumental in forming stable kinetochore-microtubule attachments, is also involved in the maintenance of SAC activity by binding to Bub1, but not by binding to CLASP2 or CLIP-170. The effect of Plk1 on the SAC was found to be mediated through phosphorylation of Mps1, an essential kinase for the SAC, as well as through phosphorylation of the MELT repeats in Knl1. Bub1 acts as a platform for assembling other SAC components on the phosphorylated MELT repeats. We propose that Bub1-bound Plk1 is important for the maintenance of SAC activity by supporting Bub1 localization to kinetochores in prometaphase, a time when the kinetochore Mps1 level is reduced, until the formation of stable kinetochore-microtubule attachment is completed. Our study reveals an intricate mechanism for coordinating the formation of stable kinetochore-microtubule attachment and SAC activity.


Conflict of interest statement

The authors declare that they have no competing interests.

Figures

Figure 1
Figure 1
Plk1 phosphorylates Mps1 and affects its kinetochore localization. (A) Kinetochore localization of Mps1 in Plk1-inhibited cells. Mitotic HeLa cells expressing CENP-A-GFP (green) during nuclear envelope breakdown (NEBD) and in early prometaphase (PM), as well as in the presence of BI-2536, were fixed and immunostained with an antibody against Mps1 (red) and counterstained with 4,6-diamidino-2-phenylindole (DAPI) to label DNA (blue). Scale bar: 5 μm. (B) Kinetochore Mps1 levels during NEBD, in early PM, and in the presence of BI-2536 were quantified. At least 91 kinetochores per cell (5 cells) were counted for each condition. The experiments were repeated three times, and the representative data obtained from a single experiment were shown. A.U: arbitrary units. Error bars represent S.E. **P < 0.001; ***P < 0.0005 (two-tailed t-test). (C) Bandshift of Mps1 in cells treated with reversine (500 nM), BI-2536 (300 nM), or ZM447439 (2 μM). Samples were subjected to Phos-tag SDS-PAGE followed by western blotting analysis using an antibody against Mps1. (D) Schematic representation of Mps1 truncation mutants used in the in vitro kinase assay. The locations of the tetratricopeptide repeat (TPR) domain, kinase domain, and the kinase-inactivating mutation are shown. (E) In vitro kinase assay of Mps1 by Plk1. The Mps1 truncation mutants shown in (D) were incubated with wild-type (WT) or kinase-dead (DA) Plk1 in the presence of γ-32P-ATP. γ-32P-ATP incorporated into the Mps1 constructs was detected by autoradiography.
Figure 2
Figure 2
Plk1 is involved in the activation of Mps1 on kinetochores and the maintenance of SAC activity. (A) Phosphorylation of Mps1 on kinetochores in Plk1- and/or Mps1-inhibited HeLa cells. Mitotic HeLa cells were treated with 300 nM BI-2536 and/or 500 nM reversine in the presence of nocodazole and MG132, fixed and stained with antibodies against phospho-Thr676 (pT676) of Mps1 (green) and Mps1 (red). DNA was stained with DAPI (blue). Scale bar: 5 μm. (B) Quantification of pT676 and total Mps1 signal on kinetochores. The fluorescence intensity of pT676 of Mps1 and total Mps1 in cells treated as in (A) is shown. At least 76 kinetochore signals per cell (5 cells) were quantified for each condition. The experiments were repeated three times, and the representative dataset collected from a single experiment was shown. A.U: arbitrary units. Error bars represent S.E. (C) Phosphorylation of Mps1 in Plk1- and/or Mps1-inhibited cells. HeLa cells treated with 300 nM BI-2536 and/or 500 nM reversine were lysed and subjected to western blotting analysis with antibodies as indicated. (D) Quantification of pT676 to total Mps1 ratio in HeLa cells treated as in (C). The ratio in DMSO-treated cells was set as 1. Error bars represent S.D. of three experiments. *P < 0.05; *** P < 0.0001 (two-tailed t-test). (E) Plk1 contributes to SAC maintenance. The cumulative frequency of cells treated with reversine and/or BI-2536 that exited from mitotic arrest in the presence of nocodazole is shown. At least 43 cells were measured for each condition from a single experiment, representing three independent experiments. (F) Depletion of Plk1 with an siRNA targeting the untranslated region (3′-UTR) of Plk1 and the expression of YFP-Plk1. The lysates were separated by SDS-PAGE and probed by western blotting with an anti-Plk1 antibody or anti-α-tubulin antibody. (G) Schematic of the experimental procedure in (F) and (H). (H) Graph showing the cumulative frequency of cells exiting from mitosis in the presence of 1 μM nocodazole and 125 nM reversine. Cells were transfected with mock or Plk1 siRNA (3′-UTR), followed by transfection with wild-type (WT) or a kinase-dead mutant (DA) of YFP-Plk1. The indicated number of cells were analysed for each condition from a single experiment, representing three independent experiments. (I) Kinetochore localization of Bub1 in cells treated with reversine and/or BI-2536. Cells expressing CENP-A-GFP (green) arrested in mitosis with 1 μM nocodazole and 10 μM MG132 were incubated with reversine and BI-2536 before fixation. Immunostaining was performed with an anti-Bub1 antibody (red). DNA was stained with DAPI (blue). Scale bar: 5 μm. (J) Quantification of Bub1 level on kinetochores. Fluorescence intensity of Bub1 in cells treated as in (I) is shown. Signal intensity in DMSO-treated cells was set as 1. At least 116 kinetochores per cell (5 cells) were quantified for each condition from a single experiment, representing three independent experiments. Error bars represent S.E. * P < 0.05 (two-tailed t-test).
Figure 3
Figure 3
Plk1 bound to Bub1 on kinetochores promotes the kinase activity of Mps1. (A) Expression of RNAi-resistant GFP-Bub1 in Bub1-depleted cells. HeLa cells were transfected with mock or Bub1 siRNA, followed by transfection with GFP-Bub1 or an RNAi-resistant (sr) GFP-Bub1 construct (wild type; WT) or a mutant unable to bind to Plk1 (T609A (TA)). Cells were then lysed and subjected to western blotting analysis using antibodies against Bub1 or α-tubulin. (B) Kinetochore localization of Plk1 in Bub1-depleted HeLa cells expressing RNAi-resistant GFP-Bub1. HeLa cells transfected with control or Bub1 siRNA followed by transfection with a mock or RNAi-resistant GFP-Bub1 construct (wild type (WT) or T609A) were cultured for 24 h in the presence of 2 mM thymidine and released into fresh medium for 10 h. Then, the cells were incubated with 1 μM nocodazole and 10 μM MG132 for 2 h before fixation and stained with a Plk1 antibody (red) and GFP (green). DAPI was used to stain DNA (blue). Scale bar: 5 μm. (C) Quantification of the Plk1 signal on kinetochores. The fluorescence intensity of Plk1 in cells treated as in (B) was measured for at least 44 kinetochores per cell (5 cells) per condition from a single experiment, representing three independent experiments. The signal intensity in mock-treated cells was set as 1. Error bars represent S.E. *P < 0.05; n.s. P > 0.05 (two-tailed t-test) (D) Phosphorylation of Mps1 on kinetochores in Bub1-depleted cells. Cells were treated as in (B) and stained with an antibody against Mps1-pT676 (red), GFP (green), or Hec1 (blue). Scale bar: 5 μm. (E) Quantification of the Mps1-pT676 signal on kinetochores. The fluorescence intensity of Mps1-pT676 in cells treated as in (D) was measured for at least 42 kinetochores per cell (5 cells) per condition from an experiment, representing three independent experiments. The signal intensity in mock-treated cells was set as 1. Error bars represent S.E. *P < 0.05; **P < 0.001 (two-tailed t-test). (F) Mitotic duration of cells depleted of Bub1 in the presence of 200 nM Taxol and 250 nM reversine. Cells were transfected with control or Bub1 siRNA followed by transfection with a mock or RNAi-resistant GFP-Bub1 construct (WT or T609A (TA)), followed by observation of mitotic duration. More than 46 cells per condition were analysed. Dataset was obtained from a single experiment, representing three independent experiments. The median in the dot plot is indicated by a black bar. ***P < 0.0005; **P < 0.001 (Mann-Whitney U-test).
Figure 4
Figure 4
Plk1 recruited to kinetochores by Bub1 promotes Knl1 phosphorylation. (A) A Knl1 fragment containing the MELT repeats (hKnl1 M) is schematically shown. (B) Phosphorylation of the MELT repeats by Plk1. A Knl1 fragment shown in (A) purified from insect cells was subjected to an in vitro kinase assay in the presence of wild-type (WT) or kinase-dead (DA) Plk1. γ-32P-ATP incorporated into the Knl1 fragment was detected by autoradiography, and Plk1 was detected by western blotting. (C) Knl1 phosphorylation at the MELT repeats in cells treated with BI-2536. Cells expressing CENP-A-GFP (green) in early PM were treated with or without 300 nM BI-2536 and stained with an antibody against a phosphorylated MELT repeat (pMELT; red). DNA was stained with DAPI (blue). Scale bar: 5 μm. (D) Kinetochore localization of Bub1 in nocodazole-treated HeLa cells in the presence of 500 nM reversine with or without calyculin A and BI-2536. Cells expressing CENP-A-GFP (green) were immunostained with an antibody against Bub1 (red). DNA was stained with DAPI (blue). Scale bar: 5 μm. (E) Kinetochore localization of BubR1 in cells treated as in (D). Cells expressing CENP-A-GFP (green) were immunostained with an antibody against BubR1 (red). DNA was stained with DAPI (blue). Scale bar: 5 μm. (F) Quantification of Bub1 and BubR1 on kinetochores. The fluorescence intensity of Bub1 and BubR1 in cells treated as in (D) and (E) is shown. The signal intensity in DMSO-treated cells was set as 1. The intensity of Bub1 or BubR1 obtained from a single experiment, representing three independent experiments, was measured for at least 95 kinetochores per cell (5 cells) per condition. Error bars represent S.E. **P < 0.001; ***P < 0.0005 (two-tailed t-test). (G) Knl1 phosphorylation at the MELT repeats in Bub1-depleted cells. Cells were treated as in Fig. 3B and stained with an antibody against a phosphorylated MELT repeat (pMELT; red), GFP (green), or Hec1 (blue). Scale bar: 5 μm. (H) Quantification of Knl1-pMELT signal on kinetochores. The fluorescence intensity of Knl1-pMELT in cells treated as in (G) was measured for at least 42 kinetochores per cell (5 cells) per condition. Data was obtained from a single experiment, representing three independent experiments. Error bars represent S.E. **P < 0.005; ***P < 0.0005 (two-tailed t-test).
Figure 5
Figure 5
Bub1 artificially anchored to kinetochores augments Knl1 phosphorylation during prometaphase by recruiting Plk1. (A) Plk1 signal on kinetochores in cells expressing GFP–Mis12-Bub1. Cells transfected with a GFP-tagged Mis12 or Mis12–Bub1 construct (wild type (WT) or T609A) were arrested in mitosis by nocodazole treatment, fixed and stained with a Plk1 antibody (red) or GFP (green). DNA was labelled with DAPI (blue). Scale bar: 5 μm. (B) Quantification of the Plk1 signal on kinetochores. The signal intensity of Plk1 on kinetochores in cells treated as in (A) was measured for at least 51 kinetochores per cell (5 cells) per condition. The experiments were repeated three times, and the representative data obtained from a single experiment were shown. Error bars represent S.E. *P < 0.05 (two-tailed t-test). (C) Knl1 phosphorylation at the MELT repeats in HeLa cells expressing GFP-Mis12–Bub1. Cells were treated as in (A) and stained with an antibody against phosphorylated MELT repeats (pMELT; red) or GFP (green). DNA was counterstained with DAPI (blue). Scale bar: 5 μm. (D) Quantification of Knl1-pMELT signal on kinetochores. The fluorescence intensity of Knl1-pMELT in cells treated as in (C) was quantified for at least 31 kinetochores per cell (5 cells) per condition from a single experiment, representing three independent experiments. Error bars represent S.E. *P < 0.05 (two-tailed t-test). (E) Knl1 phosphorylation at the MELT repeats in early mitosis (NEBD, prometaphase (PM), metaphase (Meta)) in cells expressing GFP-Mis12–Bub1. Cells transfected with GFP-tagged Mis12 or Mis12–Bub1 construct (wild type (WT) or T609A) were released from thymidine block for 10 h, fixed and stained with an antibody against a phosphorylated MELT repeat (pMELT; red) or GFP (green). DAPI was used to counterstain DNA (blue). Scale bar: 5 μm. (F) Quantification of the Knl1-pMELT signal on kinetochores. The fluorescence intensity of Knl1-pMELT in cells treated as in (E) was measured for at least 40 kinetochores per cell (5 cells) per condition. The experiments were repeated three times, and the representative data obtained from a single experiment were shown. The signal intensity in GFP-Mis12-expressing cells during NEBD was set as 1. Error bars represent S.E. *P < 0.05 (two-tailed t-test). (G) A model depicting the regulation of SAC activity by Plk1 bound to Bub1. Just before NEBD, the maximum amount of Mps1 localizes on kinetochores and phosphorylates multiple MELT motifs in Knl1 to activate the SAC, leading to the recruitment of SAC components such as Bub3, Bub1 and BubR1. Mps1 is activated by phosphorylation at multiple sites either by Mps1 itself or Plk1, and kinetochore Mps1 sharply decreases in PM. In contrast, Plk1 at kinetochores is elevated in PM through binding to Bub1 phosphorylated by Cdk1. Plk1 bound to Bub1 plays a role in the maintenance of SAC activity in PM, counteracting phosphatases such as PP2A-B56.

Similar articles

Cited by

References

    1. Tanaka K. Regulatory mechanisms of kinetochore-microtubule interaction in mitosis. Cell Mol Life Sci. 2013;70:559–579. doi: 10.1007/s00018-012-1057-7. - DOI - PMC - PubMed
    1. Foley EA, Kapoor TM. Microtubule attachment and spindle assembly checkpoint signalling at the kinetochore. Nat Rev Mol Cell Biol. 2013;14:25–37. doi: 10.1038/nrm3494. - DOI - PMC - PubMed
    1. Cheeseman IM, Desai A. Molecular architecture of the kinetochore-microtubule interface. Nat Rev Mol Cell Biol. 2008;9:33–46. doi: 10.1038/nrm2310. - DOI - PubMed
    1. van de Weerdt BCM, Medema RH. Polo-like kinases - A team in control of the division. Cell Cycle. 2006;5:853–864. doi: 10.4161/cc.5.8.2692. - DOI - PubMed
    1. Qi W, Tang ZY, Yu HT. Phosphorylation- and polo-box-dependent binding of Plk1 to Bub1 is required for the kinetochore localization of Plk1. Mol Biol Cell. 2006;17:3705–3716. doi: 10.1091/mbc.E06-03-0240. - DOI - PMC - PubMed

Publication types

MeSH terms